Polysaccharide conformations measured by solution state x-ray scattering
Abstract
Polysaccharides are semi-flexible polymers composed of sugar residues with a myriad of important functions including structural support, energy storage and immunogenicity. The local conformation of such chains is a crucial factor governing their interactions, where the relative orientation of adjacent sugar rings determines the propensity for hydrogen bonding and specific ion-mediated interactions with neighbouring chains. Traditionally this conformation has only been directly accessible in the solid-state, using crystallographic techniques such as fibre diffraction. Herein it is demonstrated that improvements in the quality of synchrotron-based x-ray scattering data means that conformation-dependent features, the positions of which are related to the linear repeating distance between single saccharide monomers, can now be measured in solution. This technique is expected to be universally applicable for polysaccharides that consist of comparatively stiff glycosidic linkages, and to have extensive relevance for a number of biological macromolecules, including glycosylated proteins.
Polyuronates are a class of charged polysaccharides that play crucial roles in the physiology of both land and marine plants (pectic polymers in the cell walls of land plants contain large amounts of polygalacturonic acid, while brown seaweeds contain alginic polymers comprising of polyguluronic and polymannuronic acids). Understanding the structure of these important polysaccharides is not only crucial for appreciating their biological functionality and how this biomass is exploited, but also understanding key steps in the evolution of life on our planet [1].
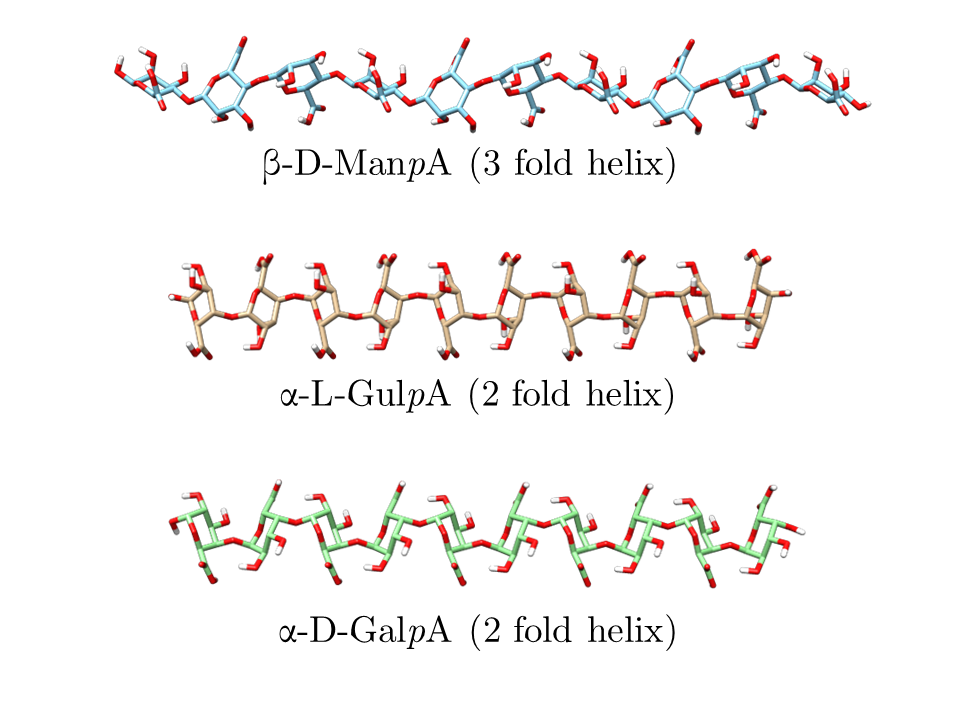
A key aspect of the molecular structure of these polymers is the local helical conformation of the chain, which is dictated by the flexibility of the glycosidic linkage between individual sugar residues, and its response to environmental conditions such as pH, ionic strength, specific ion effects and moisture content. These conformations (e.g 2(1) or 3(1) helices) relate to rotations of consecutive sugar residues along the chain and can be thought of as being characterized by the number of residues after which the local structure appears identical when viewed from the end of the molecule, see figure 1. The orientation of one sugar ring relative to the next along the backbone of multi-residue saccharide chains is determined by the energetics of the glyosidic linkage. Free energy calculations as a function of two angles that uniquely define the spatial relation of one ring to the next typically show several distinct local minima that yield the atomic structures of the maximally populated states of the chain conformation, for example 2(1) or 3(1) helices. The preferred local helical conformation is a function of environmental conditions, such as pH, that modulate the charged nature of the rings and is, amongst other things, key to the propensity of chains to interact with one another to form higher order assemblies. Indeed, the conformation is crucial in determining how the chains interact with each other (including when mediated by specific ions), how chains might respond to mechanical stresses, and how in solution they may interact with other biological macromolecules, such as the enzymes that process them.
Although many solution-based techniques, such as optical rotation measurements, have been applied to observe changes between local helical conformations, the direct measurement of the atomistic structures of the conformational states has, to date, relied on techniques such as fiber diffraction. Direct experimental measurement of these helical conformations has been carried out solely in the solid state, in fibres or gels [2, 3, 4, 5, 6, 7], or in crystals formed from oligomeric components [8], using x-ray diffraction techniques. Indeed there is a rich history of the determination these states and their sensitivity to different preparation conditions [9, 10].
As the force fields used to model these molecules in molecular dynamics simulations [11, 12, 13] are refined, the correct prediction of these helical conformational states in solution (or when bound to chelating ions) is a crucial requirement [14]. However, at present predictions can only be compared with experimental results that have been measured in the condensed state. While for simulations of multiple chains binding ions between them, commonly carried out in an attempt to clarify aggregation mechanisms that underlie phenomena such as gelation, this seems reasonable [15], direct comparison with solution state data has been lacking.
Here for the first time it is shown that careful x-ray scattering experiments using synchrotron radiation can directly reveal the helical conformation of polysaccharide chains in the solution state. While many SAXS studies have been carried out on pectin and alginate solutions and gels, the focus has been on attempting to understand the formation of the so-called junction zones [16, 10] (stress bearing connections that build the polymers into a gel network) and their chain multiplicity [17, 18, 19, 20] or on attempts to fit the data to the predictions of statistical physics models of chain configuration of varying degrees of complexity [21, 22]. In this work by performing experiments on different oligosaccharides that comprise of varying types of sugar residues, have different inter-ring linkages (di-axial or di-equatorial), and are therefore predicted to exhibit different helical conformations in the solution state, we conclusively show that it is now possible at modern synchrotron facilities to obtain sufficient signal to noise ratios, even at traditionally-ignored high q values, to directly reveal the helical conformation of polysaccharide chains in the solution state. Such high q values would traditionally be thought of as WAXS, and would not typically be recorded concurrently in routine biological solution SAXS experiments. Additional comparison of the results of calculation and experiment for several different degrees of polymerisation lends further weight to our contention regarding the origin and usefulness of the observed high-q peaks.
Oligomeric forms of the two components of alginate, -D-Mannopyranuronic acid (-D-ManpA) and -L-Gulopyranuronic acid (-L-GulpA), with degrees of polymerisation (dp) of 5, 10 and 20 were purchased from Elicityl (http://www.elicityl-oligotech.com). Samples were dissolved, as received, in ultra pure water (18.2 M) to give a final concentration of 50 g/L. Oligomeric pectic acid, -D-Galactopyranose (-D-GalpA) with dps of 6 and 10 were homemade (see ref. [24] or the Supplemental Material [25]) and were dissolved in ultra pure water to give final concentrations of 12.5 and 15 g/L, respectively. A sample of -D-GalpA containing a mixture of dps between 25-50 purchased from Elicityl (referred to as OGA) was prepared identically to give a concentration of 31 g/L. The concentrations were selected in order to maximise the signal while optimising the amount of experiments that could be carried out given the amount of sample available. Between them this sample set spans components of the key anionic polysaccharides alginate and pectin.
The small and wide angle X-ray scattering beamline at the Australian Synchrotron was utilized to produce monochromatic X-rays of 15 keV and irradiate samples (multiple 1 second durations) contained in a 1.5 mm path-length solution flow cell running at a rate of 5 L/sec [26]. Scattered radiation was collected on a Pilatus 1M (Dectris, Switzerland) detector located 0.7379 m from the sample. Background and sample measurements were performed under identical conditions with integration and reduction performed using the standard beamline protocols and the measured intensity put onto an absolute scale using water as a standard [26]. The magnitude of the scattering vector is defined as where is the wavelength of the incident beam and the angle between the incident beam and the scattered radiation.
During a solution state X-ray scattering experiment the measured scattering, after background subtraction, is a combination of amplitudes from the molecule of interest in-vacuo , a boundary layer of water which will have a different density to bulk water, and an excluded volume of water [27]. The three components are related by
| (1) |
where is the density of the bulk solvent, is the difference in density between the bulk and boundary layer solvent and indicates an average over solid angle in reciprocal space [27]. The small angle scattering for Å-1 from a molecule in solution can be routinely calculated with a number of different software packages. While scattering at Å-1 (wide angle regime) is significantly more difficult to model due to the length-scales approaching the first peak in the water structure factor, which makes accurately accounting for difficult. Here we used two methods to ensure that the calculated features were independent of the specific software utilized and the particular implementation used in accounting for boundary water and excluded solvent volume. Firstly, calculations were performed using a recent version of the popular software CRYSOL, CRYSOL 3.0 [28], which incorporates the three necessary amplitudes and, importantly measurements at Å-1, of dummy water molecules for use in . CRYSOL 3.0 is designed to produce more accurate results into the WAXS regime than CRYSOL version 2 [28]. Secondly, we independently calculated the scattering in-vacuo, (i.e. ) using the Debye equation [29, 30] combined with atomic scattering factors accurate to 6 Å-1 using the method outlined in ref. [31]. The Debye equation is defined as:
| (2) |
Where is the calculated scattering intensity in electron units, is the Euclidean distance between the and atom and is the atomic scattering factor. The differential scattering cross section (), which could be directly compared to the experimentally acquired intensity after normalization for the number of molecules in the scattering volume, was obtained through: , where the c subscript indicates in-vacuo calculation and is the electron radius. It should be noted that a slight difference between and exists due to the differences described by equation 1.
Real-space oligomer structures were constructed using POLYS software [32, 33]. The dihedral angles, which define the free-energy minimizing structure were obtained from ref [23]. The results reported in ref. [23] agree well with those obtained from fibre diffraction [2, 3, 4, 5, 6, 7]. Where available, structures from the Protein Data Bank were also compared and results are available in the Supplemental Material [25].
The structures of the three key polyuronates investigated in this letter, at the calculated global free energy minima and in the absence of thermal fluctuations, are shown in figure 1. It can be seen that the chains conform to a linear arrangement with monomers spaced at different regular intervals along the chain. Such a conformation gives rise to discrete regions of high and low electron density and subsequently a Bragg reflection is predicted experimentally to result from x-ray scattering if the in-vitro solution state conformation of the chains resembles the calculated free-energy-minimizing conformation. Alternatively, significant deviations from this conformation, as a result of thermal fluctuations randomizing the monomer positions, would result in no observed Bragg reflection. The existence of an experimentally-detected Bragg peak at the calculated scattering vector would not only be evidence of the validity of the atomic coordinates used to model the solution state conformation, but would also be reflective of the intrinsic rigidity of the glycosidic backbone. Furthermore, measured changes, or the lack of changes in the peak shape with increasing dp are predicted to reveal the length-scale below which the chains can be considered rigid.
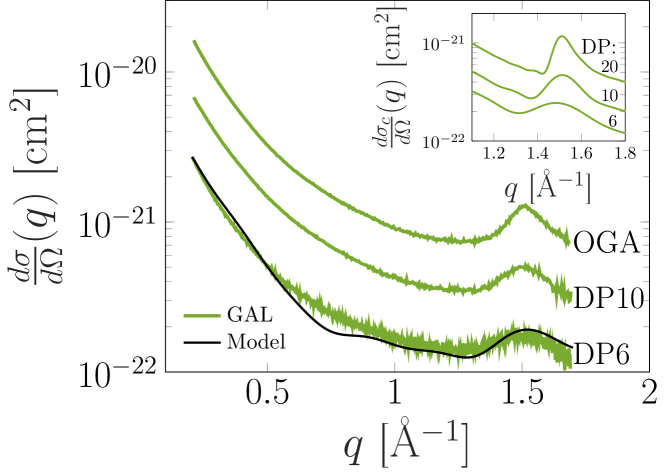
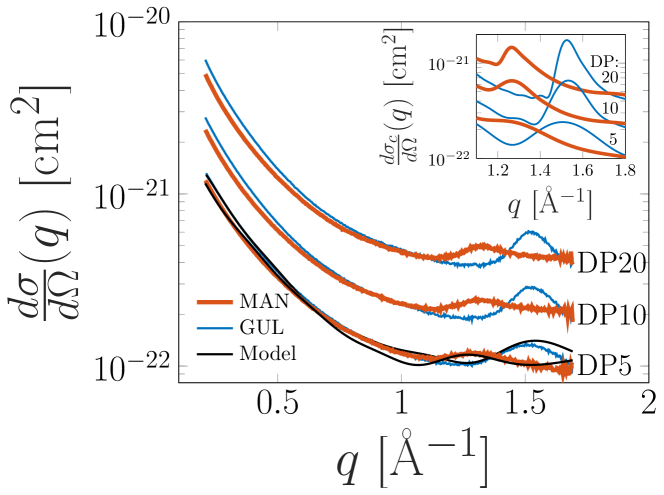
Figure 2 shows the solution x-ray scattering results for the two alginic acids and figure 3 the polygalacturonic acid. It can be seen that a single broad Bragg peak exists in the high-q regime for each species, consistent with the position calculated from the conformers shown in figure 1 using CRYSOL 3.0. (At Å-1 the calculated and experimentally obtained data differs, which we suggest is the result of currently neglecting thermal fluctuations and the small population of other states in the ensemble in the calculation, and this is being investigated in ongoing work employing molecular dynamics.) Figure 2 shows the significant difference in peak position and shape between the results obtained for -L-GulpA and -D-ManpA. Such a large effect is primarily the result of differences in the geometry of the glycosidic linkage, which is either di-axial for -L-GulpA or di-equatorial for -D-ManpA. However calculations using chains with glycosidic linkage orientations in the second most populated conformation: a 3(1) helix instead of the most populated 2(1) for -L-GulpA, and a 2(1) helix instead of the most populated 3(1) for -D-ManpA, showed that the peak positions deviated by 0.1-0.2 Å-1 purely based on the local helical twist irrespective of the linkage type (see the Supplemental Material [25]). As our data shows, this deviation was clearly visible in the measured peak positions demonstrating that the average free-energy-minimising solution state conformation can be readily obtained with sub Ångstrom accuracy.
Figures 2 and 3 further show measured changes in the peak shape with increasing dp. It can be seen that at dp=5 and dp=6, respectively, the calculated peak height and width for all three conformers agrees with that obtained experimentally. The -D-ManpA shows little difference in peak height or width with increasing dp, compared to -L-GulpA and -D-GalpA. This is a result of the increased flexibility of the di-equatorial linked -D-ManpA, compared to its two more rigid brethren. -L-GulpA and -D-GalpA show increasing peak height and a slight decrease in width at dp=10, above which the peak width and height displays little change compared to the predicted scattering for longer rigid sections of chains (see the inserts of figures 2 and 3). Differences here can be attributed to the flexibility of the glycosidic linkage and are observed above the length-scale at which the average conformation deviates from a rigid linear chain (between dp=6 and dp=10). As would be predicted the -L-GulpA and -D-GalpA show near identical scattering due to these two conformers being mirror images of each other.
The ability to obtain direct structural information regarding the local helical conformation, to sub Angstrom accuracy, in the solution state, is crucial for improving the structural characterization of polysaccharides under conditions not attainable in the condensed state and / or when crystallization is not possible. We have shown that with careful measurements solution state x-ray scattering with synchrotron radiation can resolve atomistic features that reveal the average local helical conformation of the chains, together with information about the intrinsic flexibility of the different linkages.
The authors thank Benjamin Westberry for assistance with sample transportation and Nigel Kirby for assistance during data acquisition. The NZ synchrotron group are acknowledged for travel funding. Part of this research was undertaken on the SAXS/WAXS beam-line at the Australian Synchrotron, part of ANSTO. Post doctoral funding for BM was provided by the Ministry of Science and Technology, Taiwan under grant No. MOST 105-2221-E-007-137-MY3.
References
- Hobbs et al. [2016] J. K. Hobbs, S. M. Lee, M. Robb, F. Hof, C. Barr, K. T. Abe, J.-H. Hehemann, R. McLean, D. W. Abbott, and A. B. Boraston, Kdgf, the missing link in the microbial metabolism of uronate sugars from pectin and alginate, Proceedings of the National Academy of Sciences 113, 6188 (2016).
- Palmer and Hartzog [1945] K. Palmer and M. B. Hartzog, An x-ray diffraction investigation of sodium pectate, Journal of the American Chemical Society 67, 2122 (1945).
- Wuhrmann and Pilnik [1945] K. Wuhrmann and W. Pilnik, Über optik und feinbau des pektins und seiner derivate, Experientia 1, 330 (1945).
- Walkinshaw and Arnott [1981] M. Walkinshaw and S. Arnott, Conformations and interactions of pectins: I. x-ray diffraction analyses of sodium pectate in neutral and acidified forms, Journal of molecular biology 153, 1055 (1981).
- Atkins et al. [1973a] E. Atkins, I. Nieduszynski, W. Mackie, K. Parker, and E. Smolko, Structural components of alginic acid. ii. the crystalline structure of poly--l-guluronic acid. results of x-ray diffraction and polarized infrared studies, Biopolymers: Original Research on Biomolecules 12, 1879 (1973a).
- Atkins et al. [1973b] E. Atkins, I. Nieduszynski, W. Mackie, K. Parker, and E. Smolko, Structural components of alginic acid. ii. the crystalline structure of poly--l-guluronic acid. results of x-ray diffraction and polarized infrared studies, Biopolymers: Original Research on Biomolecules 12, 1879 (1973b).
- Mackie [1971] W. Mackie, Conformations of crystalline alginic acids and their salts., Biochemical Journal 125, 89P (1971).
- Rigby et al. [2000] N. M. Rigby, A. J. MacDougall, S. G. Ring, P. Cairns, V. J. Morris, and P. A. Gunning, Observations on the crystallization of oligogalacturonates, Carbohydrate research 328, 235 (2000).
- Morris et al. [1982] E. Morris, D. Powell, M. Gidley, and D. Rees, Conformations and interactions of pectins: I. polymorphism between gel and solid states of calcium polygalacturonate, Journal of molecular biology 155, 507 (1982).
- Li et al. [2007] L. Li, Y. Fang, R. Vreeker, I. Appelqvist, and E. Mendes, Reexamining the egg-box model in calcium- alginate gels with x-ray diffraction, Biomacromolecules 8, 464 (2007).
- Perić et al. [2008] L. Perić, C. S. Pereira, S. Perez, and P. H. Hünenberger, Conformation, dynamics and ion-binding properties of single-chain polyuronates: a molecular dynamics study, Molecular Simulation 34, 421 (2008).
- Plazinski and Rudzinski [2012] W. Plazinski and W. Rudzinski, Molecular modeling of ca2+-oligo (-l-guluronate) complexes: toward the understanding of the junction zone structure in calcium alginate gels, Structural Chemistry 23, 1409 (2012).
- Panczyk et al. [2018] K. Panczyk, K. Gaweda, M. Drach, and W. Plazinski, Extension of the gromos 56a6carbo/carbo_r force field for charged, protonated, and esterified uronates, The Journal of Physical Chemistry B 122, 3696 (2018).
- Wolnik et al. [2013] A. Wolnik, L. Albertin, L. Charlier, and K. Mazeau, Probing the helical forms of ca2+-guluronan junction zones in alginate gels by molecular dynamics 1: Duplexes, Biopolymers: Original Research on Biomolecules 99, 562 (2013).
- Mackie et al. [1983] W. Mackie, S. Perez, R. Rizzo, F. Taravel, and M. Vignon, Aspects of the conformation of polyguluronate in the solid state and in solution, International Journal of Biological Macromolecules 5, 329 (1983).
- Sikorski et al. [2007] P. Sikorski, F. Mo, G. Skjåk-Bræk, and B. T. Stokke, Evidence for egg-box-compatible interactions in calcium- alginate gels from fiber x-ray diffraction, Biomacromolecules 8, 2098 (2007).
- Stokke et al. [2000] B. T. Stokke, K. I. Draget, O. Smidsrød, Y. Yuguchi, H. Urakawa, and K. Kajiwara, Small-angle x-ray scattering and rheological characterization of alginate gels. 1. ca- alginate gels, Macromolecules 33, 1853 (2000).
- Yuguchi et al. [2000] Y. Yuguchi, H. Urakawa, K. Kajiwara, K. Draget, and B. Stokke, Small-angle x-ray scattering and rheological characterization of alginate gels. 2. time-resolved studies on ionotropic gels, Journal of Molecular Structure 554, 21 (2000).
- Yuguchi et al. [2016] Y. Yuguchi, A. Hasegawa, A. M. Padoł, K. I. Draget, and B. T. Stokke, Local structure of ca2+ induced hydrogels of alginate–oligoguluronate blends determined by small-angle-x-ray scattering, Carbohydrate polymers 152, 532 (2016).
- Schuster et al. [2011] E. Schuster, A. Cucheval, L. Lundin, and M. A. Williams, Using saxs to reveal the degree of bundling in the polysaccharide junction zones of microrheologically distinct pectin gels, Biomacromolecules 12, 2583 (2011).
- Ventura et al. [2013] I. Ventura, J. Jammal, and H. Bianco-Peled, Insights into the nanostructure of low-methoxyl pectin–calcium gels, Carbohydrate polymers 97, 650 (2013).
- Josef and Bianco-Peled [2012] E. Josef and H. Bianco-Peled, Conformation of a natural polyelectrolyte in semidilute solutions with no added salt, Soft Matter 8, 9156 (2012).
- Braccini et al. [1999] I. Braccini, R. P. Grasso, and S. Pérez, Conformational and configurational features of acidic polysaccharides and their interactions with calcium ions: a molecular modeling investigation, Carbohydrate Research 317, 119 (1999).
- Mansel et al. [2019] B. W. Mansel, A. H. Irani, T. M. Ryan, D. J. McGillivray, H.-L. Chen, and M. A. Williams, Resolving solution conformations of the model semi-flexible polyelectrolyte homogalacturonan using molecular dynamics simulations and small-angle x-ray scattering, The European Physical Journal E 42, 19 (2019).
- [25] See Supplemental Material attached at the end of document for detailed sample preparation information, further model fitting and table of dihedral angles used for real-space models of conformers.
- Kirby et al. [2013] N. M. Kirby, S. T. Mudie, A. M. Hawley, D. J. Cookson, H. D. Mertens, N. Cowieson, and V. Samardzic-Boban, A low-background-intensity focusing small-angle x-ray scattering undulator beamline, Journal of Applied Crystallography 46, 1670 (2013).
- Svergun et al. [1995] D. Svergun, C. Barberato, and M. H. Koch, Crysol-a program to evaluate x-ray solution scattering of biological macromolecules from atomic coordinates, Journal of applied crystallography 28, 768 (1995).
- Franke et al. [2017] D. Franke, M. Petoukhov, P. Konarev, A. Panjkovich, A. Tuukkanen, H. Mertens, A. Kikhney, N. Hajizadeh, J. Franklin, C. Jeffries, et al., Atsas 2.8: a comprehensive data analysis suite for small-angle scattering from macromolecular solutions, Journal of applied crystallography 50, 1212 (2017).
- Scardi et al. [2016] P. Scardi, S. J. Billinge, R. Neder, and A. Cervellino, Celebrating 100 years of the debye scattering equation, Acta Crystallographica. Section A, Foundations and Advances (Online) 72 (2016).
- Debye [1915] P. Debye, Scattering from non-crystalline substances, Ann. Physik 46, 809 (1915).
- Waasmaier and Kirfel [1995] D. Waasmaier and A. Kirfel, New analytical scattering-factor functions for free atoms and ions, Acta Crystallographica Section A: Foundations of Crystallography 51, 416 (1995).
- Engelsen et al. [1996] S. B. Engelsen, S. Cros, W. Mackie, and S. Pérez, A molecular builder for carbohydrates: application to polysaccharides and complex carbohydrates, Biopolymers 39, 417 (1996).
- Engelsen et al. [2014] S. B. Engelsen, P. I. Hansen, and S. Perez, Polys 2.0: An open source software package for building three-dimensional structures of polysaccharides, Biopolymers 101, 733 (2014).