Zonal reconstruction of photonic wavefunction via momentum weak measurement
Abstract
Direct measurement of wave functions has attracted great interests and many different methods have been developed. However, the precision of current techniques is limited by the use of Fourier transform lenses. These measurements require to shear cut the part of particles with momentum , which greatly restricts the efficiency and application of the approaches. Here, we propose and experimentally demonstrate a method to directly measure two-dimensional photonic wave functions by combining the momentum weak measurement technology and the zonal wavefront restoration algorithm. Both the Gaussian and Laguerre-Gaussian wave functions are experimentally well reconstructed. Our method avoids using the Fourier lens and post selection on the momentum . We further apply it to measure wavefronts with ultra-high spatial frequency, which is difficult for traditional Shack-Hartmann wavefront sensing technologies. Our work extends the ability of quantum weak measurement and would be useful for wavefront sensing.
I Introduction
The construction of the wave function of a quantum system is of fundamental and practical importance. Quantum state tomography breitenbach1997measurement ; smithey1993measurement is an indirect method to establish the quantum states, which requires a large set of strong measurements and post-processing of these information. In 2011, Lundeen et al. introduced a direct measurement of quantum states via weak measurement lundeen2011direct , which reduced the complexity in characterizing a quantum system. Thereafter great interests have been attracted to extend the application to different types of quantum system, such as mixed lundeen2012procedure and high-dimensional mirhosseini2014compressive ; malik2014direct states. In the technical aspect, the proposal of direct measurement via scan-free measurement shi2015scan and strong measurement zhang2018direct further improved the technique of direct wave function construction.
In general, the direct measurement of photonic wave functions consists the Fourier transform lens to achieve transformation of coordinate space and position space, in order to shear cut the part of particles with the momentum . The extraction on the part of increases the experimental complexity and it usually causes the loss of photons. In addition, the photonic wave function that is outside from (higher modes) is always hard to reconstruct. On the other hand, the experiments lundeen2011direct ; lundeen2012procedure ; mirhosseini2014compressive ; malik2014direct considering the weak measurement of positions followed by a strong measurement of the momentum, often require scanning in the coordinate space, which is time consuming and would be hard to realize in characterizing high dimensional quantum systems.
Here, we demonstrate a Lens-less and scan-free direct measurement of photonic two-dimensional transverse wave functions. We obtain the momentum information directly via weak measurement kocsis2011observing ; xiao2017experimental rather than shear cut the photons at the momentum . Combining with the zonal wavefront reconstruction algorithm Regional , the photonic two-dimensional transverse wave function can be established. Both the Gaussian and Laguerre-Gaussian wave functions Allen are experimentally well reconstructed.
Naturally, the wave function reconstruction is closely related to the wavefront sensing, which is widely used in astronomy roddier1999adaptive ; lofdahl1994wavefront , medicine liang1994objective ; prieto2000analysis and laser technology roorda2002adaptive . The traditional Shack-Hartmann wavefront sensor (SHWFS) Hartmann ; platt1971lenticular has the difficulty in realizing accurate sampling of wavefront slopes for the limitation of lens arrays, which results in a low spatial resolution of reconstructed wavefronts.Our work provides a new tack for high precision wave-front slopes sampling by detecting momentum weak values, and achieves pixel-level wavefront reconstruction, which is of great significance for wavefront sensing. We further experimentally reconstruct wavefronts which are diffused by a strong scattering medium. The results show that this method has advantages in wavefront sensing with a high spatial frequency.
II Theoretical framework
In 1988, Aharonov, Albert and Vaidman firstly proposed the concept of weak measurements aharonov1988result , which required very weak interaction between the system and a pointer system. Usually, weak measurements of wave functions rest on the sequential measurements of conjugate observables. The first measurement of the momentum along the direction r is weak enough followed by a strong measurement on the position (also known as ”post selection”). Assuming that the observable of the system to be measured is the momentum , the initial state is , and the ”post-selected” state is the coordinate , the momentum weak value (taking ) is given as,
| (1) |
If the direction is chosen as (), we can get the horizontal (vertical) momentum of particles . According to the momentum distribution, we can reconstruct the phase of the wave function,
| (2) |
where , of which represents the wavelength. The transverse wave function is then given by , where is the amplitude and can be obtained via the projection measurement. See more theoretical details in the Methods.
By encoding the polarization of photons as the pointer system, the photon’s momentum weak value can be detected by using birefringent crystals xiao2017experimental , in which no Fourier lenses and shear cut photons at are needed. In addition, the post selection on () can be performed on all position states at the same time through the use of an array photodetector. Therefore the momentum weak value at all positions can be measured simultaneously, which does not require scanning.
III Experimental results
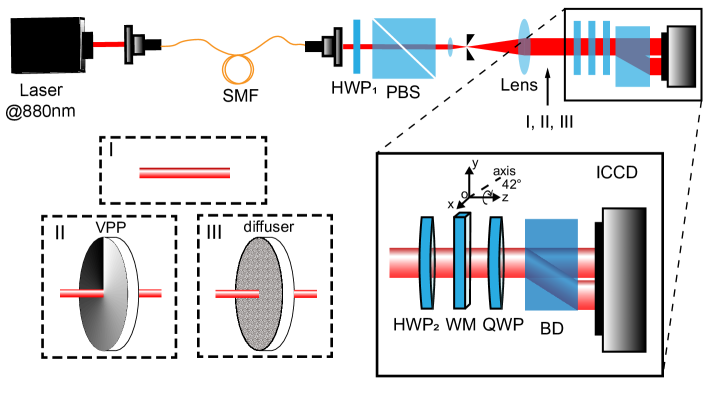
The experimental setup is shown in Fig. 1. An infrared laser with a central wavelength of 880 nm is used and then is coupled into a single mode fiber (SMF). A half wave plate (HWP1) and a polarization beam splitter (PBS) are used to set the polarization. A spatial filter consists two lenses with focal lengths of 50 mm and 100 mm, respectively, and a pinhole with 50 um diameter placing between them. The beam diameter is expanded to about 1 mm after the spatial filter. Here three optical channels are used: the Guassian light beam (I) passes directly; (II) passes though a vortex phase plate (VPP) Genevet to prepared the Laguerre-Gaussian mode with the orbital angular momenta of l=1; (III) passes though a diffuser (600 grits) to prepared a scattered mode. Another HWP2 set at is used to rotate the polarization into a superposition state , where represents the horizontal (vertical) polarization. The light beam further passes through a thin calcite with the thickness of 0.7 mm. To measure the momentum weak values along the x axis (), the optical axis is set in the x-z plane, which is oriented at with respect to the z axis. To measure the momentum weak values along the y axis (), the calcite is rotated by to let the optic axis in the y-z plane. A relative phase is introduced between the vertical and horizontal polarization states, described as , where the dimensionless coupling strength approximates 336 xiao2017experimental .
A quarter-wave plate (QWP) with the axis set to and a beam displacer (BD) are used to project the final polarization states into the right/left-hand circular basis (). The corresponding beam intensities and are detected by an intensified charge coupled device (ICCD) camera, which consists of 10241024 pixels and the length of each square pixel is . The wave function phase gradient can be measured to be
| (3) |
For each pixel , the discrete wavefront phase distribution can be obtained as (also known as Hudgin model hudgin1977wave ):
| (4) | |||||
| (5) |
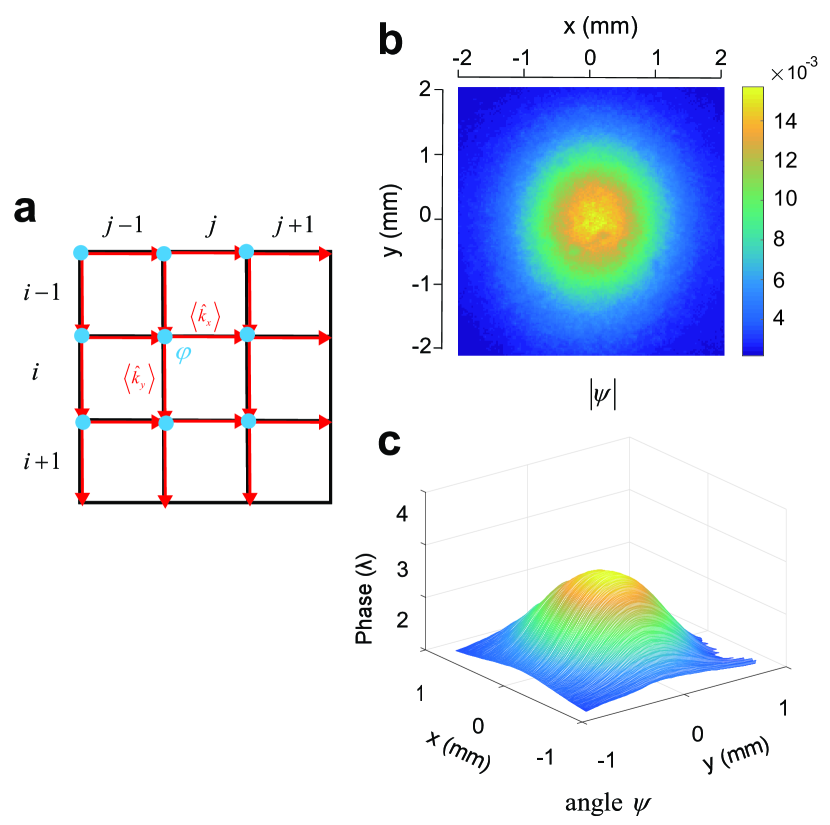
According to Eqs. (4) and (5), we can iteratively calculate the wave function phase distribution, which is shown in Fig. 2a. The black edge grids represent the pixels of ICCD, while the blue dots donate the phase points and the red “” represent the directions and positions of momenta. The final wave function can be obtained through the zonal wavefront reconstruction algorithm as , where is the normalization beam intensity distribution directly measured by the ICCD camera. There is no photon loss in our experiment. The complete wavefront phase can then obtained by the zonal wavefront reconstruction algorithm.
We firstly employ the proposed method to directly measure the Gaussian spatial wave function. The initial intensity distribution of each pixel is detected directly by ICCD. We can get normalized light intensity , which represents . The corresponding experimental is shown in Fig. 2b. We further directly obtain the phase distribution as shown in Fig. 2c, which is a typical Gaussian phase distribution.
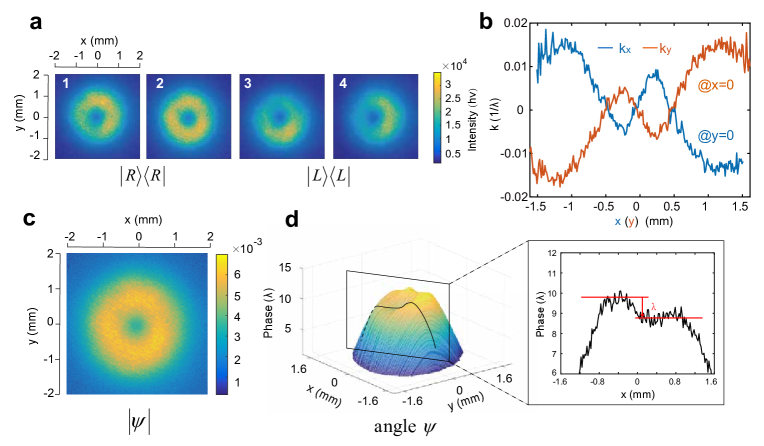
We further measure the wave function of high order modes. The initial wavefunction is prepared to be the Laguerre-Gaussian mode with the orbital angular momenta of . The panels signed with 1 and 3 in Fig. 3a represents the intensity distributions with left/right-handed circular polarizations, respectively, when measuring . While, the panes signed with 2 and 4 in Fig. 3a represent the intensity distributions with left/right-handed circular polarizations, respectively, when measuring . The brown and blue lines in Fig. 3b show the variation of at y=0 and at x=0, respectively. When closing to the center, the momentum reversely changes, which results that the photons travel spirally. The momentums along x and y directions distribute symmetrically because the wave function is spatially symmetric. The normalized amplitude of the Laguerre-Gaussian mode is shown in Fig. 3c. The phase distribution of the transverse wave functions restored by the momentum information is shown in Fig. 3d. The inset shows the phase distribution on the cross section of y=-0.4 mm. It can be clearly observed that the wave function phase of x0 is lagging behind that of x0, which is consistent with the theoretical Laguerre-Gaussian spatial wave function.
Direct measurement of the photonic wave functions can be naturally applied in wavefronts sensing. Our method can further be used to reconstruct the wavefronts with ultra-high spatial frequency that are always presented after some scattering medium, such as diffusers bertolotti2012non ; he2013image ; yang2018deep , multi-mode fibers redding2013all and so on. The wavefronts are hard to detect by traditional wavefront sensors, such as SHWFS. Based on the two-dimensional momentum weak measurements, we can achieve densely sampling of wavefront slopes, and the wavefront can be restored of pixel-level resolution. Some numerical simulations are shown in the Supplementary Information (SI) SI .
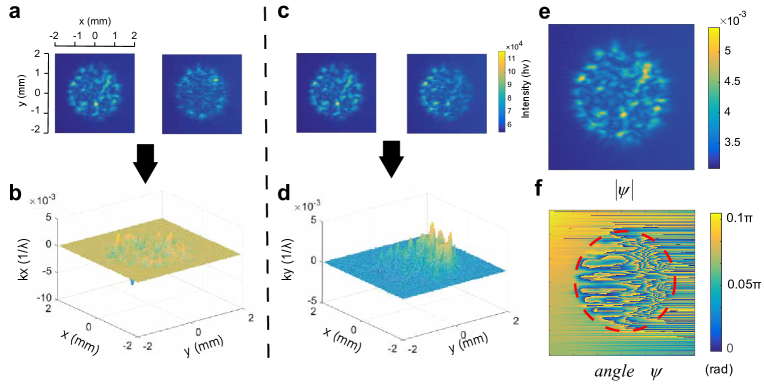
We experimentally reconstruct the wavefront which is scattered by a diffuser (600 grits). When the optical axis of weak measurement crystal is set in x-z plane, the intensity distributions are projected to the right-hand and left-hand circular polarizations, respectively, as shown in Fig. 4a right (left) panel is the intensity distribution project to the right (left) - hand circular polarization). Fig. 4b shows the momentum distribution . Similarly, when detecting the momentum distribution , the light beam is post-selected on the right (left)-hand circular polarization, of which the results are shown in Fig. 4c and d. The normalized intensity and phase of the scattered light beam are shown in Fig. 4e and f, respectively. For the measurement errors of scattering modes, phase distributions are of stripe noise. By modding , we still find the contour phase map obviously which is shown in the red circle in Fig. 4f.
IV Conclusion
We have proposed a lens-less direct measurement of photonic two-dimensional wave functions, by employing momentum weak values. The Gaussian spatial wave function and Laguerre-Gaussian wave function are experimentally reconstructed. For the higher mode, the phase retardation of photons carrying orbital angular momentum of momenta was observed.
Our method can be further used for wavefront sensing. Especially, it can be applied to reconstruct wavefronts with high spatial frequencies, which can not be well achieved by the traditional methods. The wavefunction diffused by a scattering medium is also experimentally reconstructed.
The combination of quantum weak measurements and classical wavefront restoring algorithms not only provides a scheme for the photonic wave function reconstruction, but also greatly improves the accuracy of wavefront sensing. Our work extends the ability of weak measurement and would be useful for wavefront sensing. By optimizing the algorithm, the accuracy can be further improved.
V Acknowledgements
This work was supported by the National Key Research and Development Program of China (Grant No. 2016YFA0302700 and 2017YFA0304100), the National Natural Science Foundation of China (Grants No. 61725504, 11774335 and 11821404), the Key Research Program of Frontier Sciences, Chinese Academy of Sciences (CAS) (Grant No. QYZDY-SSW-SLH003), Science Foundation of the CAS (No. ZDRW-XH-2019-1), Anhui Initiative in Quantum Information Technologies (AHY060300 and AHY020100), the Fundamental Research Funds for the Central Universities (Grant No. WK2030380017 and WK2470000026).
VI Conflict of Interest
The authors declare no competing financial interests.
VII Keywords
weak measurement, momentum weak values, wavefunction direct measurement, zonal high-resolution wavefront sensing, zonal wavefront restoration algorithm
References
- (1) G. Breitenbach, S. Schiller, and J. Mlynek, “Measurement of the quantum states of squeezed light,” Nature 387, 471-475 (1997).
- (2) D. T. Smithey, M. Beck, M. G. Raymer, and A. Faridani, “Measurement of the Wigner distribution and the density matrix of a light mode using optical homodyne tomography: application to squeezed states and the vacuum,” Phys. Rev. Lett. 70, 1244 (1993).
- (3) J. S. Lundeen, B. Sutherland, A. Patel, C. Stewart, and C. Bamber, “Direct measurement of the quantum wavefunction,” Nature 474, 188 (2011).
- (4) J. S. Lundeen, and C. Bamber, “Procedure for direct measurement of general quantum states using weak measurement,” Phys. Rev. Lett. 108, 070402 (2012).
- (5) M. Mirhosseini, O. S. Magaña-Loaiza, S. M. H. Rafsanjani, and R. W Boyd “Compressive direct measurement of the quantum wave function,” Phys. Rev. Lett. 113, 090402 (2014).
- (6) M. Malik, M. Mirhosseini, M. P. Lavery, J. Leach, M. J. Padgett, and R. W. Boyd, “Direct measurement of a 27-dimensional orbital-angular-momentum state vector,” Nature comm. 5, 3115 (2014).
- (7) Z. Shi, M. Mirhosseini, J. Margiewicz, M. Malik, F. Rivera, Z. Zhu, and R. W. Boyd, “Scan-free direct measurement of an extremely high-dimensional photonic state,” Optica 2, 388-392 (2015).
- (8) C. R. Zhang, M. J. Hu, Z. B. Hou, J. F. Tang, J. Zhu, G. Y. Xiang, C. F. Li, G. C. Guo, and Y. S. Zhang, “Direct Measurement of the Two-dimensional Spatial Quantum Wavefunction via Strong Measurements,” arXiv:1811.01560 (2018).
- (9) S. Kocsis, B. Braverman, S. Ravets, M. J. Stevens, R. P. Mirin, L. K. Shalm, and A. M. Steinberg, “Observing the average trajectories of single photons in a two-slit interferometer” Science 332, 1170-1173 (2011).
- (10) Y. Xiao, Y. Kedem, J. S. Xu, C. F. Li, and G. C. Guo, “Experimental nonlocal steering of Bohmian trajectorie,” Opt. Express 25, 14463-14472 (2017).
- (11) H. W. Southwell, “Wave-front estimation from wave-front slope measurements,” JOSA 70, 988-1006 (1980).
- (12) L. Allen, M. W. Beijersbergen, R. J. C. Spreeuw and J. P. Woerdman, Orbital angular momentum of light and the transformation of Laguerre-Gaussian laser modes. Phys. Rev. A, 45, 8185 (1992).
- (13) F. (Ed.) Roddier, Adaptive optics in astronomy (Cambridge university press, 1999).
- (14) M. G. Löfdahl, and G. B. Scharmer, “Wavefront sensing and image restoration from focused and defocused solar images,” Astron. Astrophys., Suppl. Ser. 107, 243-264 (1994).
- (15) J. Liang, B. Grimm, S. Goelz, and J. F. Bille, “Objective measurement of wave aberrations of the human eye with the use of a Hartmann? Shack wave-front sensor,” JOSA A 11, 1949-1957 (1994).
- (16) P. M. Prieto, F. Vargas-Martın, S. Goelz,and P. Artal, “Analysis of the performance of the Hartmann–Shack sensor in the human eye,” JOSA A 17, 1388-1398 (2000).
- (17) A. Roorda, F. Romero-Borja, W. J. Donnelly III, H. Queener, T. J. Hebert, and M. C. Campbell, “Adaptive optics scanning laser ophthalmoscopy,” Opt. Express 10, 405-412 (2002).
- (18) J. Hartmann, “Objektivuntersuchungen,” Springer. (1904).
- (19) B. Platt, and R. V. Shack, “Lenticular hartmann screen” Newsletter 5, 15 (1971).
- (20) Y. Aharonov, D. Z. Albert, and L. Vaidman, “How the result of a measurement of a component of the spin of a spin-1/2 particle can turn out to be 100,” Phys. Rev. Lett. 60, 1351 (1988).
- (21) P. Genevet, N. Yu, F. Aieta, J. Lin, M. A. Kats, R. Blanchard, M. O. Scully, Z. Gaburro, and F. Capasso, “Ultra-thin plasmonic optical vortex plate based on phase discontinuities,” Appl. Phys. Lett., 100, 013101 (2012).
- (22) R. H. Hudgin, “Wave-front reconstruction for compensated imaging,” JOSA 67, 375-378 (1977).
- (23) J. Bertolotti, E. G. van Putten, C. Blum, A. Lagendijk, W. L. Vos, and A. P. Mosk, “Non-invasive imaging through opaque scattering layers,” Nature 491, 232 (2012).
- (24) H. He, Y. Guan, and J. Zhou, “Image restoration through thin turbid layers by correlation with a known object,” Opt. Express 21, 12539-12545 (2013).
- (25) M. Yang, Z. H. Liu, Z. D. Cheng, J. S. Xu, C. F. Li, and G. C. Guo, “Deep Hybrid Scattering Image Learning,” J. Phys. D: Appl. Phys. 52 115105 (2019)
- (26) B. Redding, S. M.Popoff, and H. Cao, “All-fiber spectrometer based on speckle pattern reconstruction,” Opt. Express 21, 6584-6660 (2013).
- (27) see more details in supplementary information
- (28) F. Z. von, “Beugungstheorie des schneidenver-fahrens und seiner verbesserten form, der phasenkontrastmethode,” Physica 1, 689-704 (1934).