Group pre-processing versus cluster ram-pressure stripping: the case of ESO156-G029
Abstract
We report on observations of ESO156-G029, member of a galaxy group which is positioned at the virial radius of cluster Abell 3193. ESO156-G029 is located 1.4 Mpc in projected distance from the brightest cluster galaxy NGC1500. We show that ESO156-G029 has disturbed gas kinematics and a highly asymmetric neutral hydrogen (H i) distribution, which are consequences of group pre-processing, and possibly of ram-pressure. Based on the current data we propose a scenario in which ESO156-G029 had a minor gas-rich merger in the past and now starts to experience ram-pressure. We infer that the galaxy will undergo rapid evolution once it gets closer to the cluster centre (less than 0.5 Mpc) where ram-pressure is strong enough to begin stripping the H i from the galaxy.
keywords:
galaxies: general – galaxies: evolution – galaxies: groups – galaxies: ISM – galaxies: clusters: general – galaxies: individual: ESO156-G0291 Introduction
Galaxy clusters, the largest gravitationally bound structures, grow via mergers of smaller systems such as galaxies and galaxy groups (Press & Schechter, 1974; White & Rees, 1978). Properties of galaxies in clusters are observed to change with respect to the environmental density (e.g. the morphology–density relation (Dressler, 1980) and the star formation–density relation Gómez et al. 2003). Within galaxy clusters the typical velocities and intracluster medium (ICM) densities are sufficiently high that ram-pressure can strip the interstellar medium (ISM) from member galaxies, even leading to a complete removal of their cold gas as they move through the ICM (Gunn & Gott, 1972; Chung et al., 2009; Brown et al., 2017; Yoon et al., 2017).
Before galaxies fall into clusters they can go through transformations (e.g. change in the gas content and morphology), so-called ‘pre-processing’, especially if those galaxies are part of groups (McGee et al., 2009; Kilborn et al., 2009; Hess & Wilcots, 2013; Vijayaraghavan & Ricker, 2013; Hou et al., 2014; Yoon et al., 2017). Due to the small velocity dispersion in groups, galaxy mergers are frequently observed (Hickson, 1997; Sengupta et al., 2017). It has been shown that a galaxy’s neutral hydrogen gas fraction can increase after a merger (Ellison et al., 2018), which can make the galaxy inefficient in forming stars due to an enhanced turbulence. A variety of physical processes can be efficient in galaxy groups that can shape the galaxy evolution (e.g. Vulcani et al. 2018). Thus, unraveling the impact of the group and the cluster on cluster infalling galaxies is an ongoing challenge (Cortese et al., 2006; Hess & Wilcots, 2013; Hou et al., 2014; Hess et al., 2015).
In this work we investigate the physical processes that are shaping a spiral galaxy ESO156-G029. The location of ESO156-G029, falling into the cluster and part of a group, is excellent for gathering insights on galaxy pre-processing.
This letter is structured as follows. Section 2 describes the data. Section 3 presents the galaxy group HIPASSJ0400-52, the cluster Abell 3193 and ESO156-G029 and the main results. We conclude in Section 4. Throughout this paper the assumed cosmology is H0 = 70 km s-1 Mpc-1, = 0.3, and = 0.7, and we adopted (Chabrier, 2003) initial mass function.
2 Data
ESO156-G029 was observed with the Australia Telescope Compact Array (ATCA) as part of the project C2440. The observation and data reduction of the ATCA data used are described in Džudžar et al. (2019). In summary, we used the standard reduction procedure in MIRIAD (Sault et al., 1995), create the H i data cube with a channel width of 5 km s-1, and a Brigg’s robust weighting of 0.5 as used in Džudžar et al. (2019). We make use of the ATCA H i intensity distribution of ESO156-G029, its H i spectrum and its kinematic map.
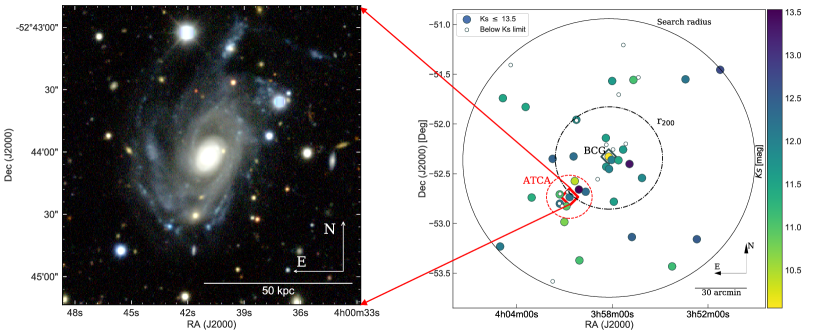
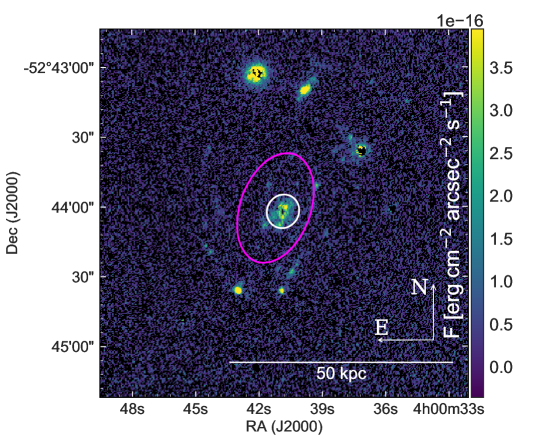
The Two Micron All Sky Survey (2MASS) Ks-band (Skrutskie et al., 2006) background subtracted image is used to measure the Ks-band luminosity which was converted into the stellar mass using Wen et al. (2013) relation. We use deep optical imaging (g, r, i) from the first data release of the Dark Energy Survey (DES, Morganson et al., 2018; Abbott et al., 2018) obtained using Dark Energy Camera (DECam, Flaugher et al. 2015) on the CTIO Blanco 4-m telescope to trace faint features in ESO156-G029 (see Figure 1).
3 Results
In this Section we present the properties of ESO156-G029 and its local and global environment in order to understand the physical processes that are acting on this galaxy.
3.1 The Choir group HIPASSJ0400-52
The Choir group HIPASSJ0400-52 (hereafter J0400-52) was identified in Sweet et al. (2013), which showed general group properties obtained from the SINGG survey (Survey of Ionization in Neutral Gas Galaxies, Meurer et al., 2006). The adopted distance for J0400-52 group is 151 Mpc (z 0.035), and its coordinates RA: 04h00m40.82s; DEC: -52d44m02.72s (Meurer et al., 2006; Sweet et al., 2013). Using narrow-band emission imaging, nine emission-line galaxies were discovered in J0400-52: four spiral galaxies and five dwarf galaxies (Sweet et al., 2013). Spectroscopic follow-up observations yielded redshifts of these nine galaxies (Sweet et al., 2014), seven of them are confirmed J0400-52 members. Two galaxies have a higher recessional velocity ( 1000 km s-1) with respect to the mean group velocity. Thus, we exclude them as being group members, however, they remain as cluster members. Based on the recessional velocity and position, it appears that the J0400-52 group is infalling into the cluster Abell 3193 (hereafter A3193). Out of the seven known J0400-52 members, only ESO156-G029 was detected in H i emission with the ATCA observations.
3.2 Abell 3193
The quoted properties of the cluster A3193 differ from study to study, thus we re-derive them. We search for galaxies within the radius of 1.4 deg111https://www.cfa.harvard.edu/~dfabricant/huchra/clusters/table.html around the cluster centre, using NASA/IPAC Extragalactic Database (NED) and obtain a sample of 47 galaxies in the velocity range of 9720 and 11690 km s-1. These limits were adopted based on the velocity dispersion of the galaxies around the cluster. We define a Ks magnitude limited sample (33 galaxies brighter than the Ks magnitude limit of 13.5 mag for extended sources; see Figure 1) to derive cluster properties. The mean cluster velocity is 10580165 km s-1 with a radial velocity dispersion of 54042 km s-1. We also find that the velocity of the brightest cluster galaxy (BCG), NGC1500 (Ks 10.07 mag), does not correspond to the mean cluster velocity, but instead is offset by 500 km s-1. The kinematic offset of the BCG with respect to the cluster can indicate that the cluster is dynamically young and still in the process of relaxation (Lauer et al., 2014; Wolfinger et al., 2016).
From the radial velocity dispersion we derive the cluster radius and mass: r 1.3 Mpc and M 2.71014 M⊙ (based on equations for r200 and M200 from Poggianti et al. 2010).
From the ROSAT All-Sky Survey Faint Source Catalog (Voges et al., 2000) A3193 has a weak X-ray emission (X-ray luminosity of 1042 erg s-1). In order to determine the extent of the cluster X-ray emission, we re-derive the X-ray counts from the ROSAT All-Sky Survey images. Using Mission Count Rate Simulator (WebPIMMS222heasarc.gsfc.nasa.gov/cgi-bin/Tools/w3pimms/w3pimms.pl) we obtain the X-Ray luminosity of 1.61042 erg s-1, which is in agreement with Voges et al. (2000). The X-ray luminosity is localized within 3.5 arcmin around the cluster centre, coinciding with the position of NGC1500.
3.3 ESO156-G029
The integrated properties of ESO156-G029 were shown in Džudžar et al. (2019) - galaxy with ID: HIPASSJ0400-52:S1. We found that ESO156-G029 is an H i-rich galaxy with a large gas-mass fraction and a low specific star formation efficiency. We analytically determined that ESO156-G029 has a high specific angular momentum, which may hinder the ISM from forming stars, and thus causing low star formation efficiency in the galaxy; in a similar manner to H i extreme galaxies (Lutz et al., 2017, 2018). We use the derived star formation rate of ESO156-G029 from H and the Wide Field Imaging Survey Explorer (WISE; using 12m, Jarrett et al. (2013)) and find that ESO156-G029 lies on the star forming main sequence when comparing to the sSFR main sequence of Catinella et al. (2018).
ESO156-G029, whilst being a part of the group J0400-52, it is also a cluster infall galaxy, thus it is an excellent case study into the interplay between group and cluster environment. We discuss the physical processes that are responsible for the peculiar features of ESO156-G029: the highly asymmetric H i profile, disturbed H i kinematics and star-forming stellar streams (seen in optical and H; Figure 1 and 2d).
| Right Ascension (optical)a,b | 04h00m40.82s |
| Declination (optical)a,b | -52d44m02.71s |
| V (km s-1) | 10570 |
| V (km s-1)a | 10424 |
| D (Mpc)a,b | 151 |
| z a | 0.0348 |
| D (Mpc) | 1.4 |
| SFR (M⊙ yr-1)b | 0.50.1* |
| SFR (M⊙ yr-1) | 2.340.82 |
| V (km s-1) | 142.27.4 |
| (km s-1) | 228 |
| i (deg) | 60.31.4 |
| PA (deg) | 3413 |
| f | 0.490.04 |
| log j (M⊙ km s-1 kpc) | 3.510.08 |
| q | 0.160.05 |
| log M (M⊙) | 10.60.1 |
| log M⋆() (M⊙) | 10.70.1 |
(a)
(b)
(c)
(d)
3.3.1 The H i distribution and kinematics of ESO156-G029
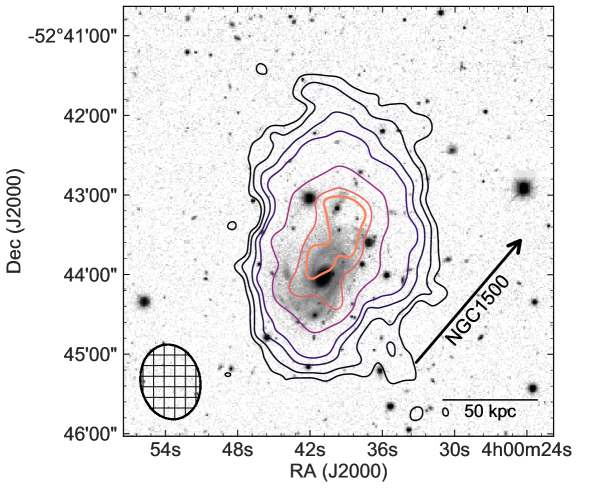
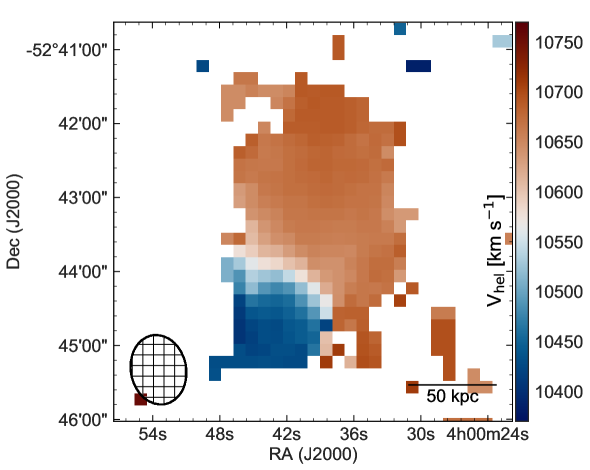
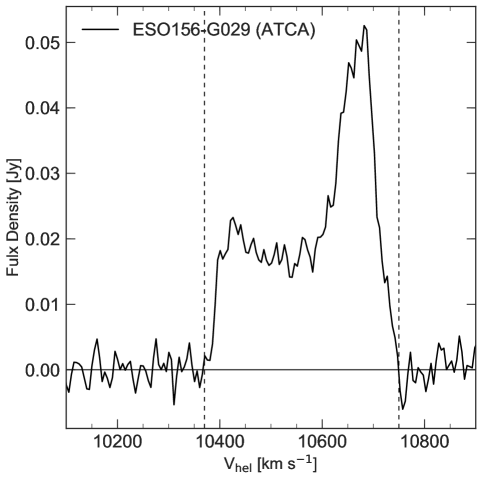
We show the H i distribution of ESO156-G029 overlaid on the DECam g band image (see Figure 2a). The H i distribution has an offset of 20 arcsec from the stellar centre of the galaxy. The H i contours in the south-east part of the galaxy are compressed with respect to those on the north-west. In panel b of Figure 2, the velocity map of ESO156-G029 shows that the gas in the galaxy is being skewed towards higher velocities, which is possibly caused by the ram-pressure of the cluster. We also find that the rotation curves in the approaching and receding sides of the galaxy are very different, with a difference in maximum velocities of the order of 40 km s-1. The H i asymmetry is also evident in the emission line spectrum in panel c of Figure 2. The peak of the integrated H i spectrum for the receding side of the galaxy is 44 per cent higher than the peak for the approaching side. Following Espada et al. (2011) we derive the integrated density flux ratio parameter (, as a measure of asymmetry; the higher the value than 1.0, the higher the asymmetry) to be 1.7, which places this galaxy into the class of those with strongly asymmetric H i profiles (only four out of 318 galaxies from the Espada et al. (2011) sample have similarly high asymmetry values). Such an asymmetry could be a result of a past merger (e.g. Holwerda et al., 2011; Scott et al., 2018; Bok et al., 2019).
3.3.2 Modeling of ESO156-G029
We use the code 3DBarolo (3D-Based Analysis of Rotating Object via Line Observations, Di Teodoro & Fraternali 2015) to fit the H i emission-line data-cube of ESO156-G029. Kinematic and geometrical parameters (velocity dispersion (), inclination (i), position angle (PA)) obtained from the modelling are given in Table 1. We obtain the maximum rotational velocity of the galaxy (velocity where the rotation curve is flat, V).
Using data from the H i modeling and the Ks-band (background subtracted) galaxy image, we derive the total baryonic specific angular momentum (j) and stability parameter (q) of the galaxy utilizing the robust method described in Murugeshan et al. (2019). We determine that the global stability parameter (q) is in overall agreement with the one determined analytically by Džudžar et al. (2019). Obreschkow et al. (2016) observe a tight positive correlation between the atomic gas-mass fraction and the global stability parameter q (with its ability to regulate star formation efficiency) which consequently determines the atomic gas fraction. Based on the q value, we can conclude that ESO156-G029 has a high angular momentum and thus low star formation efficiency. The properties of ESO156-G029 are similar to the galaxies studied by Geréb et al. (2018) and H i eXtreme galaxies (HIX, Lutz et al. 2017, 2018), although ESO156-G029 shows signs of a disturbance. In the following sections we explore whether ram-pressure and galaxy interaction may have had an effect on ESO156-G029.
3.4 Ram-pressure stripping
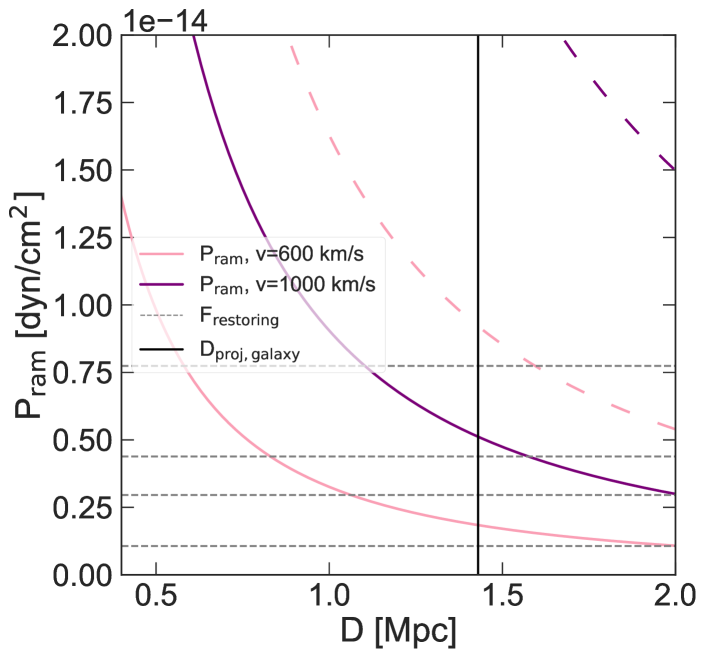
As galaxies move through the intra cluster medium (ICM) they can be affected by ram-pressure () of the ICM: ; where is the ICM density and is the galaxy velocity with respect to the ICM (Gunn & Gott, 1972). The extreme effect of ram-pressure can cause stripping of the gas content off galaxies if the ram-pressure exceeds the restoring force of the galaxy, i.e. P >2G. We use rough approximations to estimate whether ram-pressure is effective (e.g. Bravo-Alfaro et al. 2009), utilizing only the surface mass densities of the H i () and stars (). We use the hydrostatic-isothermal -model of Cavaliere & Fusco-Femiano (1976) to find the ICM density distribution: ; using =0.5, cluster core radius r 38 kpc (at 50 per cent of the peak X-ray surface brightness) and central density 10-4 < <510-4 cm-3. The ram-pressure parameter P is derived for two extreme ranges of the central ICM density, as well as two values of the galaxy velocity. We compare the strength of the ram-pressure stripping with the restoring force of the galaxy (see Figure 3), at the galaxy’s projected distance from the cluster centre 1.4 Mpc. The four horizontal dashed lines in Figure 3 represent the restoring force of the galaxy H i ‘edge’ (computed for the four H i surface densities: 0.2, 0.4, 0.45 and 0.65 M⊙ pc-2). For a reasonable approximation of the central ICM density and galaxy velocity with respect to the cluster centre (cluster velocity dispersion) we obtain that the restoring force of the galaxy H i ‘edge’ is similar to ram-pressure force. This leads us to the conclusion that if the galaxy is under the influence of ram-pressure it has to be an early phase ram-pressure since the galaxy is not gas-poor. Assuming that the galaxy is going towards cluster centre, based on the current projected position of ESO156-G029 and direction of the H i asymmetry, the galaxy would have to be infalling onto the cluster from behind.
We find that ram-pressure will be much more stronger if galaxy approaches closer than 0.5 Mpc to the cluster centre, where we expect significant H i stripping. An example of advanced stage of ram-pressure is galaxy JO206, which exhibits low H i-gas fraction and enhanced star formation due to ram-pressure stripping (Ramatsoku et al., 2019). The advanced ram-pressure phase of ESO156-G029 would resemble the case from (Ramatsoku et al., 2019) or even to the more extreme case, such as described in Fumagalli et al. (2014), forming extended gaseous tail.
3.5 Galaxy–galaxy interaction
Galaxy interactions can lead to asymmetries in their H i distribution and kinematics (e.g. Holwerda et al. 2011). It is also shown that galaxies which had a merger can exhibit an H i-gas fraction enhancement (Ellison et al., 2018).
We find indications that ESO156-G029 is in an advanced (or post) merger stage. Firstly, the galaxy has a higher H i-gas fraction when compared to galaxies of similar stellar mass (Džudžar et al., 2019). Secondly, the majority of the star forming regions lie in the outer disc of the galaxy (see panel d of Figure 2). The sum of H flux in the outer disc regions is around two times greater than that from the inner regions (excluding the bulge). We also find the faint stellar streams in the north-west part of the galaxy (see Figure 1) which may be remnants of the shredded dwarf that has merged into the system. Since ram-pressure is very low, it is more likely that such optical morphology is a result of a past merger event. Moreover, the increased H i velocity dispersion (see in Table 1) is indicative of a turbulent medium, possibly due to a merger (Elmegreen et al., 1995; Tamburro et al., 2009). Also, galaxies exhibiting large differences in their (approaching versus receding) rotation curves are likely to have had a tidal encounter (van Eymeren et al., 2011). To quantify the degree of tidal influence van Eymeren et al. (2011) use the kinematic lopsidedness parameter (Eq. 1 in their paper). We apply this method to ESO156-G029 and find a high value of 0.13 for the kinematic lopsidedness parameter (normal values are expected around and below the mean of 0.056 (van Eymeren et al., 2011)), hinting to the fact that this galaxy may have had an encounter in its recent past.
We hence conclude that properties such as the optical morphology, H i content, velocity dispersion and kinematic lopsidedness are consistent with galaxy-galaxy interaction rather than ram-pressure stripping.
4 Discussion and conclusions
We have presented observations of the spiral galaxy ESO156-G029 which reveal an asymmetric neutral hydrogen (H i) gas distribution and disturbed gas kinematics that we have discovered in the J0400-52 galaxy group (HIPASSJ0400-52:S1, Sweet et al. 2013; Džudžar et al. 2019).
We argue that galaxy pre-processing, through an ongoing minor merger within the J0400-52 group is more likely to have caused the rare distinct features of this system and that (if present) the effect of ram-pressure is very low. We show that the galaxy, assuming it is moving towards cluster centre, will suffer significant effects of ram-pressure stripping when it gets closer than 0.5 Mpc from the cluster centre. Assuming that the galaxy is moving with a velocity of 600 km s-1 towards cluster centre, it will take >0.6 Myr before ram-pressure becomes capable of stripping the ISM of ESO156-G029.
The majority of galaxies that reside within group and cluster environments are built-up from infalling galaxy groups and individual galaxies. Thus identifying more galaxies like ESO156-G029 which appear to be distorted as they enter the cluster environment will be crucial for allowing us to dissect which processes are responsible for their transformation.
5 Acknowledgements
We thank the anonymous referee for their comments and suggestions which improved this paper.
Robert Džudžar is supported by the Swinburne University Postgraduate Award (SUPRA).
Robert would like to thank Manodeep Sinha, Michelle Cluver, Tom Jarrett (for providing WISE photometry) Uroš Mestrić, Katharina Lutz, Vaishali Parkash, Jacob Seiler, Enrico di Teodoro and MicAstros for useful comments and discussions.
Parts of this research were supported by the Australian Research Council Centre of Excellence for All Sky Astrophysics in 3 Dimensions (ASTRO 3D), through project number CE170100013.
The Australia Telescope Compact Array is part of the Australia Telescope National Facility which is funded by the Australian Government for operation as a National Facility managed by CSIRO.
This research has made use of the NASA/IPAC Ex- tragalactic Database (NED), which is operated by the Jet Propulsion Laboratory, California Institute of Technology, under contract with the National Aeronautics and Space Administration.
This publication makes use of data products from the Two Micron All Sky Survey, which is a joint project of the University of Massachusetts and the Infrared Processing and Analysis Center/California Institute of Technology, funded by the National Aeronautics and Space Administration and the National Science Foundation.
This project used public archival data from the Dark Energy Survey (DES). Funding for the DES Projects has been provided by the U.S. Department of Energy, the U.S. National Science Foundation, the Ministry of Science and Education of Spain, the Science and Technology FacilitiesCouncil of the United Kingdom, the Higher Education Funding Council for England, the National Center for Supercomputing Applications at the University of Illinois at Urbana-Champaign, the Kavli Institute of Cosmological Physics at the University of Chicago, the Center for Cosmology and Astro-Particle Physics at the Ohio State University, the Mitchell Institute for Fundamental Physics and Astronomy at Texas A&M University, Financiadora de Estudos e Projetos, Fundação Carlos Chagas Filho de Amparo à Pesquisa do Estado do Rio de Janeiro, Conselho Nacional de Desenvolvimento Científico e Tecnológico and the Ministério da Ciência, Tecnologia e Inovação, the Deutsche Forschungsgemeinschaft, and the Collaborating Institutions in the Dark Energy Survey.
The Collaborating Institutions are Argonne National Laboratory, the University of California at Santa Cruz, the University of Cambridge, Centro de Investigaciones Energéticas, Medioambientales y Tecnológicas-Madrid, the University of Chicago, University College London, the DES-Brazil Consortium, the University of Edinburgh, the Eidgenössische Technische Hochschule (ETH) Zürich, Fermi National Accelerator Laboratory, the University of Illinois at Urbana-Champaign, the Institut de Ciències de l’Espai (IEEC/CSIC), the Institut de Física d’Altes Energies, Lawrence Berkeley National Laboratory, the Ludwig-Maximilians Universität München and the associated Excellence Cluster Universe, the University of Michigan, the National Optical Astronomy Observatory, the University of Nottingham, The Ohio State University, the OzDES Membership Consortium, the University of Pennsylvania, the University of Portsmouth, SLAC National Accelerator Laboratory, Stanford University, the University of Sussex, and Texas A&M University.
Based in part on observations at Cerro Tololo Inter-American Observatory, National Optical Astronomy Observatory, which is operated by the Association of Universities for Research in Astronomy (AURA) under a cooperative agreement with the National Science Foundation.
This research has made use of python https://www.python.org and python packages: astropy (Astropy
Collaboration et al., 2013, 2018), matplotlib http://matplotlib.org/ (Hunter, 2007), APLpy https://aplpy.github.io/ and NumPy http://www.numpy.org/ (van der Walt et al., 2011). Figure 2b uses scientific colour map ‘vik’ (Crameri, 2018).
References
- Abbott et al. (2018) Abbott T. M. C., et al., 2018, ApJS, 239, 18
- Astropy Collaboration et al. (2013) Astropy Collaboration et al., 2013, A&A, 558, A33
- Astropy Collaboration et al. (2018) Astropy Collaboration et al., 2018, AJ, 156, 123
- Bok et al. (2019) Bok J., Blyth S. L., Gilbank D. G., Elson E. C., 2019, MNRAS, 484, 582
- Bravo-Alfaro et al. (2009) Bravo-Alfaro H., Caretta C. A., Lobo C., Durret F., Scott T., 2009, A&A, 495, 379
- Brown et al. (2017) Brown T., et al., 2017, MNRAS, 466, 1275
- Catinella et al. (2018) Catinella B., et al., 2018, MNRAS, 476, 875
- Cavaliere & Fusco-Femiano (1976) Cavaliere A., Fusco-Femiano R., 1976, A&A, 49, 137
- Chabrier (2003) Chabrier G., 2003, PASP, 115, 763
- Chung et al. (2009) Chung A., van Gorkom J. H., Kenney J. D. P., Crowl H., Vollmer B., 2009, AJ, 138, 1741
- Cortese et al. (2006) Cortese L., Gavazzi G., Boselli A., Franzetti P., Kennicutt R. C., O’Neil K., Sakai S., 2006, A&A, 453, 847
- Crameri (2018) Crameri F., 2018, Scientific colour maps, doi:10.5281/zenodo.2649252, https://doi.org/10.5281/zenodo.2649252
- Di Teodoro & Fraternali (2015) Di Teodoro E. M., Fraternali F., 2015, MNRAS, 451, 3021
- Dressler (1980) Dressler A., 1980, ApJ, 236, 351
- Džudžar et al. (2019) Džudžar R., et al., 2019, MNRAS, 483, 5409
- Ellison et al. (2018) Ellison S. L., Catinella B., Cortese L., 2018, MNRAS, 478, 3447
- Elmegreen et al. (1995) Elmegreen D. M., Kaufman M., Brinks E., Elmegreen B. G., Sundin M., 1995, ApJ, 453, 100
- Espada et al. (2011) Espada D., Verdes-Montenegro L., Huchtmeier W. K., Sulentic J., Verley S., Leon S., Sabater J., 2011, A&A, 532, A117
- Flaugher et al. (2015) Flaugher B., et al., 2015, AJ, 150, 150
- Fumagalli et al. (2014) Fumagalli M., Fossati M., Hau G. K. T., Gavazzi G., Bower R., Sun M., Boselli A., 2014, MNRAS, 445, 4335
- Geréb et al. (2018) Geréb K., Janowiecki S., Catinella B., Cortese L., Kilborn V., 2018, MNRAS, 476, 896
- Gómez et al. (2003) Gómez P. L., et al., 2003, ApJ, 584, 210
- Gunn & Gott (1972) Gunn J. E., Gott III J. R., 1972, ApJ, 176, 1
- Hess & Wilcots (2013) Hess K. M., Wilcots E. M., 2013, AJ, 146, 124
- Hess et al. (2015) Hess K. M., Jarrett T. H., Carignan C., Passmoor S. S., Goedhart S., 2015, MNRAS, 452, 1617
- Hickson (1997) Hickson P., 1997, ARA&A, 35, 357
- Holwerda et al. (2011) Holwerda B. W., Pirzkal N., de Blok W. J. G., Bouchard A., Blyth S. L., van der Heyden K. J., Elson E. C., 2011, MNRAS, 416, 2415
- Hou et al. (2014) Hou A., Parker L. C., Harris W. E., 2014, MNRAS, 442, 406
- Hunter (2007) Hunter J. D., 2007, Computing In Science & Engineering, 9, 90
- Jarrett et al. (2013) Jarrett T. H., et al., 2013, AJ, 145, 6
- Kilborn et al. (2009) Kilborn V. A., Forbes D. A., Barnes D. G., Koribalski B. S., Brough S., Kern K., 2009, MNRAS, 400, 1962
- Lauer et al. (2014) Lauer T. R., Postman M., Strauss M. A., Graves G. J., Chisari N. E., 2014, ApJ, 797, 82
- Lutz et al. (2017) Lutz K. A., et al., 2017, MNRAS, 467, 1083
- Lutz et al. (2018) Lutz K. A., et al., 2018, MNRAS, 476, 3744
- McGee et al. (2009) McGee S. L., Balogh M. L., Bower R. G., Font A. S., McCarthy I. G., 2009, MNRAS, 400, 937
- Meurer et al. (2006) Meurer G. R., et al., 2006, ApJS, 165, 307
- Morganson et al. (2018) Morganson E., et al., 2018, PASP, 130, 074501
- Murugeshan et al. (2019) Murugeshan C., Kilborn V., Obreschkow D., Glazebrook K., Lutz K., Džudžar R., Dénes H., 2019, MNRAS, 483, 2398
- Obreschkow et al. (2016) Obreschkow D., Glazebrook K., Kilborn V., Lutz K., 2016, ApJ, 824, L26
- Poggianti et al. (2010) Poggianti B. M., De Lucia G., Varela J., Aragon-Salamanca A., Finn R., Desai V., von der Linden A., White S. D. M., 2010, MNRAS, 405, 995
- Press & Schechter (1974) Press W. H., Schechter P., 1974, ApJ, 187, 425
- Ramatsoku et al. (2019) Ramatsoku M., et al., 2019, MNRAS, 487, 4580
- Sault et al. (1995) Sault R. J., Teuben P. J., Wright M. C. H., 1995, in Shaw R. A., Payne H. E., Hayes J. J. E., eds, Astronomical Society of the Pacific Conference Series Vol. 77, Astronomical Data Analysis Software and Systems IV. p. 433 (arXiv:astro-ph/0612759)
- Scott et al. (2018) Scott T. C., Brinks E., Cortese L., Boselli A., Bravo-Alfaro H., 2018, MNRAS, 475, 4648
- Sengupta et al. (2017) Sengupta C., Scott T. C., Paudel S., Dwarakanath K. S., Saikia D. J., Sohn B. W., 2017, MNRAS, 469, 3629
- Skrutskie et al. (2006) Skrutskie M. F., et al., 2006, AJ, 131, 1163
- Sweet et al. (2013) Sweet S. M., et al., 2013, MNRAS, 433, 543
- Sweet et al. (2014) Sweet S. M., Drinkwater M. J., Meurer G., Bekki K., Dopita M. A., Kilborn V., Nicholls D. C., 2014, ApJ, 782, 35
- Tamburro et al. (2009) Tamburro D., Rix H. W., Leroy A. K., Mac Low M. M., Walter F., Kennicutt R. C., Brinks E., de Blok W. J. G., 2009, AJ, 137, 4424
- Vijayaraghavan & Ricker (2013) Vijayaraghavan R., Ricker P. M., 2013, MNRAS, 435, 2713
- Voges et al. (2000) Voges W., et al., 2000, International Astronomical Union Circular, 7432, 1
- Vulcani et al. (2018) Vulcani B., et al., 2018, MNRAS, 480, 3152
- Wen et al. (2013) Wen X.-Q., Wu H., Zhu Y.-N., Lam M. I., Wu C.-J., Wicker J., Zhao Y.-H., 2013, MNRAS, 433, 2946
- White & Rees (1978) White S. D. M., Rees M. J., 1978, MNRAS, 183, 341
- Wolfinger et al. (2016) Wolfinger K., Kilborn V. A., Ryan-Weber E. V., Koribalski B. S., 2016, Publ. Astron. Soc. Australia, 33, e038
- Yoon et al. (2017) Yoon H., Chung A., Smith R., Jaffé Y. L., 2017, ApJ, 838, 81
- van Eymeren et al. (2011) van Eymeren J., Jütte E., Jog C. J., Stein Y., Dettmar R. J., 2011, A&A, 530, A29
- van der Walt et al. (2011) van der Walt S., Colbert S. C., Varoquaux G., 2011, Computing in Science and Engineering, 13, 22