Synthesis and Electronic Structure of a Crystalline Stack of MXene Sheets
Abstract
Despite the interest in MXenes in the last decade, all of the MXenes reported have a random mixture of surface terminations (-O, -OH, -F). In addition, restacked 3D films have turbostratic disorder and often contain ions, solvent, and other species in between their layers. Here we report Y2CF2, a layered crystal with a unit cell isostructural to a MXene, in which layers are capped only by fluoride anions. We directly synthesize the 3D crystal through a high-temperature solid-state reaction, which affords the 3D crystal in high yield and purity and ensures that only fluoride ions terminate the layers. We characterize the crystal structure and electronic properties using a combination of experimental and computational techniques. We find that relatively strong electrostatic interactions bind the layers together into a 3D crystal and that the lack of orbital overlap between layers gives rise to a description of Y2CF2 as slabs of MXene-like sheets electrically insulated from one another. Therefore, we consider Y2CF2 as a pure 3D crystalline stack of MXene-like sheets. In addition, Y2CF2 is the first transition metal carbide fluoride experimentally synthesized. We hope this work inspires further exploration of transition metal carbide fluorides, which are potentially a large and useful class of compositions.
keywords:
American Chemical Society, LaTeXFirst Affiliation]Department of Chemistry, University of North Carolina at Chapel Hill, Chapel Hill, North Carolina 27599, United States Third Affiliation]Chapel Hill Analytical and Nanofabrication Laboratory (CHANL), University of North Carolina at Chapel Hill, Chapel Hill, North Carolina, 27599, United States First Affiliation]Department of Chemistry, University of North Carolina at Chapel Hill, Chapel Hill, North Carolina 27599, United States \alsoaffiliation[Second Affiliation]Department of Applied Physical Sciences, University of North Carolina at Chapel Hill, Chapel Hill, North Carolina 27599, United States \abbreviationsIR,NMR,UV
1 Introduction
Research into layered and 2D metal carbides such as MXenes has rapidly grown 1 due to their remarkable properties and applications in electronic, 2, 3 sensing, 4, 5 and energy storage devices. 6, 7, 8 Despite the interest in MXenes in the last decade, all of the MXenes reported have a random mixture of surface terminations (-O, -OH, -F), which complicates their study and use. The presence of multiple surface terminations on MXene sheets owes to their synthesis, which involves etching a MAX (M = metal; A = Al, Ga, Si, In; and X = C, N) phase with aqueous HF. 9 Further complicating their study, restacked 3D films of MXenes have turbostratic disorder10, 11 and often contain ions, solvent, and other species in between their layers. 12, 13
Given the general interest in MXenes, it is remarkable that no pure (i.e. no -O, -OH), transition metal carbide fluoride has been reported. Of the transition metals, only Y, 14, 15, 16, 17, 18, 19, 20, 21, 22, 23 Sc, 14, 24, 25, 26, 27, 28 Zr, 14, 29, 30 and W 31 have been studied as pure metal carbide halides, and none as fluorides, leaving a large void in our knowledge of ternary phase diagrams. Our efforts in this work are to synthesize the first transition metal carbide fluoride, and to highlight a largely unexplored class of compositions that may find utility in optoelectronics.
Here we report Y2CF2, a layered crystal with a unit cell isostructural to a 2D MXene, in which layers are capped only by fluoride anions. Relatively strong electrostatic interactions bind the layers together into a 3D crystal. Therefore, we consider Y2CF2 as a pure 3D crystalline stack of MXene-like sheets. Instead of the etching approach, we describe an alternative synthetic method. We directly synthesize the 3D crystal through a high-temperature solid-state reaction in the absence of air and water. The synthesis affords the 3D crystal in high yield and purity and ensures that only fluoride ions terminate the layers. This allows us to identify several useful properties of Y2CF2: an indirect band gap at 1.6 eV, a direct band gap at 1.9 eV, a small ionization potential of 3.8 eV, and modest charge transport properties, with an electron effective mass of 2.0 and a hole effective mass of 4.0. Perhaps most usefully, the realization of 3D crystalline MXenes will enable a comparison to their 2D MXene counterparts to better understand the influence of disorder and surfaces on their optoelectronic properties.
2 Experimental section
2.1 The synthesis of Y2CF2
Y2CF2 was synthesized by the solid state reaction of YF3 (Sigma Aldrich, granules, 0.09% oxygen, 0.02% Cd, Co, Cr, Fe, Hg, Mn, Pb each) with Y metal (Alfa Aesar, 40 mesh powder, 99.6% (REO)) and graphite (Sigma Aldrich, 100 mesh flakes, 99.9%). The reagents were ground into a very fine powder in a stoichiometric ratio (total mass of a typical batch: 0.5–1.0 g) and pressed into a pellet under 0.56 GPa of pressure using a hydraulic press. The pellet was placed into an ampoule made of tantalum (Ta) metal welded closed at one side. A cap, also made of Ta, was hammered into the ampoule and sealed in argon by welding the cap and ampoule together with an electric arc. The Ta tubing, 99.95% Ta seamless tubing, was purchased from Eagle Alloys in a 1 cm diameter and cut to 5 cm lengths. The caps were made of the same Ta. After welding the reagents inside a Ta ampoule, the Ta ampoule was sealed in a fused quartz ampoule under 1 mbar Ar. Then the ampoule was placed in a Lindberg Blue M tube furnace to 1513 K at a ramp rate of 10 K/min. The temperature was held at 1513 K for 3 days, then cooled to 1273 K over 10 hrs, then cooled to 1073 K over 5 hrs, and cooled to room temperature over 5 hours. The ampoule was then brought into the glovebox and opened with a pipe cutter. The pellet remained intact through the reaction. Vibrant green crystals grew on the surface of the pellet. The pellet revealed homogenous green crystals throughout when broken apart. For some experiments, samples were ball-milled for 15 minutes to reduce particle size. All materials were stored in a glovebox with an argon atmosphere (oxygen 0.01 ppm) and all synthetic steps were carried out under an argon atmosphere.
2.2 Material characterization
Samples were maintained under an inert atmosphere during transport and loading procedures, unless otherwise stated. Powdered samples of Y2CF2 were characterized by X-ray diffraction at room temperature in a capillary transmission geometry across a range of 20-150 using Cu K ( = 1.54056 Å) in a Rigaku Smartlab diffractometer. A reference scan was run with silicon (a = 5.430 Å) as an internal standard. The peaks were not corrected as the height of the sample was already correct. The patterns were indexed using Treor 32 implemented in the Match! software. 33 The patterns were refined using the PDXL software from Rigaku. 34 Thin films were characterized by XPS using a Kratos Axis Ultra Delay-Line Detector (DLD) spectrometer with monochromatic Al K source. For these measurements, the powder was pressed into indium substrates. High resolution XPS data was collected at a pass energy of 20 eV, and a charge neutralizer was used for charge compensation. All data was corrected to the C 1s peak at 284.6 eV. The samples were imaged using a Hitachi S-4700 cold cathode field emission SEM at an accelerating voltage of 2 kV with an Oxford EDS detector. An accelerating voltage of 20 kV was used for EDS measurements. Samples were loaded onto the SEM sample holders in the glovebox and transported to the instrument under inert atmosphere, however, the samples were exposed to air for a few seconds during the transfer into the air lock of the instrument. UV-Vis spectroscopy was performed in a transmission geometry through thin (0.5mm-thick) discs made of mixtures of Y2CF2 and KBr. The Y2CF2 powder was diluted with spectroscopic grade KBr and ground very finely in a ball mill. The mixture was ground until homogenous, then pressed into discs using a hydraulic press. The background due to scattering from KBr was subtracted by pressing a number of films of KBr of varying thickness to estimate its effective attenuation as a function of thickness and subtracting a weighted fraction from the acquired spectra. All discs appeared red, not green. The spectra were collected using a Cary 5000 UV-Vis spectrometer with the DRA-2500 internal integrating sphere accessory. The reflection spectra of Y2CF2 particles from 400–850 nm were obtained using a Craic UV-vis-NIR Microspectrophotometer (MSP) with a polychromatic Xe source and an EC Epiplan Neofluar LD objective (NA: 0.55). The aperture size was 14.714.7 microns except where noted.
2.3 Computational experiments
Density functional theory (DFT) calculations were performed using the CASTEP 35 code with plane-wave basis set approximations. To describe core electrons, ultrasoft pseudopotentials 36 were used with a 600 eV cut-off energy. For this cut-off energy, calculations were convergent with dEtot/dlnEcut less than 0.01 meV/atom. Geometry optimizations of all structures were first performed. A GGA PBE-sol functional 37 was used for the exchange-correlation contribution to total energy and Tkatchenko and Scheffle’s correction 38 was used to account for long-range dispersion forces for all calculations except where noted. A Monkhorst-Pack grid 39 of 16168 -points were used and structures were optimized using a BFGS algorithm with a convergence tolerance of 5.0 10-7 eV/atom for energy, 0.01 eV/Å for max force, 0.02 GPa for max stress, and 5.0 10-4 Å for max displacement. The “the thin-slab approach” 40 was used to calculate the ionization potential of bulk Y2CF2. For the calculations of ionization potential, a denser -point mesh (323216) was used. To prevent self-interactions between periodic images, a 12 Å vacuum space was included in the z-direction. The band gap and density of states were calculated using the HSE06 functional 41 with norm-conserving pseudopotentials, 42 a 850 eV cut-off energy, and a -point mesh of 323216. The fixed-composition USPEX calculation was carried out via four serial geometry optimizations of each candidate structure. The geometry optimizations utilized the GGA PBE functional with increasing quality, where the fourth and final optimizations were converged to 510-5 eV/atom using an 440 eV cutoff energy. For accurate comparison of candidate stabilities, geometry optimization were followed by a single, higher-quality energy calculation converged to 510-6 eV/atom deemed sufficient to isolate reasonable Y2CF2 structure types. The search identified the minimum Y2CF2 structure from among roughly 400 candidates tested across 8 generations.
3 Results and discussion
3.1 Synthesis and crystal structure
We combined yttrium, carbon, and fluorine in a stoichiometry of Y2CF2 at 1240 C in sealed tantalum ampoules according to the following reaction:
| (1) |
The product is a pellet of beautiful green crystals (Figure 1a) that easily grinds into a powder (Figure 1b). Unfortunately, the synthesized crystals were too small and inter-grown to perform single crystal X-ray diffraction measurements. Therefore, we combined two independent approaches to determine the crystal structure.
First, we performed powder X-ray diffraction experiments of the product and obtained a diffraction pattern (Figure 1c), which indexed as a trigonal crystal structure with space group Pm1-D3d. Then, we refined the pattern by the Rietveld method 43 (Table 1). The analysis confirms that the trigonal space group Pm1 is a good fit, with lattice constants a=3.6651 (3) Å and c = 6.29697 (7) Å at room temperature (Figure 1c, Table 1).
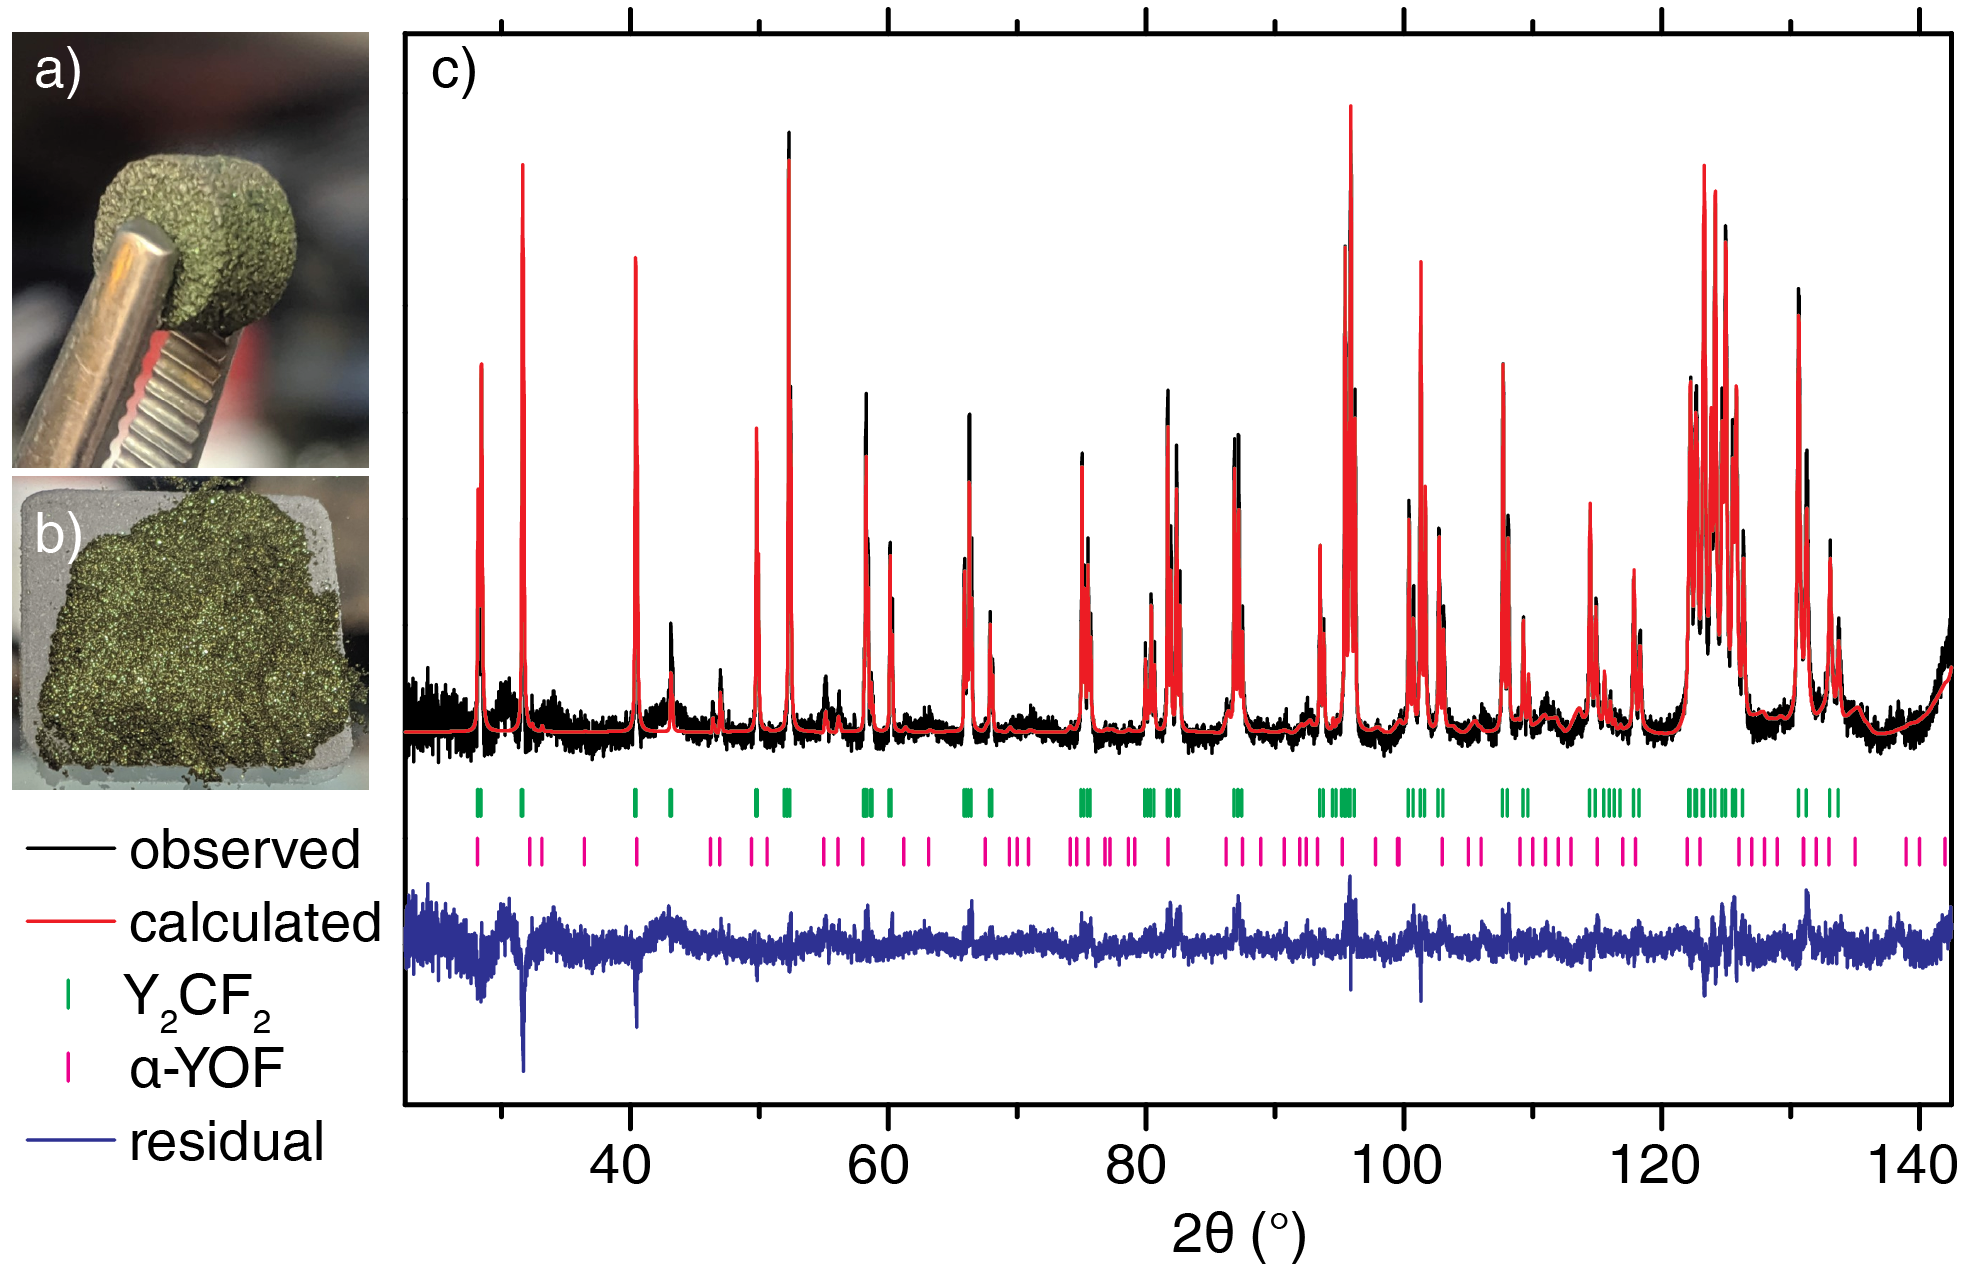
Independently, we used an evolutionary search algorithm, USPEX, 44 to explore the stability of crystal structures for the composition Y2CF2 computationally. The algorithm computes the enthalpy of hundreds of candidate crystal structures and uses similarities in bond distances, coordination, symmetry, and a number of other identifiers to find the most stable phase for a given composition. Using the algorithm, we found that the Pm1 structure is the most enthalpically favorable phase for the composition Y2CF2, in agreement with our diffraction experiments. This structure is more stable than the second-most stable structure by 46 meV/atom. We then performed a geometry optimization calculation using the PBEsol 37 functional to calculate the lattice constants. We calculated constants very close to the experimental value (1.6% shorter in a and 0.8% shorter in c, Figure 2b).
| Atom | Site symmetry | X | Y | Z | B (Å2) | N | Occupancy |
|---|---|---|---|---|---|---|---|
| Y | 2d 3m | 0.21450 (10) | 0.526 (12) | 2 | 1.00 (1) | ||
| C | 1a m | 0 | 0 | 0 | 0.1 (4) | 1 | 0.93 (3) |
| F | 2d 3m | 0.0.6031 (5) | 0.555 (11) | 2 | 1.00 (6) |
We also note that many yttrium compounds are isostructural to gadolinium and holmium compounds (e.g. YOCl 45, YCl3 46, YF3 47) because of the similarity in the crystallographic ionic radius of Y (104 pm) 48 to that of Gd and Y (108 and 104 pm respectively). 48 In support of our indexing, we found known gadolinium and holmium compounds (Gd2CF2 49 and Ho2CF2 50) isostructural to Y2CF2 with very similar lattice constants.
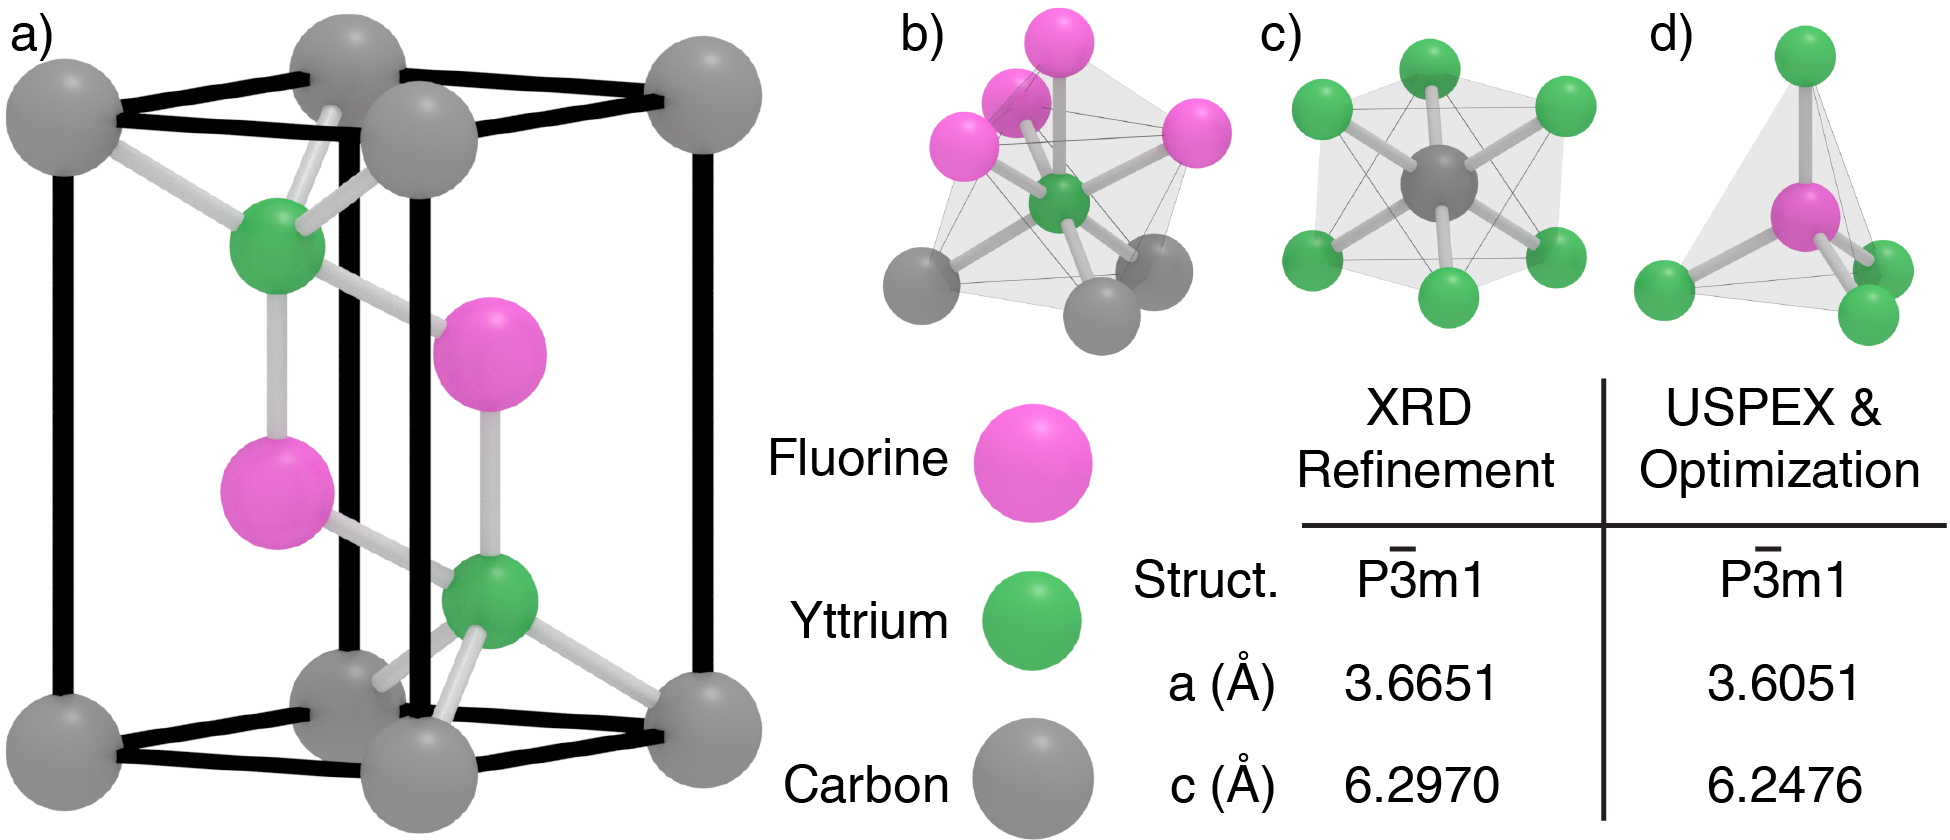
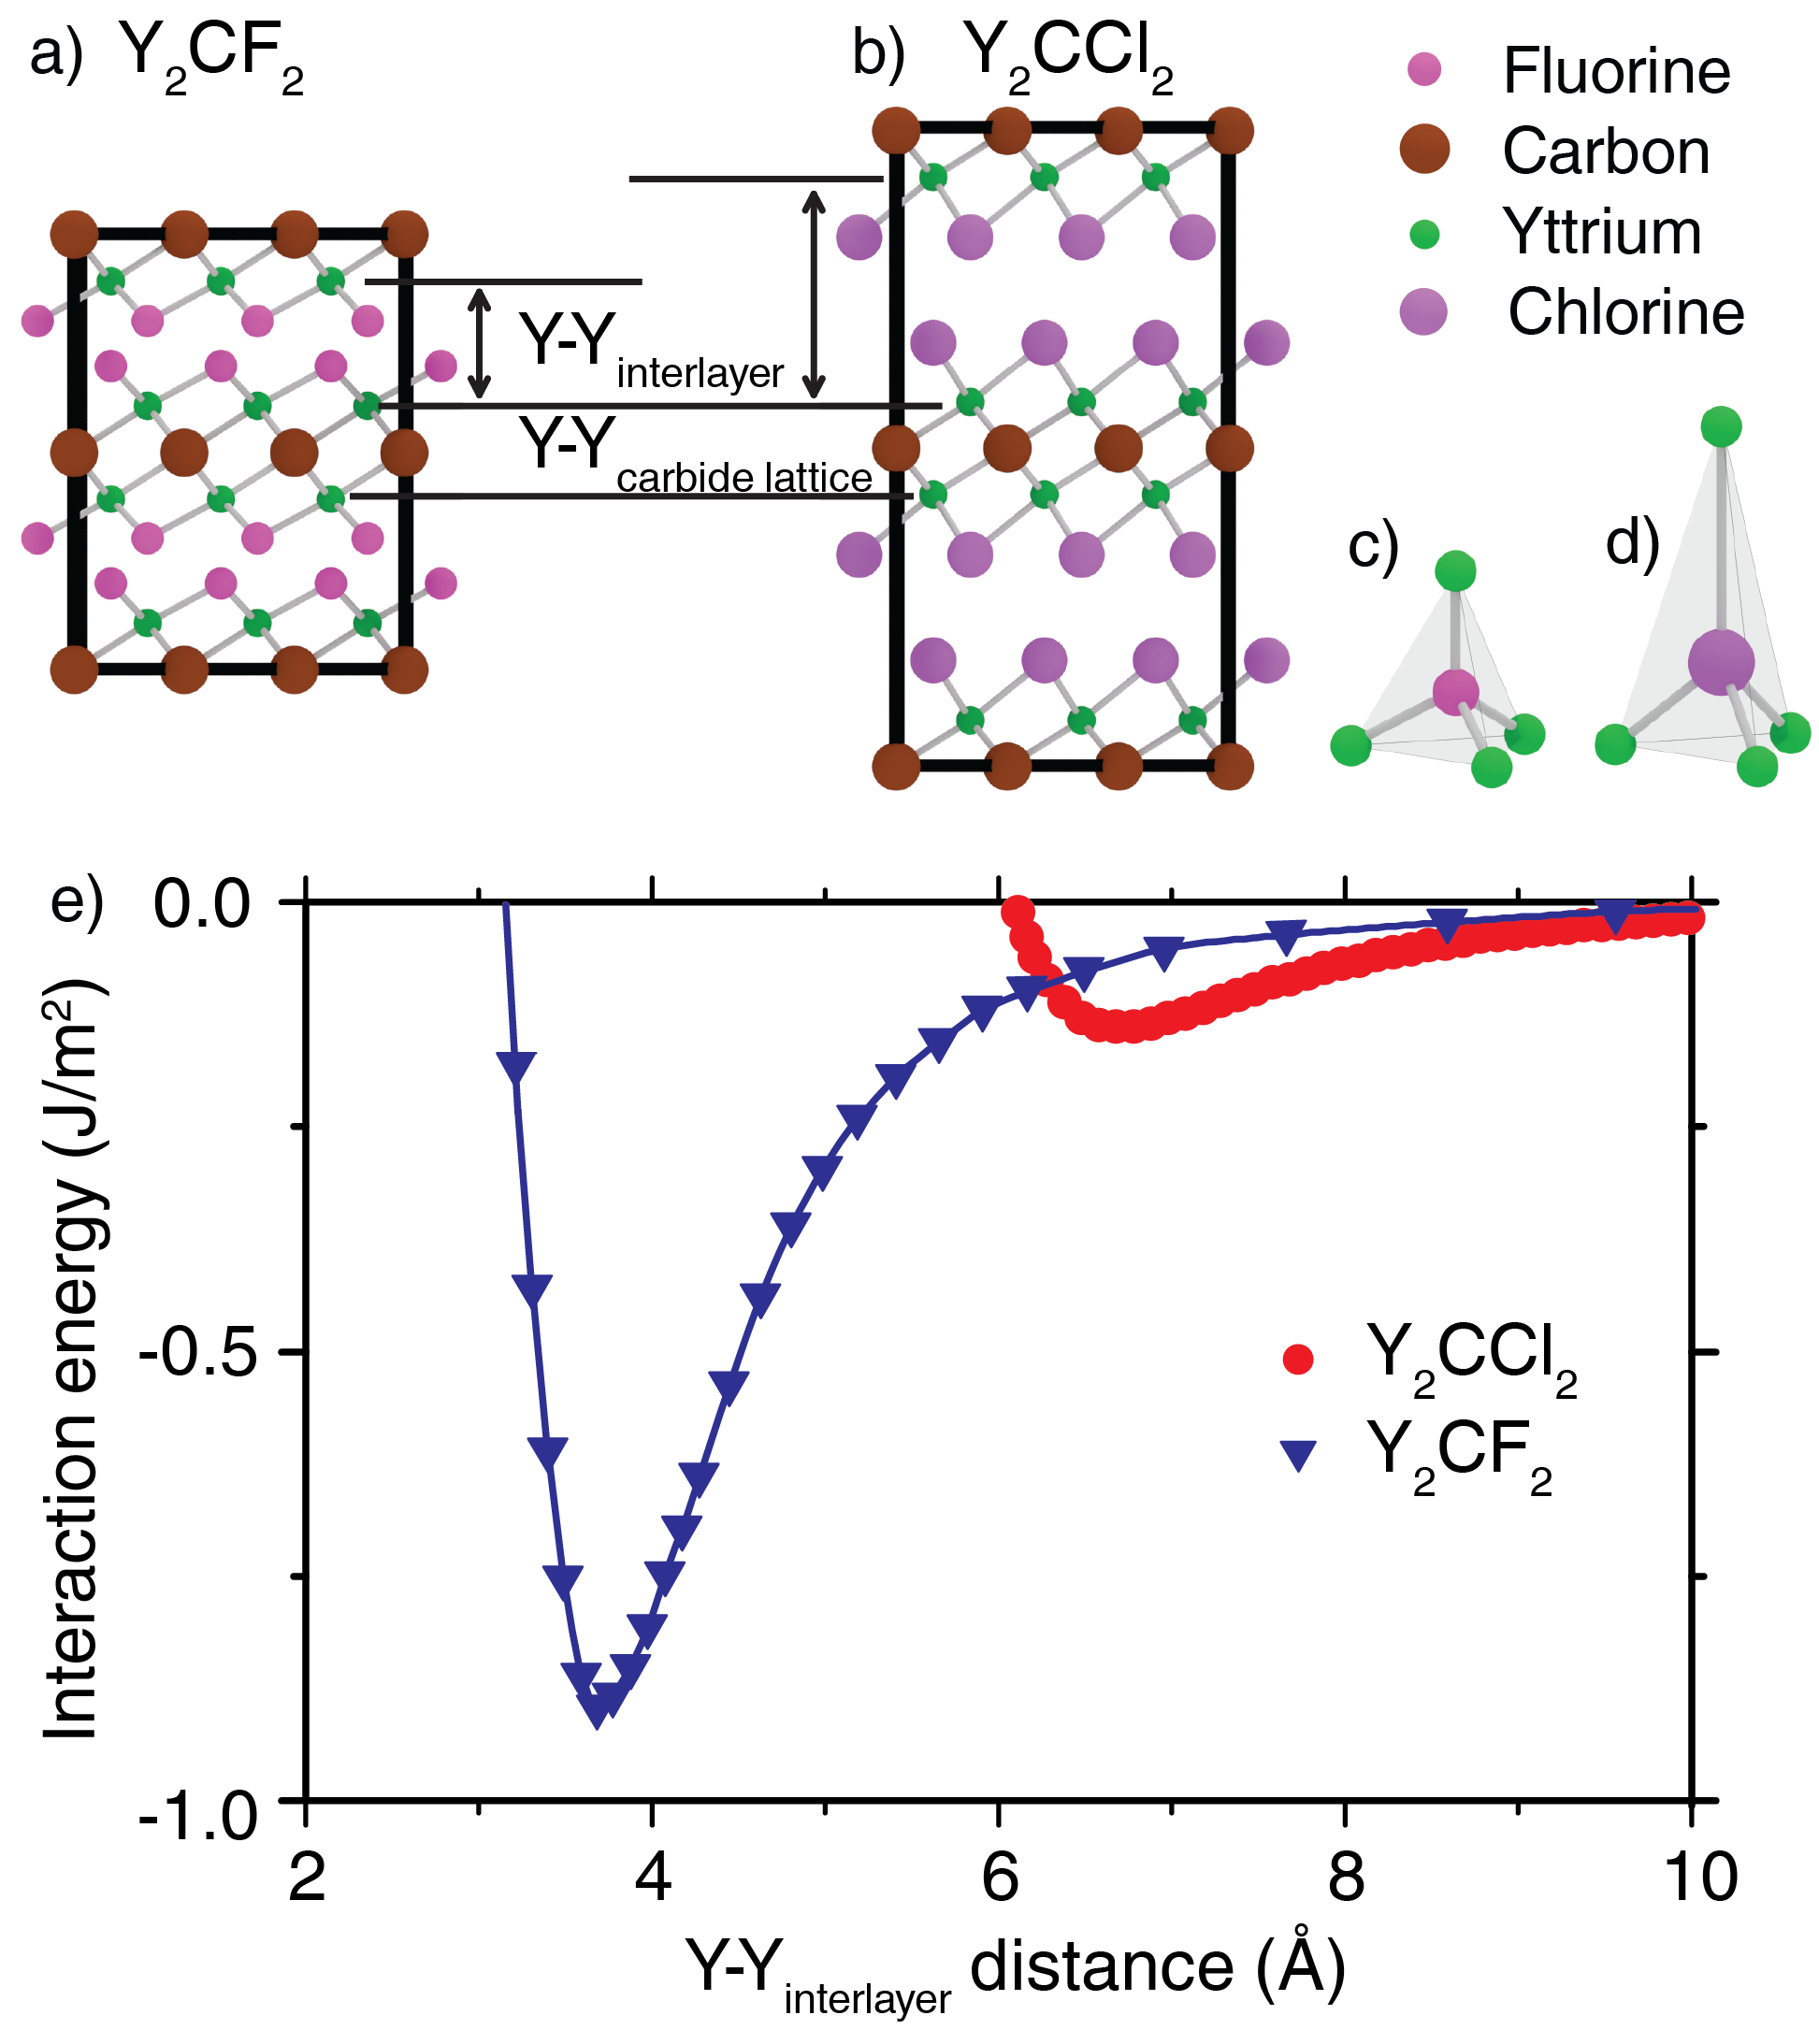
The crystal structure of Y2CF2 (Figure 2a) is similar to that of MXenes. Six Y cations octahedrally coordinate each carbon atom and the octahedra (Figure 2c) form into a two-dimensional layer, just like the 2D Ti2C(-O, -OH, -F) MXene. 51 However, in the Y2CF2 structure, each Y cation also coordinates to four F-, forming face-capped octahedra (Figure 2b). Thus, in Y2CF2, double layers of fluoride ions bind adjacent metal-carbide layers forming a crystalline 3D stack of MXene-like sheets.
Naturally, we became interested in the interlayer bonding of Y2CF2, which is distinct from the 2D nature of MXenes. The F coordinate to 4 Y with four nearly symmetric distances (Figure 3c), three to the Y in the adjacent layer (2.408 Å) and one to the Y in the opposite layer at an only slightly elongated distance (2.447 Å)(Table 2). This suggests that the interlayer bonding is relatively strong (as strong as the Y–F bonds) and highly ionic in nature.
| Atoms | Interatomic distances Å |
|---|---|
| Y–Y | 3.4315 (2), 3.6651 (3), 4.1720 (1) |
| Y–F | 2.4077 (3), 2.4470 (1) |
| F–F | 2.4827 (7) |
| Y–C | 2.5104 (6) |
| F–C | 3.2747 (6) |
This electrostatic interlayer bonding contrasts with that of other known layered metal carbide halides. For example, in Y2CCl2, 14 which shares the same crystal structure (Figure 3b, Cl coordinates only to 3 Y, all in the adjacent layer (2.755 Å). The distance to the Y in the opposite layer is nearly double (4.770 Å), far too long for any Y–Cl bonding interaction (Figure 3d). Instead, the primary interlayer interactions in Y2CCl2 are weak van der Waals forces.
Using DFT and the PBEsol functional we calculated the binding energy—the energy difference between the equilibrium bulk separation and the state in which the planes are separated by an infinite distance, as approximated by a 15 Å-thick vacuum-gap (Figure 3e). The binding energy for Y2CF2 is 0.90 J/m2, over 6 that of Y2CCl2 (0.14 J/m2) and 3 that of graphite (0.34 J/m2). 52 Electrostatic interactions between the F anion and Y cation likely account for the greater binding energy. This leads us to conclude that Y2CF2 is an ionic crystal in the out-of-plane direction. Still, the binding energy of Y2CF2 is less than that of other layered crystals, for example Ca2N (1.11 J/m2), that have been exfoliated successfully into 2D flakes. 53 These calculations suggest that it may be possible to exfoliate Y2CF2 into 2D flakes, although with somewhat greater difficulty than van der Waals crystals like Y2CCl2 or graphite.
3.2 Composition and purity
We sought to confirm the composition of our sample, as some metal carbides can sustain a variety of non-stoichiometric compositions. We used energy-dispersive X-ray spectroscopy (EDS) to quantify the amount of yttrium and fluorine (Figure S2) and measured a ratio of 1:0.98 0.05 Y:F in agreement with the stoichiometry of Y2CF2. These results also agree with the refinement from powder X-ray measurements, which yielded an occupancy of 1.00 0.01 and 1.00 0.06 for yttrium and fluorine respectively in each of their 2d sites (Table 1). Unfortunately, our EDS instrument does not quantify carbon reliably because the signal is obscured by electronic noise. Therefore, we quantified carbon by refining the occupancy of the 1a (carbon) site during the Rietveld refinement, which revealed that only 93 3 % of carbon sites are occupied. We conclude that the composition Y2CF2 represents the synthesized phase, though the real structure has carbon vacancies, Y2C0.93F2.
3.3 Electronic structure of Y2CF2
To investigate the effect of interlayer ionic bonding on the electronic structure of stacked MXene sheets, we examined the material’s optoelectronic properties using both experiment and computation. For all of the DFT calculations of the electronic structure, we used the HSE06 hybrid functional, 41 which we selected because of its suitability for estimating band gaps.
First, we performed transmission measurements to measure the absorption coefficient (Figure S4a). We observe a gradual increase in absorption beginning at 775 nm (1.6 eV), which we attribute to the band gap. The absorption increases and plateaus from 400-550 nm at a magnitude of 3.4 104 cm-1. The absorption coefficient peaks at 340 nm and again at 240 nm, though the peak at 240 is obscured by the onset of attenuation of our quartz substrate. As shown in figure 4b, our model calculates a gradual increase in absorption beginning at 700 nm (1.7 eV), in excellent agreement with our experimental measurements. The absorption coefficient plateaus from 375-450 nm at a magnitude of 3.4 104 cm-1, nearly identical to our experiment. Finally, the model predicts peaks at 300 nm and 210 nm, redshifted only 40 nm from our experimental data.
Next, we performed specular-reflectance measurements on single facets of individual Y2CF2 crystals (Figure S4) using a microspectrophotometer. To obtain a representative spectrum, we averaged the spectra from individual crystallites together (Figure 4c). The representative spectrum has a peak at 540 nm, corresponding to yellow-green light. To compare with our model of the electronic structure, we calculated the reflectivity for the bulk Y2CF2 (Figure 4d), which shows a single broad peak at 500 nm, again redshifted only 40 nm from experiment. We do note that the intensity of the reflection in the experiment is roughly 50% larger than that in the computation. While the calculation provides qualitative information, the calculation does not consider all of the complexity of the real system—chemical differences at the surface, an interface with a changing dielectric, or the convolution of reflection and absorption events. Therefore, we attribute the difference in magnitude to these factors. Despite this difference, the model reproduces the major feature of the experiment very well.
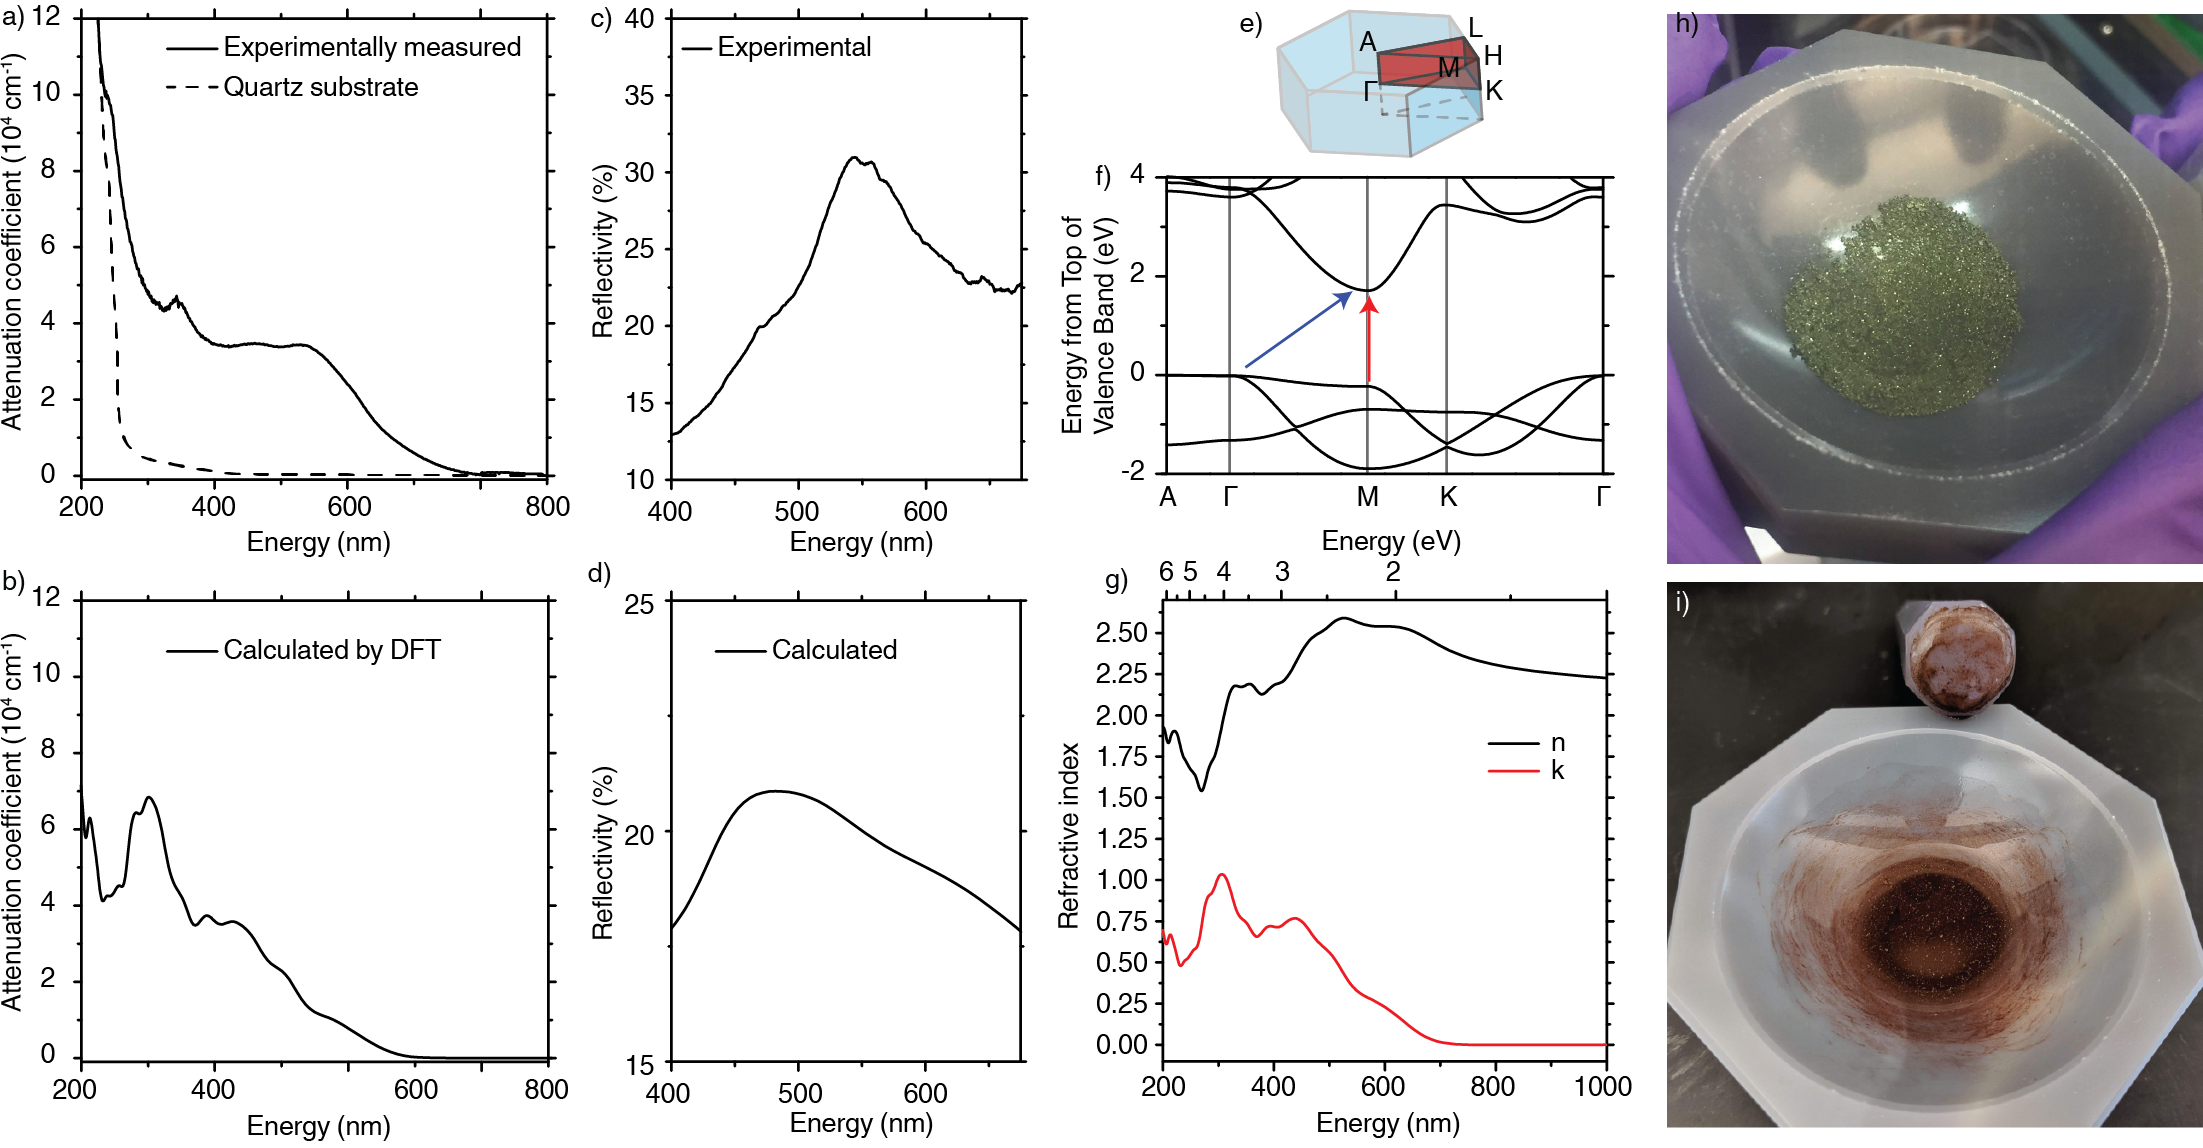
We calculated the electronic band structure for the first Brillouin zone of Y2CF2 shown in Figure 4e,f. In agreement with our experimental measurements, we calculate that Y2CF2 is a semiconductor with a 1.7 eV indirect gap (from –M) and a 1.9 eV direct gap (M–M)(Figure 4f). From the band structure, we can understand that the low absorption coefficient at 700 nm (Figure 4a,b) is due to the indirect nature of the transitions and the low density of states in the conduction band. Moreover, we gain information about the band dispersion. The bottom of the conduction band has a parabolic band dispersion, which should correspond to a modest effective mass (2.0) for electrons in the conduction band. In contrast, the valence band is relatively flat giving rise to a higher hole effective mass (4.0). Interestingly, the band has almost no dispersion along the path –A (Figure 4f) indicating very limited overlap of orbitals in the z-direction. This is likely due to the strong localization of electrons around the nucleus of the fluorine atoms, which separate layers of yttrium and carbon atoms. 54 Therefore, the ionic bonding between MXene sheets effectively insulates the sheets from one another electronically, which will give rise to highly anisotropic optoelectronic properties.
Because of the excellent agreement between theory and experiment, we present the optical constants (Figure 4g), and , calculated by DFT using the HSE06 functional with confidence that the energy-dependence of the optical constants and that the magnitude of represent the synthesized Y2CF2. Due to the difference in magnitude between experiment and theory we are less confident in the magnitude of .
This electronic structure also explains an observation about the perceived color of Y2CF2. When we ground the green crystals (Figure 4g) in a glovebox in the absence of air or water, the material transforms into a red powder shown in Figure 4i. By examining the electronic structure, we conclude that the initially perceived green color is due to specular reflection of green light from flat crystalline surfaces, as evidenced by the peak in reflection at 540 nm in Figure 4c. By grinding the crystals into small particles, we destroy the flat surfaces and the specular reflection of green light. Once ground, absorption, originating from the band gap at 775 nm, dominates the apparent color of the material. To test this hypothesis, we ball milled the crystals to a fine powder with a particle size qualitatively determined as less than 5 µm (Figure S6). We confirmed, via pXRD, that the crystal structure is preserved after ball milling (Figure S7). Then we measured the reflectance of the finely ground sample using a microspectrophotometer (Figure S8). We found that the peak at 540 nm, observed for the green crystals, was not present in the ball-milled sample.
3.4 Sensitivity to oxygen
This understanding of Y2CF2’s electronic structure also led us to understand its sensitivity to oxygen and water. We removed samples of crystalline, green Y2CF2 from the glovebox, exposing the crystals to air and water for one month. After two weeks, the once-green crystals appeared red (Figure S9). Examining the crystals in the microspectrophotometer in reflectance mode, we found that the peak in reflectance at 540 nm corresponding to the green color was not present. Instead, we observe rainbow-striping (Figure S11) and periodic oscillating signals in the reflectance spectra (Figure S11), which are indicative of thin-film optical interference. The formation of a thin-film on the surface of many semiconductors is commonly caused by a slow reaction with air or water, which forms a thin oxide coating. 55, 56, 57 Therefore, we suspected that Y2CF2 in air develops a thin film of an oxide or related species.
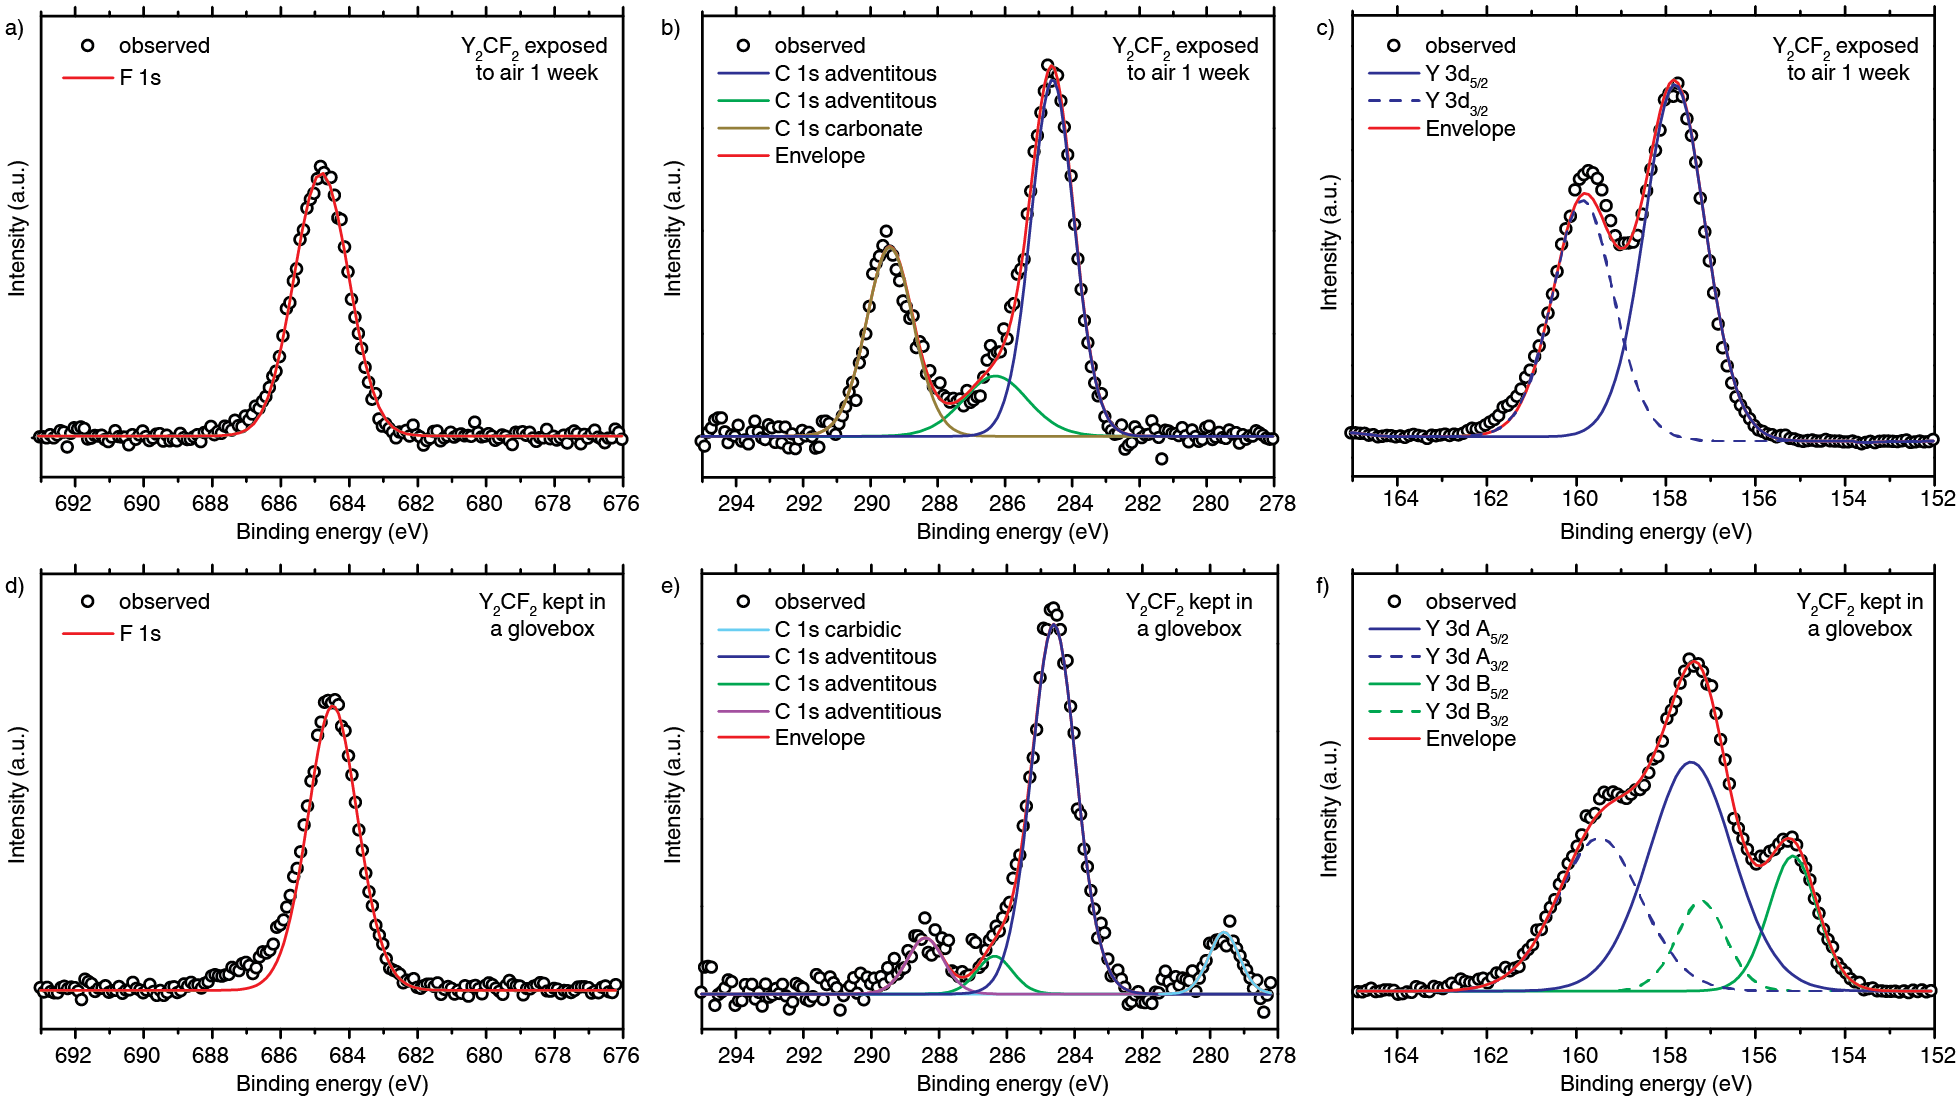
To test whether the Y2CF2 crystals react with oxygen or water, we performed X-ray photoemission spectroscopy (XPS) on crystals exposed to air for 1 week and on crystals kept in the glovebox. We examined the yttrium 3d, carbon 1s, fluorine 1s, and carbon 1s core electron binding energies (Table 3). For the sample exposed to air for 1 week, we observed a single peak at a binding energy of 684.8 eV (Figure 5a) corresponding to the F 1s core binding energy, in agreement with the binding energy of fluoride. 58 However, the Y:F ratio measured through XPS quantitative analysis is 2.0:1, suggesting a deficiency of fluorine at the surface. In the Y 3d spectrum we observe a doublet with a binding energy of 157.7 eV (Figure 5c). The position of this peak matches that of yttrium carbonate (Y2C3O9)59, 60 and is too high to be the expected Y2+ oxidation state (156 eV). 61, 62 In addition, the spectrum of the carbon 1s core (Figure 5b) reveals two distinct peaks, one centered at 284.6 eV, which is adventitious carbon and one centered at 289.4 eV, which matches that of a carbonate(Figure 5b). 63, 60 Moreover, through quantitative XPS analysis, we measure the ratio of Y:O to be 1.0:2.1, which can only be explained by a carbonate, not Y2O3 or YOF. Therefore, the data suggest the surface of the sample exposed to air has oxidized, at least partially, to Y2C3O9.
| Sample | Atom | Core | Binding Energya | FWHM | Atomic % |
| Air-exposed | Y | 3d | 157.6 | 1.56 | 21.3 |
| C | 1s | 284.6a, 286.3 | 1.33, 2.24 | 17.1 | |
| C | 1s | 289.4 | 1.63 | 7.9 | |
| F | 1s | 684.8 | 1.81 | 10.5 | |
| O | 1s | 531.2 | 1.88 | 43.2 | |
| Air-exposed | Y | 3d | 157.6 | 4.06 | 33.8 |
| sputtered | C | 1s | 284.6a, 286.0 | 1.67, 1.76 | 5.3 |
| C | 1s | 289.9 | 1.57 | 1.9 | |
| F | 1s | 685.0 | 2.11 | 16.9 | |
| O | 1s | 531.3 | 3.91 | 42.1 | |
| Glovebox | Y | 3d | 155.3 | 1.27 | 6.7 |
| Y | 3d | 157.6 | 2.19 | 19.4 | |
| C | 1s | 279.6 | 1.04 | 4.5 | |
| C | 1s | 284.6a, 286.3 | 1.25, 1.55 | 27.4 | |
| F | 1s | 684.4 | 1.75 | 18.8 | |
| O | 1s | 531.2 | 2.33 | 27.1 |
We attempted to clean the surface of the air-exposed sample by argon ion sputtering. Both the oxygen 1s and carbon 1s (Figure 5d) signals decrease in intensity relative to the yttrium. The Y:O ratio decreases to 1:1.2. This suggests that the oxidation is a surface effect. For additional support of that hypothesis, we performed XRD measurements on the samples exposed to air (Figure S10). We found the crystal structure remained intact after exposure to air for 1–4 weeks, which supports the conclusion that the oxidation affects the surface and not the bulk of the sample.
For the sample kept in a glovebox, the sample was briefly exposed to air during the transfer into the XPS instrument. We attempted this measurement multiple times and found that the sample is prone to charging. Here, we present the data from the experiment that showed the least charging. The F 1s spectrum (Figure 5d) has a single peak at 684.4 eV similar to that of the air-exposed sample (Table 3). We attribute the small tail at higher binding energies in the F 1s spectrum to this charging. The carbon 1s spectrum (Figure 5e) shows one main peak, which we attribute to adventitious carbon (Table 3) and which we used to reference the data. Referencing to any other carbon peak yields unreasonable values for the other peaks in other spectra. In addition to the adventitious carbon, we observe a peak at a very low binding energy (279.6 eV). Carbidic carbon in similar materials, for example, Sc2CCl2 (281.8), 14 Ti2C (281.5), Zr2C (281.1), and HfC (280.8), gives rise to peaks at low binding energies, but none quite as low as what we observe here. Therefore, we considered other possibilities that the signal could be due to other elements, which have signals at similar binding energies (Os 4d, Ru 3d, Sr 3p, Tb 4p, and Cl 2s). We rule out Os, Sr, Tb, and Cl becuase the XPS survey scan reveals that the most intense peaks for these elements are absent (Os 4f at 50–55 eV, Sr 3d and 3s at 130–135 eV and 357 eV respectively, Tb 4d at 150 eV, and Cl 2p at 208 eV). The most intense peak for Ru is the 3d peak. Therefore, we cannot rule out Ru directly. However, we have no reason to suspect the incorporation of Ru into our sample and its weaker peaks are absent (Ru 4s at 75 eV, Ru 3p at 463 eV, and Ru 3s at 586 eV). Therefore, we assign the peak at 279.6 eV as carbidic carbon in Y2CF2, consistent with a highly reduced form of carbon. We also note that we do not observe the signal at higher binding energies of a carbonate species for the sample kept in the glovebox. Finally, in the Y 3d spectrum, we observe two distinct yttrium signals (Figure 5f). One contribution is from a reduced form of yttrium with a binding energy of 155.3 eV, and a second contribution is from an oxidized form of yttrium at 157.6 eV that matches that of the air-exposed sample. A reduced form of yttrium is consistent with our understanding of Y2CF2, in which we expect the Y adopts a 2+ oxidation state. The second contribution is broadened compared to the air-exposed sample possibly due to the small amount of charging present during the collection of data. Therefore, we conclude that the surface of Y2CF2 oxidizes quickly during the brief transfer of the sample into the instrument and that the oxidation affects the reduced yttrium and carbidic carbon at the surface. Unfortunately, Ar-ion sputtering the surface seemed to damage the sample and only resulted in broadened peaks and more charging.
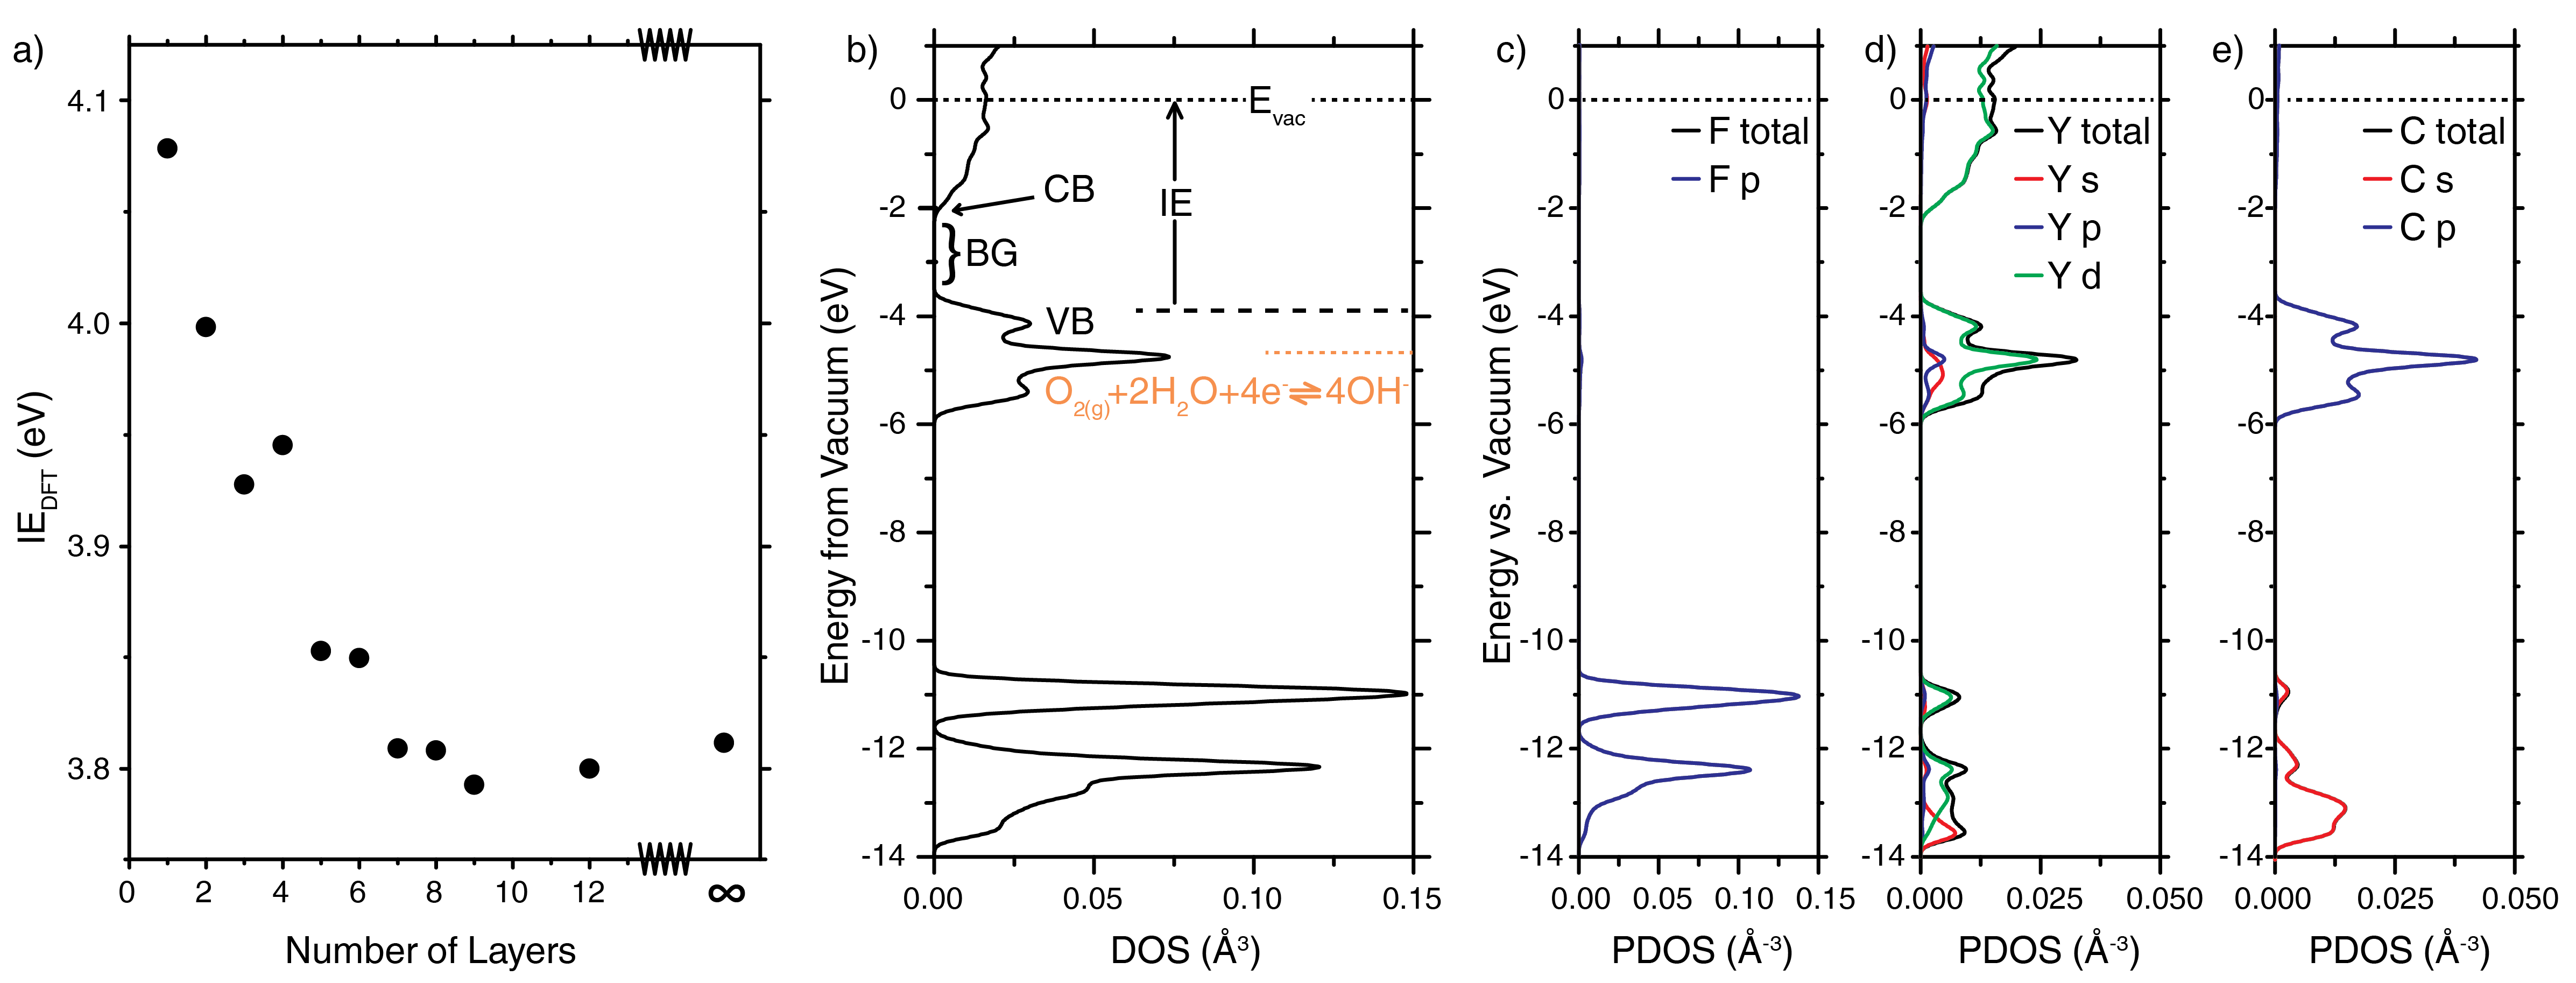
We return to the electronic structure to understand why Y2CF2 oxidizes in air. We place the band edges of Y2CF2 on an absolute scale along with the reduction potentials of oxygen and water, which are likely redox couples. We combined several measurements and calculations to place the band edges: DFT calculations gave the valence band edge (Figure 6a) and band gaps (Figure 4b,e), which are supported by our spectroscopic measurements (Figure 4a). The valence band edge is at a higher potential than the reduction potentials of oxygen and water, which explains why the material oxidizes. We gain further understanding of its reactivity through analysis of the partial density of states (PDOS), deconstructed into the elemental compositions and angular momentum (Figure 6c-e). The valence band consists of Y 4d and C 2p states. The C 2p states lie at high energies, and therefore can be readily donated. The diagram suggests electrons can be donated to oxygen, producing hydroxide. If this initial oxidation is not self-limiting, more highly oxidized products may form, such as yttrium carbonate. This mechanism is consistent with the XPS observations of fast partial oxidation to an oxide or hydroxide after a brief exposure to air and a subsequent slow oxidation to a more oxidized form.
In general, MXenes have been considered stable in air and water; however, growing evidence reveals that MXenes decompose over the course of a few days to a few weeks. 64, 65, 66, 67, 68, 69, 70, 71 For example, Ti3C2 (-O, -OH, -F) decomposes to form TiO2 in the presence of oxygen 64, 70 and water. 69, 67 In fact, the etching synthetic method, which uses strong oxidants like HF, 9 H2O2, 72 or HCl/LiF, 73 contributes to the oxidation, as evidenced by the formation of -O terminating moieties. The oxidation has consequences on the electronic structure. 74 For example, the work function of Ti3C2X (X = -O, -OH, -F) was predicted to vary from 1.9 to 6.2 eV depending on the surface terminations. 75 Moreover, the work function of MXenes with random surface moieties depends on the complex interplay between the different surface moieties and their local dipoles. 76
In this context, Y2CF2 and crystalline stacked MXenes provide an opportunity. The uniform, single F- moiety of crystalline stacked MXenes could facilitate experiments to understand and control its surface oxidation. Although we have observed that Y2CF2 oxidizes in air, the crystalline 3D MXene reported here is intrinsically oxygen-free, unlike the 2D MXenes reported so far. It therefore provides a pristine material against which changes in surface composition and surface properties can be detected. In addition, if this pristine 3D MXene can be exfolaited in water-free or oxygen-free conditions, it may also yield an unoxidized, pristine 2D MXene.
4 Conclusion
We have synthesized Y2CF2, a crystalline, 3D stack of MXene-like sheets capped exclusively by fluorine. Instead of the etching approach, we introduce a new synthetic method to directly synthesize the 3D crystal through a high-temperature solid-state reaction that ensures that only fluoride ions terminate the layers. Unlike MXenes, ionic bonds hold layers together. Interestingly, because the fluorine orbitals contribute to neither the valence band nor conduction band, the fluorine layers electrically isolate the yttrium carbide layers from each other. This imparts to the 3D crystal 2D-like electronic transport, and supports an understanding of these materials as a crystalline stack of 2D MXenes.The valence band edge, made of Y 4d and C 2p states, sits at a high potential, affording reducing character, which makes the crystal sensitive to air, but also suggests that the crystal could be useful as low work function electron emitters 77 or catalysts, 78, 79 in addition to applications in electronic, 2, 3 sensing, 4, 5 and energy storage. 6, 7, 8
S.C.W. acknowledges support of this research by NSF grant DMR-1905294. J.D.S and J.T.P. acknowledge support by the NSF Graduate Research Fellowship under grants DGE-1650114. This work was performed in part at the Chapel Hill Analytical and Nanofabrication Laboratory, CHANL, a member of the North Carolina Research Triangle Nanotechnology Network, RTNN, which is supported by the National Science Foundation, Grant ECCS-1542015, as part of the National Nanotechnology Coordinated Infrastructure, NNCI. The authors acknowledge the support of the UNC EFRC Center for Solar Fuels, an Energy Frontier Research Center funded by the U.S. Department of Energy, Office of Science, Office of Basic Energy Sciences under Award Number DE-SC0001011, for access to a Cary 5000 UV-Vis spectrometer with the DRA-2500 internal integrating sphere accessory instrumentation. The authors are also grateful to the Research Computing Center, University of North Carolina at Chapel Hill, for access to needed computing facilities to perform the computational studies reported in this work.
Additional details regarding the synthesis and characterization of Y2CF2, ball-milled Y2CF2, and air-exposed Y2CF2; SEM and EDS data, XRD, optical measurements of Y2CF2, photographs of powders.
References
- Naguib et al. 2014 Naguib, M.; Mochalin, V. N.; Barsoum, M. W.; Gogotsi, Y. 25th anniversary article: MXenes: a new family of two-dimensional materials. Advanced Materials 2014, 26, 992–1005
- Zhao et al. 2015 Zhao, M.-Q.; Ren, C. E.; Ling, Z.; Lukatskaya, M. R.; Zhang, C.; Van Aken, K. L.; Barsoum, M. W.; Gogotsi, Y. Flexible MXene/carbon nanotube composite paper with high volumetric capacitance. Advanced Materials 2015, 27, 339–345
- Li et al. 2017 Li, R.; Zhang, L.; Shi, L.; Wang, P. MXene Ti3C2: an effective 2D light-to-heat conversion material. ACS nano 2017, 11, 3752–3759
- Kim et al. 2018 Kim, S. J.; Koh, H.-J.; Ren, C. E.; Kwon, O.; Maleski, K.; Cho, S.-Y.; Anasori, B.; Kim, C.-K.; Choi, Y.-K.; Kim, J., et al. Metallic Ti3C2Tx MXene gas sensors with ultrahigh signal-to-noise ratio. ACS nano 2018, 12, 986–993
- Yu et al. 2015 Yu, X.-f.; Li, Y.-c.; Cheng, J.-b.; Liu, Z.-b.; Li, Q.-z.; Li, W.-z.; Yang, X.; Xiao, B. Monolayer Ti2CO2: a promising candidate for NH3 sensor or capturer with high sensitivity and selectivity. ACS Applied Materials & interfaces 2015, 7, 13707–13713
- Naguib et al. 2012 Naguib, M.; Come, J.; Dyatkin, B.; Presser, V.; Taberna, P.-L.; Simon, P.; Barsoum, M. W.; Gogotsi, Y. MXene: a promising transition metal carbide anode for lithium-ion batteries. Electrochemistry Communications 2012, 16, 61–64
- Liang et al. 2015 Liang, X.; Garsuch, A.; Nazar, L. F. Sulfur cathodes based on conductive MXene nanosheets for high-performance lithium–sulfur batteries. Angewandte Chemie International Edition 2015, 54, 3907–3911
- Wang et al. 2015 Wang, X.; Kajiyama, S.; Iinuma, H.; Hosono, E.; Oro, S.; Moriguchi, I.; Okubo, M.; Yamada, A. Pseudocapacitance of MXene nanosheets for high-power sodium-ion hybrid capacitors. Nature Communications 2015, 6, 6544
- Naguib et al. 2011 Naguib, M.; Kurtoglu, M.; Presser, V.; Lu, J.; Niu, J.; Heon, M.; Hultman, L.; Gogotsi, Y.; Barsoum, M. W. Two-dimensional nanocrystals produced by exfoliation of Ti3AlC2. Advanced Materials 2011, 23, 4248–4253
- Ghidiu and Barsoum 2017 Ghidiu, M.; Barsoum, M. W. The 110 reflection in X-ray diffraction of MXene films: Misinterpretation and measurement via non-standard orientation. Journal of the American Ceramic Society 2017, 100, 5395–5399
- Ghidiu et al. 2018 Ghidiu, M.; Kota, S.; Drozd, V.; Barsoum, M. W. Pressure-induced shear and interlayer expansion in Ti3C2 MXene in the presence of water. Science Advances 2018, 4, eaao6850
- Ren et al. 2015 Ren, C. E.; Hatzell, K. B.; Alhabeb, M.; Ling, Z.; Mahmoud, K. A.; Gogotsi, Y. Charge-and size-selective ion sieving through Ti3C2Tx MXene membranes. The Journal of Physical Chemistry Letters 2015, 6, 4026–4031
- Xia et al. 2018 Xia, Y.; Mathis, T. S.; Zhao, M.-Q.; Anasori, B.; Dang, A.; Zhou, Z.; Cho, H.; Gogotsi, Y.; Yang, S. Thickness-independent capacitance of vertically aligned liquid-crystalline MXenes. Nature 2018, 557, 409
- Hwu et al. 1986 Hwu, S.-J.; Ziebarth, R. P.; von Winbush, S.; Ford, J. E.; Corbett, J. D. Synthesis and structure of double-metal-layered scandium, yttrium, and zirconium chloride carbides and nitrides, M2Cl2C and M2Cl2N. Inorganic Chemistry 1986, 25, 283–287
- Henn et al. 1996 Henn, R.; Schnelle, W.; Kremer, R.; Simon, A. Bulk superconductivity at 10 K in the layered compounds Y2C2I2 and Y2C2Br2. Physical Review Letters 1996, 77, 374
- Mattausch et al. 1995 Mattausch, H.; Kremer, R.; Simon, A. The polytypism and phase width of the yttrium carbide bromides 1T-Y2Br2C1-x and 3R-Y2Br2C1-x. Zeitschrift fur Anorganische und Allgemeine Chemie 1995, 621, 1001–1006
- Ahn et al. 2005 Ahn, K.; Kremer, R. K.; Simon, A.; Marshall, W. G.; Puschnig, P.; Ambrosch-Draxl, C. Influence of pressure on the structure and electronic properties of the layered superconductor Y2C2I2. Journal of Physics: Condensed Matter 2005, 17, S3121
- Kauzlarich et al. 1988 Kauzlarich, S. M.; Hughbanks, T.; Corbett, J. D.; Klavins, P.; Shelton, R. N. Two extended metal chain compounds, yttrium iodide carbides (Y4I5C and Y6I7C2). Synthesis, structure, properties, and bonding. Inorganic Chemistry 1988, 27, 1791–1797
- Kauzlarich et al. 1990 Kauzlarich, S. M.; Payne, M. W.; Corbett, J. D. Y10I13C2: a novel compound with chains of both carbon-centered and empty clusters. Inorganic Chemistry 1990, 29, 3777–3781
- Schaloske et al. 2009 Schaloske, M. C.; Kienle, L.; Duppel, V.; Mattausch, H.; Simon, A. SE19(C2)3I34 (SE= Y, Gd): Verbindungen mit diskreten SE6I12-clustern und isolierten SE-atomen. Zeitschrift für Anorganische und Allgemeine Chemie 2009, 1, 188–195
- Mattausch et al. 1994 Mattausch, H.; Borrmann, H.; Simon, A. Crystal structure of diyttrium diiodide dicarbide, Y2I2C2. Zeitschrift für Kristallographie 1994, 209, 281–281
- Hinz and Meyer 1995 Hinz, D.; Meyer, G. Crystal structure of yttrium carbide iodide (10-4-18),[Y10(C2)2]I18. Zeitschrift fur Kristallographie 1995, 210, 957–957
- Simon et al. 1996 Simon, A.; Bäcker, M.; Henn, R.; Felser, C.; Kremer, R.; Mattausch, H.; Yoshiasa, A. Supraleitung in seltenerdmetall-carbidhalogeniden des typs SE2X2C2. Zeitschrift für Anorganische und Allgemeine Chemie 1996, 622, 123–137
- Jongen et al. 2006 Jongen, L.; Mudring, A.-V.; Meyer, G. The molecular solid Sc24C10I30: A truncated, hollow T4 supertetrahedron of iodine filled with a T3 supertetrahedron of scandium that encapsulates the adamantoid cluster Sc4C10. Angewandte Chemie International Edition 2006, 45, 1886–1889
- Dudis et al. 1986 Dudis, D. S.; Corbett, J. D.; Hwu, S. J. Synthesis, characterization, and crystal structures of two scandium cluster carbides and a boride, Sc7X12C (X= I, Br) and Sc7I12B. Inorganic Chemistry 1986, 25, 3434–3438
- Hwu and Corbett 1986 Hwu, S.-J.; Corbett, J. D. Metal-metal-bonded scandium cluster (Sc7Cl12Z) and infinite chain (Sc4Cl6Z) phases stabilized by interstitial boron or nitrogen (Z). Journal of Solid State Chemistry 1986, 64, 331–346
- Dudis and Corbett 1987 Dudis, D. S.; Corbett, J. D. Two scandium iodide carbides containing dicarbon units within scandium clusters: Sc6I11C2 and Sc4I6C2. Synthesis, structure, and the bonding of dicarbon. Inorganic Chemistry 1987, 26, 1933–1940
- Hwu et al. 1985 Hwu, S.-J.; Corbett, J. D.; Poeppelmeier, K. R. Interstitial atoms in metal-metal bonded arrays: The synthesis and characterization of heptascandium decachlorodicarbide, Sc7Cl10C2, and comparison with the interstitial-free Sc7Cl10. Journal of Solid State Chemistry 1985, 57, 43–58
- Smith and Corbett 1986 Smith, J. D.; Corbett, J. D. Four zirconium iodide cluster phases centered by boron, aluminum, or silicon. Journal of the American Chemical Society 1986, 108, 1927–1934
- Smith and Corbett 1985 Smith, J. D.; Corbett, J. D. Stabilization of clusters by interstitial atoms. Three carbon-centered zirconium iodide clusters, Zr6I12C, Zr6I14C, and MZr6I14C (M= K, Rb, or Cs). Journal of the American Chemical Society 1985, 107, 5704–5711
- Ströbele and Meyer 2010 Ströbele, M.; Meyer, H.-J. The new binary tungsten iodide W15I47. Zeitschrift für Anorganische und Allgemeine Chemie 2010, 636, 62–66
- Werner et al. 1985 Werner, P.-E.; Eriksson, L.; Westdahl, M. TREOR, a semi-exhaustive trial-and-error powder indexing program for all symmetries. Journal of Applied Crystallography 1985, 18, 367–370
- 33 Brandenburg, K.; Putz, H.; Match!, \urlhttp://www.crystalimpact.com/
- Version 2011 Version, P. 2.0. 3.0 Integrated X-ray Powder Diffraction Software. Tokyo, Japan: Rigaku Corporation 2011, 196–8666
- Clark et al. 2005 Clark, S. J.; Segall, M. D.; Pickard, C. J.; Hasnip, P. J.; Probert, M. I. J.; Refson, K.; Payne, M. C. First principles methods using CASTEP. Zeitschrift für Kristallographie–New Crystal Structures 2005, 220, 567–570
- Vanderbilt 1990 Vanderbilt, D. Soft self-consistent pseudopotentials in a generalized eigenvalue formalism. Phys. Rev. B 1990, 41, 7892
- Perdew et al. 2008 Perdew, J. P.; Ruzsinszky, A.; Csonka, G. I.; Vydrov, O. A.; Scuseria, G. E.; Constantin, L. A.; Zhou, X.; Burke, K. Restoring the density-gradient expansion for exchange in solids and surfaces. Physical Review Letters 2008, 100, 136406
- Tkatchenko and Scheffler 2009 Tkatchenko, A.; Scheffler, M. Accurate Molecular Van Der Waals Interactions from Ground-State Electron Density and Free-Atom Reference Data. Physical Review Letters 2009, 102, 073005
- Monkhorst and Pack 1976 Monkhorst, H. J.; Pack, J. D. Special points for Brillouin-zone integrations. Physical Review B 1976, 13, 5188
- Fall et al. 1999 Fall, C.; Binggeli, N.; Baldereschi, A. Deriving accurate work functions from thin-slab calculations. Journal of Physics: Condensed Matter 1999, 11, 2689
- Heyd and Scuseria 2004 Heyd, J.; Scuseria, G. E. Assessment and validation of a screened Coulomb hybrid density functional. The Journal of Chemical Physics 2004, 120, 7274–7280
- Hamann et al. 1979 Hamann, D.; Schlüter, M.; Chiang, C. Norm-conserving pseudopotentials. Physical Review Letters 1979, 43, 1494
- Rietveld 2014 Rietveld, H. M. The rietveld method. Physica Scripta 2014, 89, 098002
- Glass et al. 2006 Glass, C. W.; Oganov, A. R.; Hansen, N. USPEX–Evolutionary crystal structure prediction. Computer Physics Communications 2006, 175, 713–720
- Garcia et al. 1985 Garcia, E.; Corbett, J. D.; Ford, J. E.; Vary, W. J. Low-temperature routes to new structures for yttrium, holmium, erbium, and thulium oxychlorides. Inorganic Chemistry 1985, 24, 494–498
- Templeton and Carter 1954 Templeton, D.; Carter, G. F. The crystal structures of yttrium trichloride and similar compounds. The Journal of Physical Chemistry 1954, 58, 940–944
- Zalkin and Templeton 1953 Zalkin, A.; Templeton, D. The crystal structures of YF3 and related compounds. Journal of the American Chemical Society 1953, 75, 2453–2458
- Shannon and Prewitt 1970 Shannon, R. t.; Prewitt, C. Revised values of effective ionic radii. Acta Crystallographica Section B: Structural Crystallography and Crystal Chemistry 1970, 26, 1046–1048
- Mattausch et al. 1991 Mattausch, H.; Eger, R.; Simon, A. Das erste Gadoliniumcarbidfluorid: Gd2CF2. Zeitschrift für Anorganische und Allgemeine Chemie 1991, 597, 145–150
- Cockcroft et al. 1992 Cockcroft, J.; Kremer, R.; Mattausch, H.; Raju, N.; Simon, A. Structure and magnetic ordering of holmium carbide fluoride, Ho2CF2. Journal of Alloys and Compounds 1992, 183, 241–251
- Come et al. 2012 Come, J.; Naguib, M.; Rozier, P.; Barsoum, M. W.; Gogotsi, Y.; Taberna, P.-L.; Morcrette, M.; Simon, P. A non-aqueous asymmetric cell with a Ti2C-based two-dimensional negative electrode. Journal of the Electrochemical Society 2012, 159, A1368–A1373
- Spanu et al. 2009 Spanu, L.; Sorella, S.; Galli, G. Nature and Strength of Interlayer Binding in Graphite. Phys. Rev. Lett. 2009, 103, 196401
- Druffel et al. 2016 Druffel, D. L.; Kuntz, K. L.; Woomer, A. H.; Alcorn, F. M.; Hu, J.; Donley, C. L.; Warren, S. C. Experimental demonstration of an electride as a 2D material. Journal of the American Chemical Society 2016, 138, 16089–16094
- Albright et al. 2013 Albright, T. A.; Burdett, J. K.; Whangbo, M.-H. Orbital interactions in chemistry; John Wiley & Sons, 2013
- Kuntz et al. 2017 Kuntz, K. L.; Wells, R. A.; Hu, J.; Yang, T.; Dong, B.; Guo, H.; Woomer, A. H.; Druffel, D. L.; Alabanza, A.; Tománek, D.; Warren, S. C. Control of surface and edge oxidation on phosphorene. ACS Applied Materials & Interfaces 2017, 9, 9126–9135
- Spitzer et al. 1973 Spitzer, S.; Schwartz, B.; Kuhn, M. Electrical properties of a native oxide on gallium phosphide. Journal of The Electrochemical Society 1973, 120, 669–672
- Morita and Ohmi 1994 Morita, M.; Ohmi, T. Characterization and control of native oxide on silicon. Japanese Journal of Applied Physics 1994, 33, 370–374
- Poole et al. 1975 Poole, R. T.; Szajman, J.; Leckey, R. C. G.; Jenkin, J. G.; Liesegang, J. Electronic structure of the alkaline-earth fluorides studied by photoelectron spectroscopy. Physical Review B 1975, 12, 5872–5877
- Vasquez 1990 Vasquez, R. XPS Core level spectra of some Y compounds. Journal of Electron Spectroscopy and Related Phenomena 1990, 50, 167–170
- Dubbe et al. 1997 Dubbe, A.; Wake, M.; Sadaoka, Y. Yttria/carbonate composite solid electrolytes for potentiometric CO2 sensors. Solid State Ionics 1997, 96, 201–208
- Fujimori and Schlapbach 1984 Fujimori, A.; Schlapbach, L. Electronic structure of yttrium hydride studied by X-ray photoemission spectroscopy. Journal of Physics C: Solid State Physics 1984, 17, 341
- Mongstad et al. 2014 Mongstad, T.; Thøgersen, A.; Subrahmanyam, A.; Karazhanov, S. The electronic state of thin films of yttrium, yttrium hydrides and yttrium oxide. Solar Energy Materials and Solar Cells 2014, 128, 270–274
- Agarwal et al. 1997 Agarwal, M.; DeGuire, M. R.; Heuer, A. H. Synthesis of yttrium oxide thin films with and without the use of organic self-assembled monolayers. Applied Physics Letters 1997, 71, 891–893
- Zhang et al. 2017 Zhang, C. J.; Pinilla, S.; McEvoy, N.; Cullen, C. P.; Anasori, B.; Long, E.; Park, S.-H.; Seral-Ascaso, A.; Shmeliov, A.; Krishnan, D.; Morant, C.; Liu, X.; Duesberg, G. S.; Gogotsi, Y.; Nicolosi, V. Oxidation stability of colloidal two-dimensional titanium carbides (MXenes). Chemistry of Materials 2017, 29, 4848–4856
- Li et al. 2019 Li, G.; Jiang, K.; Zaman, S.; Xuan, J.; Wang, Z.; Geng, F. Ti3C2 sheets with an adjustable surface and feature sizes to regulate the chemical stability. Inorganic Chemistry 2019, 58, 9397–9403
- Li et al. 2019 Li, J.; Wu, J.; Wang, H.; Lu, Y.; Ye, T.; Sasase, M.; Wu, X.; Kitano, M.; Inoshita, T.; Hosono, H. Acid-durable electride with layered ruthenium for ammonia synthesis: boosting the activity via selective etching. Chemical Science 2019, 10, 5712–5718
- Huang and Mochalin 2019 Huang, S.; Mochalin, V. N. Hydrolysis of 2D transition-metal carbides (MXenes) in colloidal solutions. Inorganic Chemistry 2019, 58, 1958–1966
- Chertopalov and Mochalin 2018 Chertopalov, S.; Mochalin, V. N. Environment-sensitive photoresponse of spontaneously partially oxidized Ti3C2 MXene thin films. ACS Nano 2018, 12, 6109–6116
- Wang et al. 2017 Wang, X.; Garnero, C.; Rochard, G.; Magne, D.; Morisset, S.; Hurand, S.; Chartier, P.; Rousseau, J.; Cabioc’h, T.; Coutanceau, C.; Mauchamp, V.; Célérier, S. A new etching environment (FeF3/HCl) for the synthesis of two-dimensional titanium carbide MXenes: a route towards selective reactivity vs. water. Journal of Materials Chemistry A 2017, 5, 22012–22023
- Chae et al. 2019 Chae, Y.; Kim, S. J.; Cho, S.-Y.; Choi, J.; Maleski, K.; Lee, B.-J.; Jung, H.-T.; Gogotsi, Y.; Lee, Y.; Ahn, C. W. An investigation into the factors governing the oxidation of two-dimensional Ti3C2 MXene. Nanoscale 2019, 11, 8387–8393
- Lotfi et al. 2018 Lotfi, R.; Naguib, M.; Yilmaz, D. E.; Nanda, J.; van Duin, A. C. T. A comparative study on the oxidation of two-dimensional Ti3C2 MXene structures in different environments. Journal of Materials Chemistry A 2018, 6, 12733–12743
- Alhabeb et al. 2018 Alhabeb, M.; Maleski, K.; Mathis, T. S.; Sarycheva, A.; Hatter, C. B.; Uzun, S.; Levitt, A.; Gogotsi, Y. Selective etching of silicon from Ti3SiC2 (MAX) to obtain 2D titanium carbide (MXene). Angewandte Chemie International Edition 2018, 57, 5444–5448
- Ghidiu et al. 2014 Ghidiu, M.; Lukatskaya, M. R.; Zhao, M.-Q.; Gogotsi, Y.; Barsoum, M. W. Conductive two-dimensional titanium carbide ‘clay’ with high volumetric capacitance. Nature 2014, 516, 78
- Zhang et al. 2019 Zhang, W. L.; Deng, L.; Liu, J.; Liu, Y.; Yin, J.; Zeng, H.; Zheng, W.; Zhang, A. Unveiling the critical role of surface oxidation of electroresponsive behaviors in two-dimensional Ti3C2Tx MXenes. The Journal of Physical Chemistry C 2019, 123, 5479–5487
- Khazaei et al. 2015 Khazaei, M.; Arai, M.; Sasaki, T.; Ranjbar, A.; Liang, Y.; Yunoki, S. OH-terminated two-dimensional transistion metal carbides and nitrides as ultralow work function materials. Physical Review B 2015, 92, 075411
- Schultz et al. 2019 Schultz, T.; Frey, N. C.; Hantanasirisakul, K.; Park, S.; May, S. J.; Shenoy, V. B.; Gogotsi, Y.; Koch, N. Surface termination dependent work function and electronic properties of Ti3C2Tx MXene. Chemistry of Materials 2019, ASAP, XX
- Khazaei et al. 2017 Khazaei, M.; Ranjbar, A.; Arai, M.; Sasaki, T.; Yunoki, S. Electronic properties and applications of MXenes: a theoretical review. Journal of Materials Chemistry C 2017, 5, 2488–2503
- Seh et al. 2016 Seh, Z. W.; Fredrickson, K. D.; Anasori, B.; Kibsgaard, J.; Strickler, A. L.; Lukatskaya, M. R.; Gogotsi, Y.; Jaramillo, T. F.; Vojvodic, A. Two-dimensional molybdenum carbide (MXene) as an efficient electrocatalyst for hydrogen evolution. ACS Energy Letters 2016, 1, 589–594
- Trasatti 1972 Trasatti, S. Work function, electronegativity, and electrochemical behaviour of metals: III. Electrolytic hydrogen evolution in acid solutions. Journal of Electroanalytical Chemistry and Interfacial Electrochemistry 1972, 39, 163–184