The Formation of Ultra-Diffuse Galaxies in Clusters
1University of California Riverside, 900 University Ave., Riverside CA 92521, USA
2Department of Physics and Astronomy, University of Victoria, Victoria, BC V8P 5C2, Canada
3Department of Physics, Cornell University, Ithaca, NY 14853, USA
4Department of Astronomy, Peking University, 5 Yiheyuan Road, Beijing, China 100871
5Kavli Institute for Astronomy and Astrophysics, Peking University, 5 Yiheyuan Road, Beijing, China 100871
6Herzberg Astronomy and Astrophysics Research Centre, National Research Council of Canada, Victoria, BC V9E 2E7, Canada
7Harvard-Smithsonian Center for Astrophysics, 60 Garden Street, Cambridge, MA 02138, USA
Abstract
We use the IllustrisTNG cosmological hydrodynamical simulation to study the formation of ultra-diffuse galaxies (UDGs) in galaxy clusters. We supplement the simulations with a realistic mass-size relation for galaxies at the time of infall into the cluster, as well as an analytical model to describe the tidally-induced evolution of their stellar mass, velocity dispersion and size. The model assumes “cuspy” NFW halos and, contrary to recent claims, has no difficulty reproducing the observed number of UDGs in clusters. Our results further suggest that the UDG population consists of a mixture of “normal” low surface brightness galaxies such as those found in the field (“born” UDGs, or B-UDGs), as well as a distinct population that owe their large size and low surface brightness to the effects of cluster tides (“tidal”, or T-UDGs). The simulations indicate that T-UDGs entered the cluster earlier and should be more prevalent than B-UDGs near the cluster centres. T-UDGs should also have, at given stellar mass, lower velocity dispersion, higher metallicities, and lower dark matter content than B-UDGs. Our results suggest that systems like DF-44 are consistent with having been born as UDGs, while others such as DF2, DF4 and VLSB-D are possibly extreme T-UDG examples.
keywords:
galaxies: clusters: general – galaxies: haloes – galaxies: dwarfs1 Introduction
Low surface brightness (LSB) galaxies have long been known to constitute an important segment of the galaxy population, but challenges in identifying them in large panoramic surveys have resulted in incomplete counts and insufficiently accurate characterization of their intrinsic properties (Sandage & Binggeli, 1984; Dalcanton et al., 1997; Impey et al., 1988; Galaz et al., 2011; Greco et al., 2018). In the field, LSBs are most often systems of unusually large size and relatively inefficient star formation that populate predominantly the faint-end of the galaxy stellar mass function. Their extreme properties make them as challenging to observe as they are to account for in current models of galaxy formation.
The advent of LSB-sensitive surveys and telescopes with specialized optics such as Dragonfly (Abraham & van Dokkum, 2014) have rekindled interest in LSBs and in the faint tail of the surface brightness distribution. New cluster surveys, together with tailored re-analysis of existing photometric data, have resulted in the identification of a “new” population of dwarf (i.e., ) LSBs in clusters; these systems have spheroidal morphologies, are predominantly gas free, and are mainly red in color. Using a conventional definition of limiting effective surface brightness mag/asec2 (-band) and an effective radius - kpc these systems have become known as “Ultra-Diffuse Galaxies” (UDGs) (van Dokkum et al., 2015; Koda et al., 2015; Yagi et al., 2016; Muñoz et al., 2015; Mihos et al., 2015; van der Burg et al., 2016; Venhola et al., 2017).
Originally thought to be a distinct population, UDGs are now believed to constitute the high-end of the size distribution of dwarf galaxies in clusters and the field. Indeed, the mag/asec2 criterion designates many ordinary LSB field galaxies as UDGs, a feature that has often confused the discussion of whether UDGs are a “cluster phenomenon” or just the faint end of the galaxy surface brightness distribution.
Furthermore, systems of much fainter surface brightness than any cluster UDG have long been known. For example, most satellites of the Milky Way (MW) and Andromeda (M31) have much fainter than any Dragonfly UDG in the Coma cluster. Indeed, extreme objects such as Crater II, And XIX, and Antlia II (Torrealba et al., 2016; McConnachie et al., 2008; Torrealba et al., 2019) have up to fainter than Coma Dragonly UDGs (see; e.g., Fattahi et al., 2019).
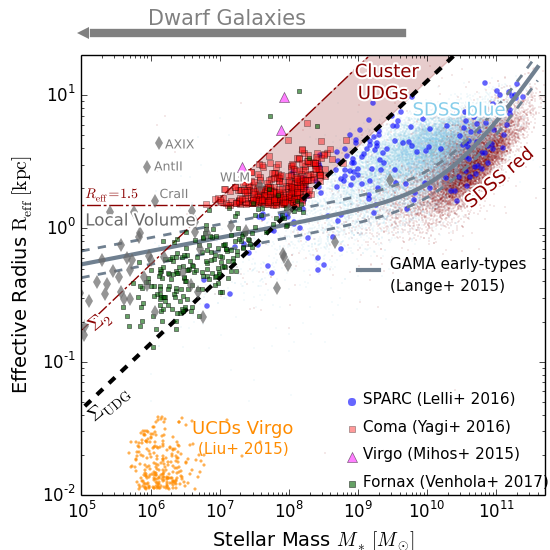
Although UDGs are clearly not just a cluster phenomenon, this does not mean that clusters are not special environments that may radically transform galaxies and somehow favor or induce the formation of UDGs. Indeed, it is well established that dwarf galaxies in clusters span a dramatic range in sizes (Fig. 1), from the ultra-compact dwarfs common in Virgo (UCDs, Liu et al., 2015) to the UDGs in Coma (Yagi et al., 2016), Virgo (Mihos et al., 2015), and Fornax (Venhola et al., 2017)111We have assumed a stellar mass to light ratio for -band (Carleton et al., 2019) and for -band to estimate stellar masses.. Explaining this enormous range in dwarf galaxy sizes remains a difficult challenge for galaxy formation models.
Regarding UDGs, three questions are still hotly debated: the mass of their surrounding halos; the origin of their large sizes; and their relation to the environment. Halo mass estimates are necessarily indirect, but it has been argued that the high stellar velocity dispersions of systems like DF44 and DFX1 indicate halos as massive as , suggestive of “failed” Milky-Way like galaxies (van Dokkum et al., 2017). On the other hand, several other UDGs have lower velocity dispersions, consistent with the low mass halos expected given their stellar mass (Zaritsky, 2017; Toloba et al., 2018). More recently, improved data and modelling of some of the highest velocity dispersion UDGs have also favored lower mass halos of (e.g. van Dokkum et al., 2019b).
The globular cluster populations of UDGs are also quite diverse, and have been used to argue for a wide range of halo masses (Beasley et al., 2016; Peng & Lim, 2016; Lim et al., 2018; Toloba et al., 2018). Finally, at least 2 UDGs have velocity dispersions so small that they may be consistent with having no dark matter halo at all (van Dokkum et al., 2018; van Dokkum et al., 2019a). This issue, and their interpretation, has generated a healthy discussion that is still ongoing (see e.g., Martin et al., 2018; Laporte et al., 2019; Trujillo et al., 2019). Given these mixed properties, there is growing consensus that more than one formation path may be needed to explain the diversity of UDGs.
Several UDG formation scenarios have been proposed, and may be grouped as “internal” or “external”. Internal scenarios include those where UDGs correspond to the high-spin tail of the galaxy angular momentum distribution (Amorisco & Loeb, 2016), although this is disfavoured by the spheroidal (i.e., non-disk) morphology of some cluster UDGs (Román & Trujillo, 2017; Eigenthaler et al., 2018) as well as by results of some hydrodynamical simulations (Jiang et al., 2019; Tremmel et al., 2019). Another scenario posits that most dwarfs go through expansion and contraction phases driven by sudden outflows of gas following episodes of active star formation (see; e.g., Navarro et al., 1996; Pontzen & Governato, 2012). Dwarfs that are caught at the expansion phase during cluster infall may be “frozen” in that stage, leaving behind a dwarf of unusually low surface brightness (Chan et al., 2018; Di Cintio et al., 2017). This is a viable (albeit perhaps contrived) scenario that awaits confirmation from detailed simulations that include the evolution of such dwarfs in the cosmological setting of cluster formation.
The most promising external scenario concerns the transformation of galaxies as a consequence of the mean tidal field of the cluster. Simulations of tidal stripping of galaxies embedded in extended dark matter halos show that this process may lead to remnants of much lower surface brightness than their progenitors (Peñarrubia et al., 2008; Errani et al., 2015; Tomozeiu et al., 2016). This transformation may be aided by the loss of the gas component due to ram pressure with the cluster’s gaseous component (Arraki et al., 2014; Frings et al., 2017; Yun et al., 2019). The final outcome are puffed-up, red, quiescent objects that resemble UDGs (Safarzadeh & Scannapieco, 2017; Román & Trujillo, 2017; Jiang et al., 2019).
The formation of UDGs via tidal stripping has recently been studied by Carleton et al. (2019), who argue that turning a typical spheroidal galaxy into a UDG can only be accomplished if the dark matter halos that host field dwarfs have large constant density “cores”, unlike the cusps expected in the cold dark matter (CDM) scenario. This is because dwarfs in cored halos are more easily disturbed and evolve more dramatically in surface brightness than dwarfs in cuspy, NFW halos (Navarro et al., 1996, 1997). The Carleton et al. (2019) study, however, did not consider normal LSB galaxies as potential UDG progenitors, an assumption that is not clearly justified and that may compromise the general applicability of their conclusion.
We address these issues here by supplementing the cosmological simulations of galaxy cluster formation from the IllustrisTNG simulation suite (Pillepich et al., 2018b) with an analytical model of the tidal disruption of galaxies in the cluster potential. Our model adopts the results of Errani et al. (2015) and, although it is similar in approach to that of Carleton et al. (2019), it also differs from it in a few important aspects. For example, we shall consider the whole field galaxy population as potential UDG progenitors, and not just compact early-type galaxies. In addition, we shall use the baryonic version of the TNG simulations, and not just the dark-matter-only run of Illustris-1. This is important, as the loss of baryons in dwarf galaxies (which can only be followed in hydrodynamical runs) leads to less tightly-bound systems more prone to tidal disruption (Brook & Di Cintio, 2015; Sawala et al., 2015, 2016). In addition, the assembly of the central cluster galaxy deepens the potential and may enhance tidal stripping (D’Onghia et al., 2010; Garrison-Kimmel et al., 2017). Our analysis is similar to that of Fattahi et al. (2018) (who focused on the effects of tidal stripping on satellites of MW-like systems), but scaled up in mass to the “satellites” of massive clusters.
This paper is organized as follows. Sec. 2 introduces the TNG simulations and galaxy samples and describes the tidal evolution model applied in this work. Sec. 3 presents our main results, including the formation of UDGs and their present-day predicted properties. In Sec. 4 we summarize and discuss the implications of our results.
2 Methods
2.1 The simulations
We use the cosmological hydrodynamical simulation Illustris-The Next Generation (TNG for short; Pillepich et al., 2018b; Nelson et al., 2018; Springel et al., 2018; Marinacci et al., 2018; Naiman et al., 2018; Nelson et al., 2019). The TNG suite of simulations includes several box sizes of varying resolution, as well as runs with and without baryons.
In this work we use the TNG100-1 run, which is the highest resolution box with 107 Mpc on a side that includes the treatment of baryons. The simulations follow the evolution of DM and gas elements from a starting redshift until today. TNG assumes a cold dark matter cosmology (CDM) with parameters consistent with Planck XIII results (Planck Collaboration et al., 2016): , , , Hubble constant km s1 Mpc-1, and a power spectrum with primordial index normalized to .
Gravity and baryons are followed using the arepo code (Springel, 2010). The baryonic treatment is largely based on the code used for its predecessor simulation suite, Illustris (Vogelsberger et al., 2013; Vogelsberger et al., 2014b, a; Genel et al., 2014; Nelson et al., 2015), with modifications described in Pillepich et al. (2018a).
In brief, TNG follows self-consistently the heating and cooling of the gas down to K with an effective equation of state for gas above the star formation threshold . Such gas can turn into stars with a local efficiency of , after which stellar evolution models calculate the mass and metallicity of the stellar particles.
Stellar feedback from winds of massive stars and supernova explosions is coupled kinematically to the gas, with an efficiency that varies according to the metallicity of the stars. AGN feedback including the fast- and slow- accretion rates of gas onto supermassive black holes is modeled with a mixture of thermal and kinetic energy deposition modes following Weinberger et al. (2017). Finally, ideal MHD is coupled to the hydrodynamics to track the properties of magnetic fields (Pakmor et al., 2011; Pakmor & Springel, 2013).
At the resolution level of TNG100-1, the particle masses are and for baryons and dark matter, respectively. The gravitational softening for collisionless elements like dark matter and stars is pc or better. The highest resolution gas elements can have gravitational softenings as small as (comoving) pc.
Galaxies in the simulations are identified using subfind (Springel et al., 2001; Dolag et al., 2009) on Friends-of-Friends (FoF) groups (Davis et al., 1985) identified with a linking length set to the mean interparticle separation. The time evolution of galaxies and halos is followed by using the SubLink merger trees (Rodriguez-Gomez et al., 2015).
2.2 Simulated galaxy clusters
We select the most massive halos in the TNG100-1 simulated volume, with virial222We adopt a virial definition where the averaged spherical density within the virial radius, , is times the critical density for closure. mass at . This criterion selects 14 objects (the most massive has ) with masses comparable to that estimated for the Virgo cluster.
We consider for our analysis all galaxies associated with the FoF groups of these clusters that have a minimum stellar mass (or, equivalently, at least 25 stellar particles). We also impose a similar minimum dark matter mass to ensure that spurious self-gravitating baryonic clumps that are occasionally identified by subfind are excluded from our sample. A total of galaxies spread over 14 clusters make up the full simulated galaxy sample.
2.3 The mass and size of simulated galaxies
To study UDGs in the simulated galaxy population we need robust estimates of stellar mass and half-mass radius. The TNG simulations reproduce the galaxy stellar mass function remarkably well (Pillepich et al., 2018b), suggesting that stellar masses are captured correctly by the simulations. Galaxy sizes, on the other hand, are much less robust, and are strongly affected by a number of numerical artifacts and limitations, such as the use of a finite gravitational softening, a limited number of particles, a relatively high threshold for star formation, and an effective equation of state. Additionally, the different particle mass used to model the dark matter and stars, a common practice in cosmological simulations, has been shown to cause an artificial transfer of energy to the stellar component via 2-body scattering that may also impact the predicted galaxy sizes (Ludlow et al., 2019). The combination of these effects mentioned above impose an effective minima on the size of simulated galaxies that affect dwarfs in particular and that severely limit our ability to study UDGs directly using simulation data.
We circumvent this limitation by assigning to each of our galaxies, at the time of first cluster infall (), a stellar mass-dependent effective radius drawn from a realistic distribution of galaxy sizes. Infall times are defined as the last time a galaxy became a satellite of a larger system. This can be the time galaxies join their clusters or an earlier time if they infall as part of a galaxy group. Note that only the stellar radii are chosen that way; stellar and dark halo masses are measured directly from the simulation at . The tidal evolution model we describe below (Sec. 2.4) allows us to compute their final stellar mass, effective radii and velocity dispersion at .
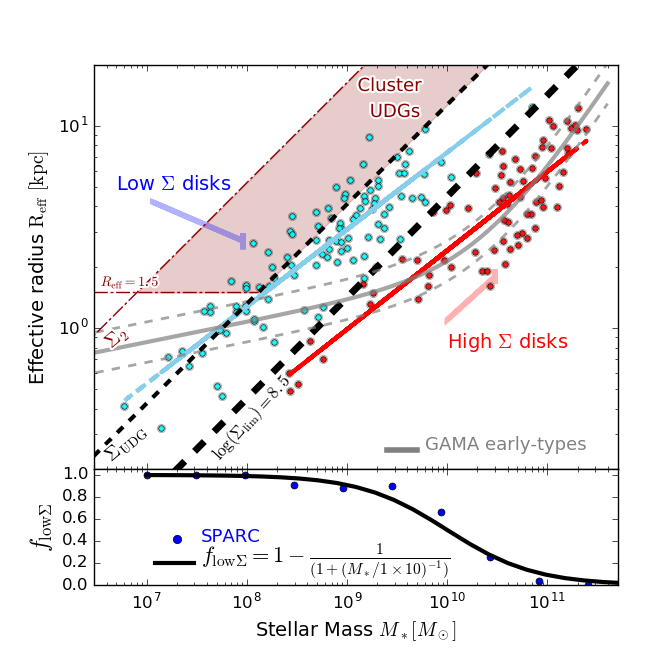
Effective radii are drawn assuming that they follow the (redshift-corrected) empirical relations for late-type galaxies (including LSBs) taken from the SPARC compilation of local, , galaxies (Lelli et al., 2016). This assumption is consistent with the idea that before joining a larger system, each galaxy is a star-forming galaxy in the field.
The stellar mass vs size relation of SPARC galaxies is shown in Fig. 2, assuming a mass to light ratio of in the 3.6 band (Lelli et al., 2016). This relation shows considerable scatter in the projected stellar effective radius, , at fixed stellar mass. Two groups or “sequences” of “high” and “low” surface brightness may be easily identified on each side of a dividing value of kpc2, indicated by the thick black dashed line.
The high- group dominates the massive end; the low- group contains most of the dwarfs. The fraction of galaxies that belong to each sequence varies smoothly as a function of , as shown in the bottom panel Fig. 2. The low- and high- sequences follow slightly different relations, which we approximate as power laws: kpc, with and respectively. These fits are shown in Fig. 2 with cyan and red lines, respectively. The rms scatter in radii for both of these relations is similar, .
The grey curves in Fig. 2 indicate the location of early-type galaxies from the GAMA survey, including scatter (Lange et al., 2015; Liske et al., 2015). These overlap well the regime of high- disks, but have much smaller sizes than the low- sequence. These low surface brightness objects are the most likely to turn into UDGs by tidal effects, and leaving them out, as in Carleton et al. (2019), who only considered GAMA spheroids, can have a strong effect on the results.
Our modeling uses the two-sequence description of SPARC galaxies to assign sizes to all galaxies at infall time. In practice, we proceed as follows. Using its stellar mass at , each galaxy is randomly assigned to the low- or high- sequences by following the SPARC fractions shown in the bottom panel of Fig. 2. Once this sorting is done, we use the individual power-law relations for the low- or high- sequence (plus scatter) to assign an infall value of to each galaxy. The projected effective radius is then converted into a 3D stellar half mass radius, denoted with hereafter, by assuming: . Although in principle this conversion factor might change from in the case of elliptical galaxies to for disks (see e.g., Somerville et al., 2018), we choose to keep the modeling simple by assuming the same transformation for all galaxies regardless of their morphological type.
Additionally, because the infall redshift, , can be quite early, and galaxy sizes are known to decrease with increasing redshift (see e.g., van der Wel et al., 2014), we correct the half mass radius (derived from the SPARC sample) to evolve at infall time by (Paulino-Afonso et al., 2017). This procedure yields a population of cluster galaxies characterized by their infall times and stellar masses (from the simulation) as well as their sizes (computed as described above). The evolution of the dark halos surrounding these galaxies may be followed to in order to estimate the effects of cluster tides on the stellar component, as described below.
2.4 Tidal evolution model
Our tidal evolution model of cluster galaxies makes use of the work of Peñarrubia et al. (2008); Peñarrubia et al. (2010) and Errani et al. (2015), who showed that the evolution of a stellar system deeply embedded in the gravitational potential of a dark matter halo may be described in terms of a single parameter. This parameter may be taken to be the total bound mass fraction remaining within the original (3D) half mass radius of the stars, . Since each galaxy halo can be tracked through time, the total mass lost by from within the initial (i.e., at infall) half-mass radius can be computed directly from the simulation. This mass loss can then be used to predict the changes in stellar mass and effective radius of each individual cluster galaxy using the effective radius assigned at infall. The mass loss estimates are robust, since even the faintest galaxies in our sample inhabit fairly massive halos, typically resolved with tens of thousands of dark matter particles.
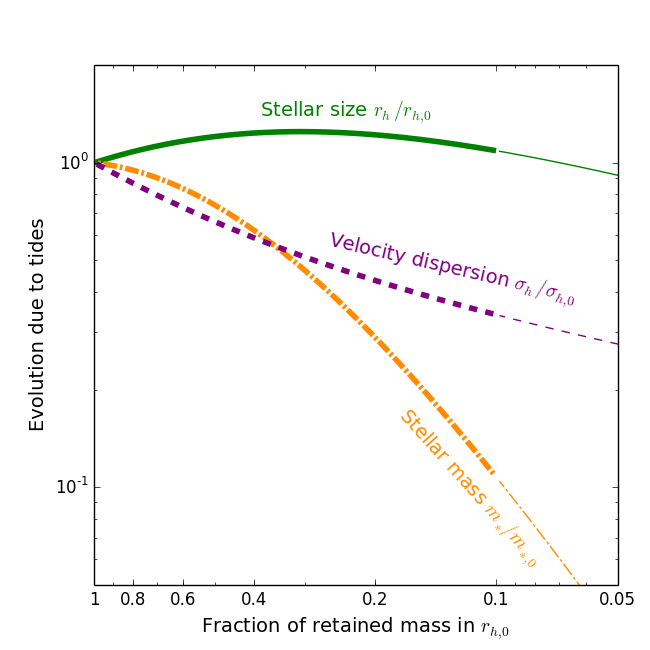
The tidal evolution model, which has been calibrated using numerical simulations, may thus be used to predict the stellar half mass radius, , stellar mass, and velocity dispersion, , at the present day in units of their initial infall values (“0” subscript). The results are adequately approximated by a simple formula:
| (1) |
where is the fraction of mass that remains bound within and (,) are constants given in Table 1 and taken from Errani et al. (2015). These constants vary slightly with the relative segregation of stars relative to the dark matter. In what follows we assume the values with segregation in the Errani et al. (2015) model, but we have checked that our conclusions are qualitatively unchanged if a segregation of 0.1 is assumed instead.
Fig. 3 illustrates the resulting tidal evolution tracks when applying Eq. 1 as a function of . Despite its simplicity, these formulae have been shown to reproduce quite well the tidal evolution of satellite galaxies in cosmological hydrodynamical simulations of galaxy formation (see, e.g, Fig. 3 of Fattahi et al., 2018). Additionally, using the dark matter only run of TNG100 we have explicitly checked that the evolution of and of satellites under tidal disruption in our clusters are well described by the tidal tracks from idealized simulations presented in Peñarrubia et al. (2010) within an r.m.s scatter dex and dex for velocity and , respectively.
Objects under tidal stripping may also suffer of “tidal heating", by which the stellar component may puff-up as a result of energy injection during the pericenter passages. This is included in the tidal tracks modelled by Eq. 1 and partially explain the slight expansion in radius seen in Fig. 3. However, as demonstrated by the comparison between the orange and green curves in Fig. 3, the main effect of tidal stripping on the stellar component of a galaxy is to gradually reduce its stellar mass while keeping its size approximately constant. This implies that heavily stripped galaxies will be systems of much lower surface brightness than expected at given stellar mass. Stripping also reduces the stellar velocity dispersion, but to a somewhat lesser extent.
The fits using Eq. 1 have only been validated by simulation results for the range . This range is indicated by thick line types in Fig. 3. Many of our cluster galaxies have experienced mass losses that exceed the lower bound of that range, with a sizable fraction () in the range . We shall assume that the same fitting formulae apply in that regime, although we caution that the properties of such “extreme tidal remnants” should be considered as preliminary until much higher resolution simulations are available.
Finally, it is certainly possible that some cluster galaxies may have experienced tidal losses even more extreme than , the minimum we are able to track at the resolution of the TNG100-1 run. These systems would be missed in our simulated sample, which is based on galaxies that survive333We note that recent work argues that current N-body simulations may substantially underestimate the number of surviving substructure in clusters (van den Bosch et al., 2018; van den Bosch & Ogiya, 2018). to , but they may very well exist in true clusters. Their existence and, presumably, their extreme properties cannot be discounted.
To summarize, we model the tidal evolution of individual galaxies by measuring the total mass at within the half mass radius assigned at infall (as described in Sec. 2.2) and comparing it with its value at infall. Eq. 1 then allows us to predict the stellar mass, size and velocity dispersion at present day of all cluster galaxies. We require a minimum of dark matter particles at within the infall half-mass radius to include a galaxy in our analysis.
3 Results
3.1 UDGs in clusters
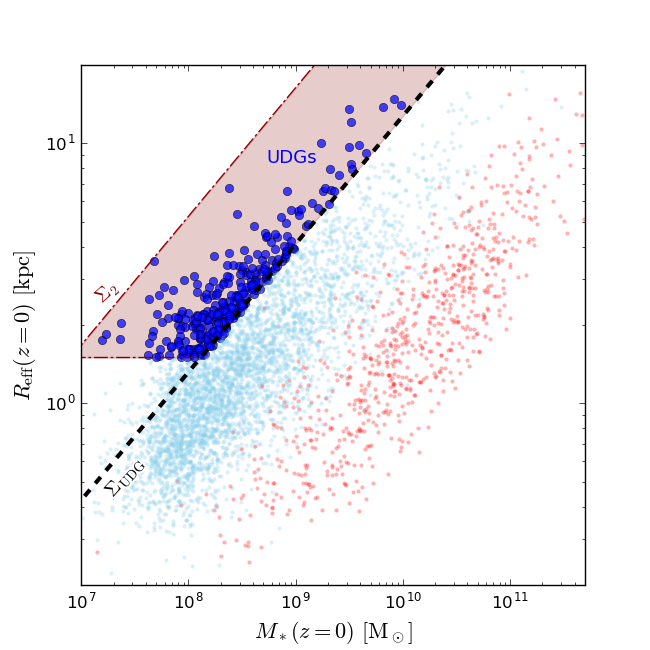
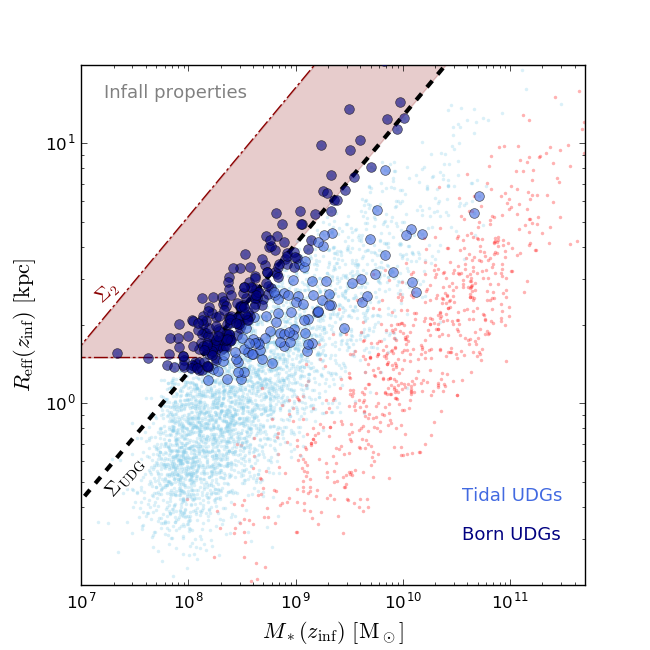
The result of the procedure described above, applied to all 14 clusters, is shown in the left panel of Fig. 4. As in Fig. 2, we use cyan and red symbols to indicate galaxies that were assigned to the low- and high- surface brightness sequences, respectively. The red shaded region indicate the UDG criteria, defined as in Koda et al. (2015): /kpc2 (black dashed line), plus two additional boundaries: /kpc2 (i.e., the equivalent of r-band surface brightness 28.5 mag/arcsec2) and kpc, shown by dash-dotted red lines. The criterion kpc is introduced in order to exclude more compact, “normal” dwarfs (van Dokkum et al., 2015).
On average, - galaxies fall in the UDG regime within the projected virial radius of each cluster (a median of UDGs per cluster), and the numbers double if we consider the whole extent of the cluster FoF groups, which extends slightly beyond the virial boundaries of the cluster. Moreover, we have explicitly checked that including scatter in the tidal tracks assumed for our analytical modeling of tidal disruption would result in a somewhat larger number of UDGs per cluster (for example, double the number of UDGs is formed when allowing for dex scatter in the modeling of stellar size from Eq. 1).
The main takeaway point is that UDGs have no trouble “surviving” in the harsh tidal environment of a cluster in sizeable numbers. Indeed, the number of simulated UDGs per cluster is in reasonable agreement with the number of UDGs identified in Virgo (Lim et al., in prep.) (although these authors use a slightly different selection criteria based on the overall shape of the -size relation) as well as with the results of van der Burg et al. (2016); van der Burg et al. (2017), who report of order - UDGs for clusters of comparable virial mass.
We note that this result does not require that dark matter halos have “cores”, as argued recently by Carleton et al. (2019). Their analysis and modeling is actually similar to ours, although they use the dark-matter-only version of an earlier version of the Illustris simulation suite. The main difference between our work and theirs is that they only consider early-type galaxies from GAMA as potential progenitors for UDGs. These galaxies are more compact than the SPARC population we adopted here, and, hence, much more resilient to stripping (see Fig. 2 for a direct comparison). That resilience is what led Carleton et al. (2019) to conclude that “cored” halos are needed to explain the UDG cluster population. We would argue that our approach, which includes both low and high surface brightness galaxies as potential UDG progenitors, samples more fairly the field population and is, therefore, more realistic.
3.2 Origin of UDGs
Where do the UDGs shown in the left-hand panel of Fig. 4 originate from? This may be gleaned from the cluster galaxy properties at infall, which are shown in the right-hand panel of the same figure. Galaxies that end up as UDGs at are shown with large blue circles. Two different hues are used; dark to denote those that were within the UDG boundaries already at infall, and a lighter hue for those that evolved to become UDGs as a result of tidal stripping. In what follows, we refer to these two populations as “born UDGs” (B-UDGs) and “tidal UDGs” (T-UDGs), respectively. We emphasize that this classification corresponds only to the initial condition of each galaxy at infall and it does not mean that B-UDGs are free from tidal effects later within the cluster. For T-UDGs, it is the stellar mass stripping at nearly constant radius (see Fig. 3) that dominates their environmental transformation into UDGs.
The two panels of Fig. 4 illustrate a couple of interesting points. One is that many cluster UDGs are relatively unevolved remnants of field LSB galaxies that fell into the cluster and, presumably, lost their gas and stopped forming stars. They may have been affected by the cluster tidal field, but only mildly. This B-UDG population make up of UDGs in our cluster simulation. A second point is that the remainder, T-UDGs, make up a substantial fraction of the UDG population, and originate from a varied mixture of galaxies which were typically much more massive at infall than today. This mixed origin can help to explain the wide spectrum of observed UDG properties referred to in Sec. 1.
This is in good agreement with previous simulations where approximately half of UDG-like objects form as simple analogs of dwarfs in the field (B-UDGs here) and the remaining half by tidal interactions in the form of tidal stripping or tidal heating (Jiang et al., 2019; Liao et al., 2019). Our study extends these results in two main aspects. First, our field population follows, by construction, the observed stellar mass-size relation of galaxies and does not therefore overproduce the number of field UDGs. This is not the case for Jiang et al. (2019), where all simulated dwarfs with are as diffuse as observed UDGs, at odds with the non-dominant fraction of dwarfs that are UDGs. Second, we study UDGs in cluster environments with , while previous studies focused on groups (, Jiang et al., 2019) or Milky Way like hosts (Liao et al., 2019). It is, however, reasuring that different techniques and simulation codes confirm the existence of more than one mechanism to form UDG-like objects.
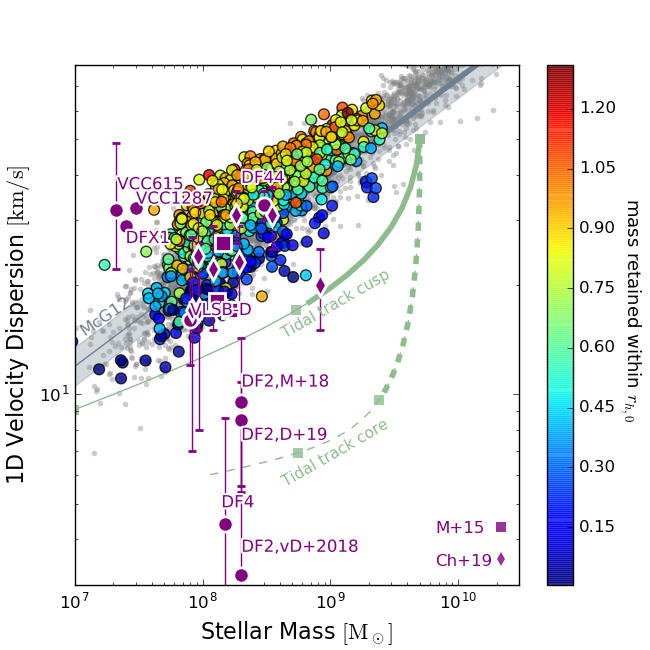
3.3 UDG velocity dispersions
One of the most controversial aspects of UDGs has been their dark matter content. This is inferred from the line-of-sight velocity dispersion of stellar tracers, measured through spectroscopy of stellar absorption lines, or from the kinematics of the globular cluster systems. Published studies report a wide range of velocity dispersions for UDGs, from km/s in objects like DF2 and DF4 (so low that it may imply little to no dark matter, van Dokkum et al., 2018; van Dokkum et al., 2019a; Danieli et al., 2019) to as high as km/s for the globular cluster population ( km/s for the stellar dispersion at ) of DF44, which suggests a fairly massive dark matter halo (van Dokkum et al., 2016, 2019c).
We explore the velocity dispersion of simulated UDGs in Fig. 5. Velocity dispersions are estimated from the circular velocity at the stellar-half mass radius, assuming the relation for dispersion-supported objects from Wolf et al. (2010); i.e., . is calculated directly from the particle data in the simulation by measuring the dark matter and stellar mass enclosed within the evolved () half-mass radius of each galaxy. An additional 10% downward scaling is applied to all TNG velocities in order to correct for a small systematic offset between the simulated and observed Baryonic Tully-Fisher (BTF) relation of field galaxies (McGaugh, 2012).
Fig. 5 shows the stellar mass-velocity dispersion relation for all cluster galaxies at (grey points), as well as for the UDGs (large circles, colored by the bound mass fraction retained by each object). Reddish symbols correspond to B-UDG systems, whose dark matter content within the stellar half mass radius has been relatively unaffected by tides. Blue circles, on the other hand, denote mainly T-UDGs, where tides have led to large mass losses and, consequently, large changes in stellar mass and velocity dispersion.
Cluster galaxies relatively unaffected by tides, as well as B-UDGs, agree well with the observed BTF (grey shaded band labeled McG12 in Fig. 5, where maximum rotation velocities have been scaled by factor to turn them into ). We note that this agreement is not guaranteed by our procedure, which only uses the stellar mass of a galaxy at infall to assign it a stellar half-mass radius—its velocity dispersion follows mainly from the total dark matter contained within that radius. Simulated galaxies are slightly offset to higher velocities at fixed stellar mass or, equivalently, to lower at fixed . This is likely a consequence of our assumption that galaxies stop forming stars at the time of infall, biasing galaxies to be less massive than they should actually be.
Tidal losses can reduce both the stellar mass and the velocity dispersion, pushing galaxies to the bottom of the relation seen in Fig. 5. This provides one way of distinguishing B-UDGs from T-UDGs: at fixed stellar mass, the latter should have significantly lower velocity dispersions than the former.
Tidally-stripped galaxies move along “tidal tracks” in this figure, such as the example shown by the green solid curve in Fig. 5. This curve show the loci of possible tidal remnants of a galaxy progenitor with initial stellar mass, , and 1D velocity dispersion km/s. Square symbols along the curve indicate remaining bound mass fractions, spaced by successive factors of ten (i.e., , , , etc.).
For comparison, data for Coma and Virgo UDGs are shown with magenta symbols and labeled individually in Fig. 5 (Toloba et al., 2018; van Dokkum et al., 2018; van Dokkum et al., 2019a; Martin et al., 2018; Danieli et al., 2019; van Dokkum et al., 2019c; Makarov et al., 2015; Chilingarian et al., 2019). High-velocity dispersion UDGs, such as DF44, are in agreement with simulated B-UDGs. On the other hand, the comparatively low velocity dispersion of the Virgo VLSB-D dwarf is in better agreement with T-UDGs, which have undergone substantial tidal disruption. Encouragingly, the morphology of VLSB-D is very elongated, as is its globular cluster system, strongly suggestive of ongoing tidal disruption (Toloba et al., 2018).
One main conclusion from this comparison is that the tidal origin of some UDGs implies substantial diversity in velocity dispersion at fixed stellar mass. In addition, we note that the shape of the solid tidal track in Fig. 5 becomes shallower than the main - trend for extreme values of the mass loss. This implies that velocity dispersions much below km/s are highly unlikely for systems with . Such velocity dispersion is at the high end of the estimates for DF2. Much lower velocity dispersions, such as those reported for DF4, seem, at first glance, difficult to reproduce in our simulations, where galaxies form in “cuspy”, NFW-like halos (Bose et al., 2019). If confirmed, accommodating the lower limits of the measured kinematics for DF2 and DF4 would be rather challenging in our modeling. Indeed, few, if any tidal tracks originating in the undisturbed galaxy population would leave a remnant with such low velocity dispersion.
Several interpretations are possible for this result. One is that this may indicate a non-tidal origin for these extreme objects; i.e., DF2 and DF4 may simply form in ways and/or halos with properties not reproduced in our simulations. A more conservative interpretation, however, is that the failure to reproduce systems like DF2 and DF4 is a result of numerical limitations in the simulations, which prevent us from including the most extremely tidally stripped systems in our sample (see Carleton et al., 2019, for a similar conclusion). Indeed, we caution that the tidal tracks in Fig. 5 include a substantial extrapolation in the range, outside the regime validated by available simulations (middle squared symbol in each track; the extrapolated regime is shown as a thinner curve). It is possible that larger drops in velocity dispersion may accompany extreme tidal losses, but this t would need to be confirmed with higher resolution simulations that extend the range probed in our current tidal evolution model.
Finally, the extreme velocity dispersions of DF2 and DF4 may indicate the presence of a “core” in the initial inner density profile of their surrounding halos. Tidal tracks in the presence of a core differ in shape, as indicated by the dashed green curve in Fig. 5, which uses the results of the “cored” halo progenitor in the simulations of Errani et al. (2015). A core leads to much lower velocity dispersions for extreme tidal remnants, allowing better agreement with DF2 and DF4.
It is perhaps too early to use these results as evidence for a cusp or core in such galaxies, especially given the limited tidal track range actually validated by simulations and the large uncertainty in the observational estimates, but it is an intriguing issue to which we hope to return to in future work. Low velocity dispersion UDGs such as DF2 and DF4 are akin to the “cold faint giant” satellites of the MW and M31, Crater 2 and And XIX. The kinematics, size, and stellar mass of the latter also suggest, in the context of current CDM models of dwarf galaxy formation, that they might be the remnants of extreme tidal stripping events (Fattahi et al., 2018). Regardless of whether halos have cores or cusps, these extreme tidal remnants should be relatively rare. Should many systems comparable to DF2 and DF4 be found, or if they were found in isolation (where tidal effects would have been negligible), this would certainly call into question this scenario.
3.4 UDG metallicities
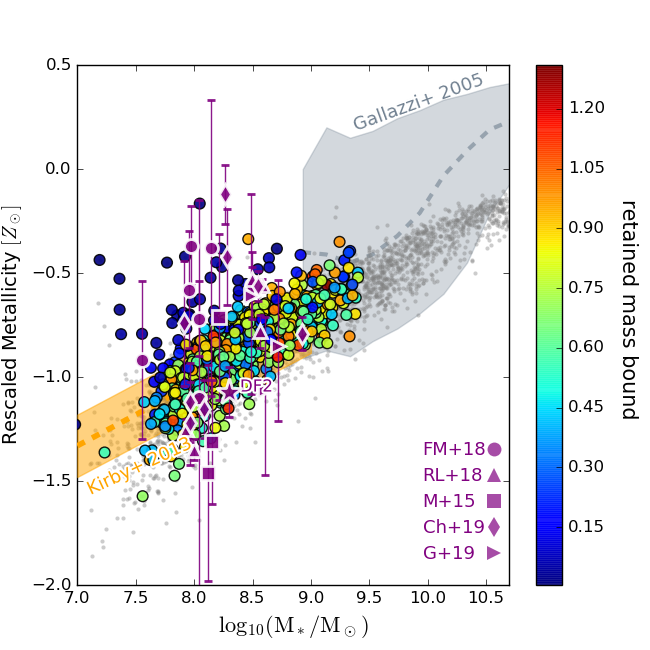
Like velocity dispersions, the metallicities of UDGs may also be used to investigate their origin. In particular, T-UDGs are expected to deviate from the mass-metallicity relation of B-UDGs, which should track the main galaxy population. This is shown in Fig. 6, where it is clear that galaxies heavily affected by tidal striping (i.e., T-UDGs, those in bluish colors) may have, at fixed stellar mass, higher metallicities than normal galaxies, or B-UDGs.
We note that simulations like TNG generally have difficulty matching the average mass-metallicity relation of dwarfs (see Nelson et al., 2018, for a more detailed discussion), so the simulated metallicities in Fig. 6 have been uniformly re-scaled to roughly match at . This has little impact on our conclusions, which refer mainly to the differential effect on the metallicity of T-UDGs compared to normal galaxies(and B-UDGs) similar stellar mass. Here, we have used the metallicity at for the simulated galaxies, but the same conclusion applies if using the metallicities at . For comparison, we include the present-day mass metallicity relations from Gallazzi et al. (2005) and Kirby et al. (2013), assuming a solar abundance equivalent of , as in Schaye et al. (2015).
Available metallicity estimates for observed UDGs are included in Fig. 6 (Ruiz-Lara et al., 2018; Ferré-Mateu et al., 2018; Makarov et al., 2015; Gu et al., 2018; Chilingarian et al., 2019; Fensch et al., 2019) using magenta symbols, where we have transformed iron abundances [Fe/H] into full metallicities [Z/H] when necessary following Eq. 3 in Boecker et al. (2019) and assuming [/Fe] = 0.25, the median [Mg/Fe] in the Ferré-Mateu et al. (2018) sample.
Combining velocity dispersion with metallicity estimates provides an excellent diagnostic of the effect of tides. Cluster (or satellite) galaxies that have lower and higher metallicity than expected for their stellar mass are excellent candidates for being tidal remnants, or T-UDGs. The relatively low metallicity measured for DF2 (Fensch et al., 2019) may complicate its interpretation as a tidal remnant, although several simulated galaxies that have lost at least 55% of their mass within lie close to the mass and metallicity of DF2. On the other hand, the relatively high metallicities of some of the measured UDGs, Yagi275 and Yagi276 for example, bear well for our interpretation of such systems as extreme tidal remnants, although more detailed modeling is needed to validate this hypothesis.
3.5 Radial distribution and orbital kinematics
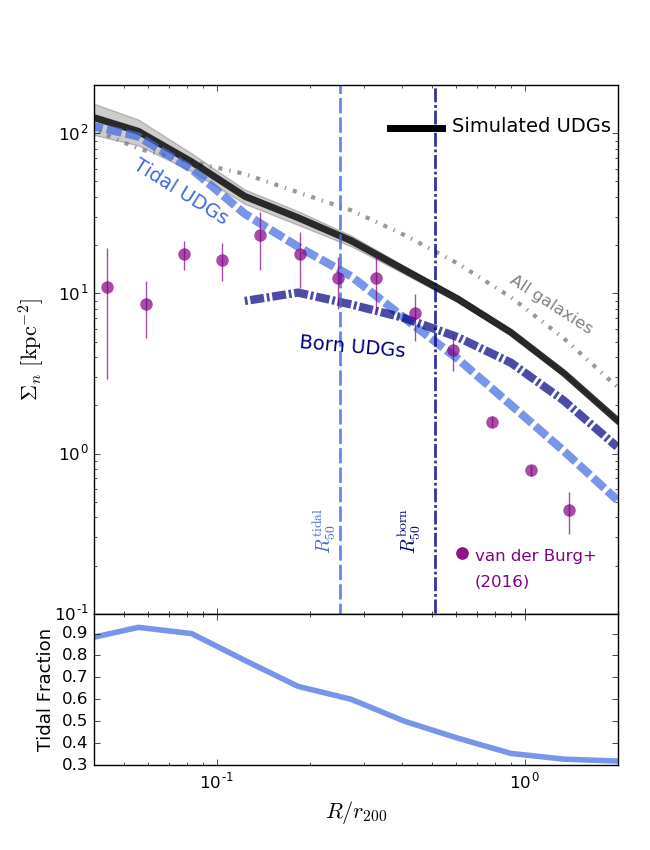
The spatial distribution and orbital kinematics of UDGs in clusters also carry information about their origin, and it is something we can readily study in our simulations. We explore this in Fig. 7, where the upper panel shows the projected number density profile of UDGs in all our 14 clusters. Clustercentric radii are scaled to the virial radius, and three orthogonal projections are used for each cluster before combining them to produce the average density profile shown by the solid black line. For comparison, the profile corresponding to all cluster galaxies (with , the minimum in our sample) is shown by the grey dotted curve, which has been rescaled down by a factor of so as to match the central density of the UDG curve. The comparison shows that UDGs are only slightly biased relative to the cluster population at large, with a somewhat steeper density profile.
Interestingly, B-UDGs and T-UDGs have quite different radial profiles: the former tend to avoid the central regions of the cluster and are overrepresented in the cluster outskirts, likely because they typically inhabit low-mass halos that are fully disrupted by tides in the central regions (see also Jiang et al., 2019, for a similar conclusion using analytical arguments). There, only systems that were originally fairly massive can survive the strong tidal field, leading to a population of UDGs made up predominantly of T-UDGs. Half of all T-UDGs are expected to lie inside one third of the virial radius, whereas the half-number radius of B-UDGs is as large as .
These results seem at odds with those reported by van der Burg et al. (2016) for the Coma cluster, where UDGs seem to avoid the cluster center (see magenta symbols with error bars in Fig. 7). Before reading too much into this discrepancy, we note that UDGs are very difficult to identify observationally, especially so near the cluster center, where the intracluster light is especially bright and may compromise detection. We plan to address this issue in more detail in future work. We also note that UDGs in the Virgo cluster seem to follow a cuspier distribution (Lim et al, in preparation).
The distinct radial distribution of T-UDGs and B-UDGs is also reflected in their infall times, which are shown in Fig. 8. Both populations of UDGs, as well as the cluster population as a whole, are shown with different color histograms, normalized to the same area. B-UDGs infall much later than T-UDGs, as expected. They also infall later than the population as a whole, which indicates that most early infalling B-UDGs have been tidally disrupted and are not present at .
T-UDGs, on the other hand, are typically more massive systems at infall (see Fig. 4), are more resilient to tides, and may survive to the present day. In some sense, this lends support to the idea of UDGs as “failed massive galaxies”, whose growth has been truncated by cluster infall and whose properties have been radically shaped by tides. The effect, however, is modest: the average infall halo mass of B-UDGs is roughly , compared with for T-UDGs ( of T-UDGs have infall virial mass ).
The infall time distinction between UDGs has interesting implications for stellar ages. Assuming that most galaxies stop forming stars in earnest soon after infall (as in our model), this implies that T-UDGs should have much older stellar populations than B-UDGs. For instance, Ferré-Mateu et al. (2018) finds intermediate to old ages ( Gyr) stellar populations in Coma UDGs, and little difference with other “normal” dwarfs at similar cluster-centric distances. In our scenario, this implies that they are mainly B-UDGs.
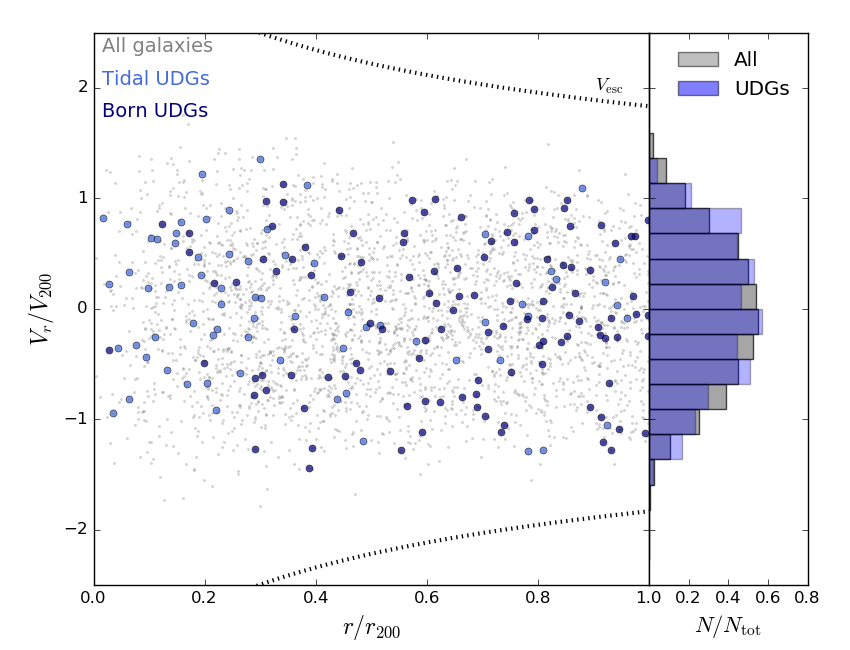
Since UDGs are well mixed with the general cluster population we expect little kinematic differentiation between the two. This is shown in Fig. 9, where the phase diagram of all cluster galaxies (scaled to virial quantities) is shown. Because the velocity dispersion is nearly independent of radius, there is little difference in the velocity distribution of T-UDGs, B-UDGs, and the cluster as a whole. Most velocities sit comfortably within the escape velocity boundaries of an NFW halo of concentration comparable to that of the average cluster. Overall, these results seem to agree quite well with those of Alabi et al. (2018), who argue, based on their velocity distribution, for a wide range of infall times for the UDG population.
4 Summary and Conclusions
We have used fourteen galaxy clusters from the Illustris TNG100-1 simulation to study the formation of cluster UDGs in the CDM cosmology. We supplement the simulations with a tidal evolution model that allows us to track the structural evolution of galaxies as they undergo tidal disruption in the gravitational potential of the cluster. The model makes clear predictions for the radial distribution and kinematics of UDGs, as well as for the velocity dispersion, surface brightness, metallicity, and ages of their stellar populations. We analyze the cluster population at using similar UDG selection criteria as in Koda et al. (2015). We note that these criteria designate as UDGs a number of field low surface brightness galaxies, which are likely potential progenitors of cluster UDGs.
Our main finding is that cluster UDGs have primarily two different origins: “normal” field LSBs that are “born” as UDGs in the field and then enter the cluster (B-UDGs), and a second population that is made up of higher surface brightness galaxies transformed into UDGs by extensive mass loss due to tides (T-UDGs). Tidal and born UDGs add up to a sufficient number of UDGs to match the lower end of observational estimates for clusters (van der Burg et al., 2017). We conclude that there is no need to invoke “cores” in dark matter halos to explain the abundance of cluster UDGs.
Our analysis also identifies diagnostics that may be used to distinguish between these two different formation paths. The substantial mass loss needed to tidally form UDGs turns them into outliers of typical galaxy scaling relations, with lower velocity dispersions and higher metallicities at fixed stellar mass. Tidal UDGs also entered the cluster significantly earlier ( Gyr ago) than surviving B-UDGs, which, on average, were accreted into the cluster Gyr ago. As a result, tidal UDGs dominate in the inner regions of galaxy clusters and their stellar ages should be on average older than those of B-UDGs.
These results are, in principle, within reach of spectroscopic studies. The few cases with robust metallicity/age estimates ( objects to date) seem to have low metallicities (), often enhanced alpha-elements (), and intermediate to old stellar populations Gyr (Makarov et al., 2015; van Dokkum et al., 2016; Kadowaki et al., 2017; Ferré-Mateu et al., 2018; Ruiz-Lara et al., 2018; Danieli et al., 2019). These properties are what would be expected from B-UDGs, which are in essence field galaxies whose star formation history ceased after entering the cluster but which were otherwise only modestly affected by cluster tides.
Our results lend some support to the “evolutionary” scenario proposed by Román & Trujillo (2017) that connects young UDGs in the field, groups and clusters. However, our simulations also predict the formation of an extra T-UDG population made up of galaxies severely affected by tidal stripping. The large metallicities of UDGs from the study Ferré-Mateu et al. (2018), Yagi275 and Yagi276, suggest a possible tidal origin for these objects, a result that deserves future investigation.
Other examples of T-UDGs may be objects with low dark matter component. A few candidates have been identified, such as VLSB-D (Toloba et al., 2018), DF2 (van Dokkum et al., 2018) and DF4 (van Dokkum et al., 2019a), with velocity dispersions (as suggested by their globular cluster system and stars for the case of DF2, see Danieli et al., 2019) that are too low to contain significant amounts of dark matter. Our model identifies these systems with “extreme tidal remnants” that have lost the majority of their mass (dark and luminous) to tides. If this is true, objects like VLSB-D, DF2, and DF4 should be rare, but they may yet provide the best evidence for the substantial transformation of galaxies through tides that our models predict.
The existence of a T-UDG population, with its predicted older ages, enhanced concentration at the cluster center, lower velocity dispersions, and higher metallicities is one of the key predictions from our study, and one that future surveys, especially those able to identify extreme LSB galaxies against the intracluster light near the cluster center, should be able to validate or rule out.
Acknowledgments
The authors would like to thank the anonymous referee for a constructive report that helped improve the first version of this manuscript. We would like to also thank Azadeh Fattahi, Christina Manzano-King and Cecilia Scannapieco for making available some of the data included in Fig. 1. LVS acknowledges support from NASA through the HST Program AR-14583 and from the Hellman Foundation. EWP acknowledges support from the National Natural Science Foundation of China under Grant No. 11573002. LH is grateful for support from NSF program AST1815978.
References
- Abraham & van Dokkum (2014) Abraham R. G., van Dokkum P. G., 2014, PASP, 126, 55
- Alabi et al. (2018) Alabi A., et al., 2018, MNRAS, 479, 3308
- Amorisco & Loeb (2016) Amorisco N. C., Loeb A., 2016, MNRAS, 459, L51
- Arraki et al. (2014) Arraki K. S., Klypin A., More S., Trujillo-Gomez S., 2014, MNRAS, 438, 1466
- Beasley et al. (2016) Beasley M. A., Romanowsky A. J., Pota V., Navarro I. M., Martinez Delgado D., Neyer F., Deich A. L., 2016, ApJ, 819, L20
- Boecker et al. (2019) Boecker A., Leaman R., van de Ven G., Norris M. A., Mackereth T., Crain R. A., 2019, arXiv e-prints, p. arXiv:1903.11089
- Bose et al. (2019) Bose S., et al., 2019, MNRAS, 486, 4790
- Brook & Di Cintio (2015) Brook C. B., Di Cintio A., 2015, Monthly Notices of the Royal Astronomical Society, 450, 3920
- Carleton et al. (2019) Carleton T., Errani R., Cooper M., Kaplinghat M., Peñarrubia J., Guo Y., 2019, MNRAS, 485, 382
- Chan et al. (2018) Chan T. K., Kereš D., Wetzel A., Hopkins P. F., Faucher-Giguère C. A., El-Badry K., Garrison-Kimmel S., Boylan-Kolchin M., 2018, MNRAS, 478, 906
- Chilingarian et al. (2019) Chilingarian I. V., Afanasiev A. V., Grishin K. A., Fabricant D., Moran S., 2019, arXiv e-prints, p. arXiv:1901.05489
- D’Onghia et al. (2010) D’Onghia E., Springel V., Hernquist L., Keres D., 2010, ApJ, 709, 1138
- Dalcanton et al. (1997) Dalcanton J. J., Spergel D. N., Gunn J. E., Schmidt M., Schneider D. P., 1997, AJ, 114, 635
- Danieli et al. (2019) Danieli S., van Dokkum P., Conroy C., Abraham R., Romanowsky A. J., 2019, ApJ, 874, L12
- Davis et al. (1985) Davis M., Efstathiou G., Frenk C. S., White S. D. M., 1985, ApJ, 292, 371
- Di Cintio et al. (2017) Di Cintio A., Brook C. B., Dutton A. A., Macciò A. V., Obreja A., Dekel A., 2017, MNRAS, 466, L1
- Dolag et al. (2009) Dolag K., Borgani S., Murante G., Springel V., 2009, MNRAS, 399, 497
- Eigenthaler et al. (2018) Eigenthaler P., et al., 2018, The Astrophysical Journal, 855, 142
- Errani et al. (2015) Errani R., Penarrubia J., Tormen G., 2015, MNRAS, 449, L46
- Fattahi et al. (2018) Fattahi A., Navarro J. F., Frenk C. S., Oman K. A., Sawala T., Schaller M., 2018, MNRAS, 476, 3816
- Fattahi et al. (2019) Fattahi A., Navarro J. F., Frenk C. S., 2019, arXiv e-prints, p. arXiv:1907.02463
- Fensch et al. (2019) Fensch J., et al., 2019, A&A, 625, A77
- Ferré-Mateu et al. (2018) Ferré-Mateu A., et al., 2018, MNRAS, 479, 4891
- Frings et al. (2017) Frings J., Macciò A., Buck T., Penzo C., Dutton A., Blank M., Obreja A., 2017, Monthly Notices of the Royal Astronomical Society, 472, 3378
- Galaz et al. (2011) Galaz G., Herrera-Camus R., Garcia-Lambas D., Padilla N., 2011, ApJ, 728, 74
- Gallazzi et al. (2005) Gallazzi A., Charlot S., Brinchmann J., White S. D. M., Tremonti C. A., 2005, MNRAS, 362, 41
- Garrison-Kimmel et al. (2017) Garrison-Kimmel S., et al., 2017, MNRAS, 471, 1709
- Genel et al. (2014) Genel S., et al., 2014, MNRAS, 445, 175
- Greco et al. (2018) Greco J. P., Goulding A. D., Greene J. E., Strauss M. A., Huang S., Kim J. H., Komiyama Y., 2018, ApJ, 866, 112
- Gu et al. (2018) Gu M., et al., 2018, ApJ, 859, 37
- Impey et al. (1988) Impey C., Bothun G., Malin D., 1988, ApJ, 330, 634
- Jiang et al. (2019) Jiang F., Dekel A., Freundlich J., Romanowsky A. J., Dutton A. A., Macciò A. V., Di Cintio A., 2019, MNRAS, 487, 5272
- Kadowaki et al. (2017) Kadowaki J., Zaritsky D., Donnerstein R. L., 2017, ApJ, 838, L21
- Kirby et al. (2013) Kirby E. N., Cohen J. G., Guhathakurta P., Cheng L., Bullock J. S., Gallazzi A., 2013, ApJ, 779, 102
- Koda et al. (2015) Koda J., Yagi M., Yamanoi H., Komiyama Y., 2015, ApJ, 807, L2
- Lange et al. (2015) Lange R., et al., 2015, MNRAS, 447, 2603
- Laporte et al. (2019) Laporte C. F. P., Agnello A., Navarro J. F., 2019, MNRAS, 484, 245
- Lelli et al. (2016) Lelli F., McGaugh S. S., Schombert J. M., 2016, AJ, 152, 157
- Liao et al. (2019) Liao S., et al., 2019, MNRAS, 490, 5182
- Lim et al. (2018) Lim S., Peng E. W., Côté P., Sales L. V., den Brok M., Blakeslee J. P., Guhathakurta P., 2018, ApJ, 862, 82
- Liske et al. (2015) Liske J., et al., 2015, MNRAS, 452, 2087
- Liu et al. (2015) Liu C., et al., 2015, ApJ, 812, 34
- Ludlow et al. (2019) Ludlow A. D., Schaye J., Schaller M., Richings J., 2019, MNRAS, 488, L123
- Makarov et al. (2015) Makarov D. I., Sharina M. E., Karachentseva V. E., Karachentsev I. D., 2015, A&A, 581, A82
- Marinacci et al. (2018) Marinacci F., et al., 2018, MNRAS, 480, 5113
- Martin et al. (2018) Martin N. F., Collins M. L. M., Longeard N., Tollerud E., 2018, ApJ, 859, L5
- McConnachie et al. (2008) McConnachie A. W., et al., 2008, The Astrophysical Journal, 688, 1009
- McGaugh (2012) McGaugh S. S., 2012, AJ, 143, 40
- Mihos et al. (2015) Mihos J. C., et al., 2015, ApJ, 809, L21
- Muñoz et al. (2015) Muñoz R. P., et al., 2015, ApJ, 813, L15
- Naiman et al. (2018) Naiman J. P., et al., 2018, MNRAS, 477, 1206
- Navarro et al. (1996) Navarro J. F., Eke V. R., Frenk C. S., 1996, MNRAS, 283, L72
- Navarro et al. (1997) Navarro J. F., Frenk C. S., White S. D. M., 1997, ApJ, 490, 493
- Nelson et al. (2015) Nelson D., et al., 2015, Astronomy and Computing, 13, 12
- Nelson et al. (2018) Nelson D., et al., 2018, MNRAS, 475, 624
- Nelson et al. (2019) Nelson D., et al., 2019, Computational Astrophysics and Cosmology, 6, 2
- Pakmor & Springel (2013) Pakmor R., Springel V., 2013, MNRAS, 432, 176
- Pakmor et al. (2011) Pakmor R., Bauer A., Springel V., 2011, MNRAS, 418, 1392
- Paulino-Afonso et al. (2017) Paulino-Afonso A., Sobral D., Buitrago F., Afonso J., 2017, MNRAS, 465, 2717
- Peñarrubia et al. (2008) Peñarrubia J., Navarro J. F., McConnachie A. W., 2008, ApJ, 673, 226
- Peñarrubia et al. (2010) Peñarrubia J., Benson A. J., Walker M. G., Gilmore G., McConnachie A. W., Mayer L., 2010, MNRAS, 406, 1290
- Peng & Lim (2016) Peng E. W., Lim S., 2016, ApJ, 822, L31
- Pillepich et al. (2018a) Pillepich A., et al., 2018a, MNRAS, 473, 4077
- Pillepich et al. (2018b) Pillepich A., et al., 2018b, MNRAS, 475, 648
- Planck Collaboration et al. (2016) Planck Collaboration et al., 2016, A&A, 594, A13
- Pontzen & Governato (2012) Pontzen A., Governato F., 2012, MNRAS, 421, 3464
- Rodriguez-Gomez et al. (2015) Rodriguez-Gomez V., et al., 2015, MNRAS, 449, 49
- Román & Trujillo (2017) Román J., Trujillo I., 2017, MNRAS, 468, 4039
- Ruiz-Lara et al. (2018) Ruiz-Lara T., et al., 2018, MNRAS, 478, 2034
- Safarzadeh & Scannapieco (2017) Safarzadeh M., Scannapieco E., 2017, ApJ, 850, 99
- Sandage & Binggeli (1984) Sandage A., Binggeli B., 1984, AJ, 89, 919
- Sawala et al. (2015) Sawala T., et al., 2015, Monthly Notices of the Royal Astronomical Society, 448, 2941
- Sawala et al. (2016) Sawala T., et al., 2016, Monthly Notices of the Royal Astronomical Society, 456, 85
- Schaye et al. (2015) Schaye J., et al., 2015, MNRAS, 446, 521
- Somerville et al. (2018) Somerville R. S., et al., 2018, MNRAS, 473, 2714
- Springel (2010) Springel V., 2010, MNRAS, 401, 791
- Springel et al. (2001) Springel V., White S. D. M., Tormen G., Kauffmann G., 2001, MNRAS, 328, 726
- Springel et al. (2018) Springel V., et al., 2018, MNRAS, 475, 676
- Toloba et al. (2018) Toloba E., et al., 2018, ApJ, 856, L31
- Tomozeiu et al. (2016) Tomozeiu M., Mayer L., Quinn T., 2016, The Astrophysical Journal, 818, 193
- Torrealba et al. (2016) Torrealba G., Koposov S. E., Belokurov V., Irwin M., 2016, Monthly Notices of the Royal Astronomical Society, 459, 2370
- Torrealba et al. (2019) Torrealba G., et al., 2019, Monthly Notices of the Royal Astronomical Society, 488, 2743
- Tremmel et al. (2019) Tremmel M., Wright A. C., Brooks A. M., Munshi F., Nagai D., Quinn T. R., 2019, arXiv e-prints, p. arXiv:1908.05684
- Trujillo et al. (2019) Trujillo I., et al., 2019, MNRAS, 486, 1192
- Venhola et al. (2017) Venhola A., et al., 2017, A&A, 608, A142
- Vogelsberger et al. (2013) Vogelsberger M., Genel S., Sijacki D., Torrey P., Springel V., Hernquist L., 2013, MNRAS, 436, 3031
- Vogelsberger et al. (2014a) Vogelsberger M., et al., 2014a, MNRAS, 444, 1518
- Vogelsberger et al. (2014b) Vogelsberger M., et al., 2014b, Nature, 509, 177
- Weinberger et al. (2017) Weinberger R., et al., 2017, MNRAS, 465, 3291
- Wolf et al. (2010) Wolf J., Martinez G. D., Bullock J. S., Kaplinghat M., Geha M., Muñoz R. R., Simon J. D., Avedo F. F., 2010, MNRAS, 406, 1220
- Yagi et al. (2016) Yagi M., Koda J., Komiyama Y., Yamanoi H., 2016, ApJS, 225, 11
- Yun et al. (2019) Yun K., et al., 2019, Monthly Notices of the Royal Astronomical Society, 483, 1042
- Zaritsky (2017) Zaritsky D., 2017, MNRAS, 464, L110
- van Dokkum et al. (2015) van Dokkum P. G., et al., 2015, ApJ, 804, L26
- van Dokkum et al. (2016) van Dokkum P., et al., 2016, ApJ, 828, L6
- van Dokkum et al. (2017) van Dokkum P., et al., 2017, ApJ, 844, L11
- van Dokkum et al. (2018) van Dokkum P., et al., 2018, Nature, 555, 629
- van Dokkum et al. (2019a) van Dokkum P., Danieli S., Abraham R., Conroy C., Romanowsky A. J., 2019a, ApJ, 874, L5
- van Dokkum et al. (2019b) van Dokkum P., et al., 2019b, ApJ, 880, 91
- van Dokkum et al. (2019c) van Dokkum P., et al., 2019c, ApJ, 880, 91
- van den Bosch & Ogiya (2018) van den Bosch F. C., Ogiya G., 2018, MNRAS, 475, 4066
- van den Bosch et al. (2018) van den Bosch F. C., Ogiya G., Hahn O., Burkert A., 2018, MNRAS, 474, 3043
- van der Burg et al. (2016) van der Burg R. F. J., Muzzin A., Hoekstra H., 2016, A&A, 590, A20
- van der Burg et al. (2017) van der Burg R. F. J., et al., 2017, A&A, 607, A79
- van der Wel et al. (2014) van der Wel A., et al., 2014, ApJ, 788, 28