Efficient Real-Time Camera Based Estimation of Heart Rate and Its Variability
Abstract
Remote photo-plethysmography (rPPG) uses a remotely placed camera to estimating a person’s heart rate (HR). Similar to how heart rate can provide useful information about a person’s vital signs, insights about the underlying physio/psychological conditions can be obtained from heart rate variability (HRV). HRV is a measure of the fine fluctuations in the intervals between heart beats. However, this measure requires temporally locating heart beats with a high degree of precision. We introduce a refined and efficient real-time rPPG pipeline with novel filtering and motion suppression that not only estimates heart rate more accurately, but also extracts the pulse waveform to time heart beats and measure heart rate variability. This method requires no rPPG specific training and is able to operate in real-time. We validate our method on a self-recorded dataset under an idealized lab setting, and show state-of-the-art results on two public dataset with realistic conditions (VicarPPG and PURE).
1 Introduction
Human vital signs like heart rate, blood oxygen saturation and related physiological measures can be measured using a technique called photo-plethysmography (PPG). This technique involves optically monitoring light absorption in tissues that are associated with blood volume changes. Typically, this is done via a contact sensor attached to the skin surface [2]. Remote Photo-plethysmography (rPPG) detects the blood volume pulse remotely by tracking changes in the skin reflectance as observed by a camera [9, 31]. In this paper we present a novel framework for extracting heart rate (HR) and heart rate variability (HRV) from the face.
The process of rPPG essentially involves two steps: detecting and tracking the skin colour changes of the subject, and analysing this signal to compute measures like heart rate, heart rate variability and respiration rate. Recent advances in computer video, signal processing, and machine learning have improved the performances of rPPG techniques significantly [9]. Current state-of-the-art methods are able to leverage image processing by deep neural networks to robustly select skin pixels within an image and perform HR estimation [4, 22].
However, this reliance upon heavy machine learning (ML) processes has two primary drawbacks: (i) it necessitates rPPG specific training of the ML model, thereby requiring collection of large training sets; (ii) complex models can require significant computation time on CPUs and thus can potentially add a bottleneck in the pipeline and limit real-time utility. Since rPPG analysis is originally a signal processing task, the use of an end-to-end trainable system with no domain knowledge leaves room for improvement in efficiency (e.g., we know that pulse signal is embedded in average skin colour changes [31, 34, 35], but the ML system has to learn this). We introduce a simplified and efficient rPPG pipeline that performs the full rPPG analysis in real-time. This method achieves state-of-the-art results without needing any rPPG related training. This is achieved via extracting regions of interest robustly by 3D face modelling, and explicitly reducing the influence of head movement to filter the signal.
While heart rate is a useful output from a PPG/rPPG analysis, finer analysis of the obtained blood volume pulse (BVP) signal can yield further useful measures. One such measure is heart rate variability: an estimate of the variations in the time-intervals between individual heart beats. This measure has high utility in providing insights into physiological and psychological state of a person (stress levels, anxiety, etc.). While traditionally this measure is obtained based on observation over hours, short and ultra-short duration ( 5 mins) HRV are also being studied [20]. Our experiments focus on obtaining ultra-short HRV measure as a proof-of-concept/technology demonstrator for longer duration applications.
The computation of heart rate variability requires temporally locating heart beats with a high degree of accuracy. Unlike HR estimation, where errors in opposite directions average out, HRV analysis is sensitive to even small artefacts and all errors add up to strongly distort the final measurement. Thus, estimating HRV is a challenging task for rPPG and this has received relatively little focus in literature. Our method extracts a clean BVP signal from the input via a two step wide and narrow band frequency filter to accurately time heart beats and estimate heart rate variability.
Contributions
We make the following contributions in this work: (i) We present a refined and efficient rPPG pipeline that can estimate heart-rate with state-of-the-art accuracy from RGB webcams. This method has the advantage that it does not require any specific rPPG training and it can perform its analysis with real-time speeds. (ii) Our method is able to time individual heart beats in the estimated pulse signal to compute heart rate variability. This body of work has received little attention, and we set the first benchmarks on two publicly available datasets. (iii) We provide an in-depth HR and HRV estimation analysis of our method on a self-recorded dataset as well as publicly available datasets with realistic conditions (VicarPPG [28], PURE [24], MAHNOB-HCI [21]). We show state-of-the-art results on VicarPPG and PURE. This also surpasses a previous benchmark set by a deep learning based method on PURE.
2 Related Work
Signal processing based rPPG methods
Since the early work of Verkruysse et al. [31], who showed that heart rate could be measured from recordings from a consumer grade camera in ambient light, a large body of research has been conducted on the topic. Extensive reviews of these work can be found in [9, 19, 26]. Most published rPPG methods work either by applying skin detection on a certain area in each frame or by selecting one or multiple regions of interest and track their averages over time to generate colour signals. A general division can be made into methods that use blind source separation (ICA, PCA) [14, 15, 16] vs those that use a ‘fixed’ extraction scheme for obtaining the BVP signal [5, 12, 28, 29, 33]. The blind source separation methods require an additional selection step to extract the most informative BVP signal. To avoid this, we make use a ‘fixed’ extraction scheme in our method.
Among the ‘fixed’ methods, multiple stand out and serve as inspiration and foundation for this work. Tasli et al. [28] presented the first face modelling based signal extraction method and utilized detrending [27] based filtering to estimate BVP and heart rate. The CHROM [5] method use a ratio of chrominance signals which are obtained from RGB channels followed by a skin-tone standardization step. Li et al. [12] proposed an extra illumination rectification step using the colour of the background to counter illumination variations. The SAMC [29] method proposes an approach for BVP extraction in which regions of interest are dynamically chosen using self adaptive matrix completion. The Plane-orthogonal to skin (POS) [33] method improves on CHROM. It works by projecting RGB signals on a plane orthogonal to a normalized skin tone in normalized RGB space, and combines the resulting signals into a single signal containing the pulsatile information. We take inspiration from Tasli et al. [28] and further build upon POS [33]. We introduce additional signal refinement steps for accurate peak detection to further improve HR and HRV analysis.
Deep learning based rPPG methods
Most recent works have applied deep learning (DL) to extract either heart rate or the BVP directly from camera images. They rely on the ability of deep networks to learn which areas in the image correspond to heart rate. This way, no prior domain knowledge is incorporated and the system learns rPPG concepts from scratch. DeepPhys [4] is the first such end-to-end method to extract heart and breathing rate from videos. HR-Net [22] uses two successive convolutional neural networks [11] to first extracts a BVP from a sequence of images and then estimate the heart rate from it. Both show state-of-the-art performance on two public datasets and a number of private datasets. Our presented algorithm makes use of an active appearance model [30] to select regions of interest to extract a heart rate signal from. Due to this, no specific rPPG training is required while prior domain knowledge is more heavily replied upon.
HRV from PPG/rPPG
Some past methods have also attempted extracting heart rate variability from videos [1, 16, 25]. A good overview is provided by Rodriguez et al. [18]. Because of the way HRV is calculated, it is crucial that single beats are detected accurately with a high degree of accuracy. Methods that otherwise show good performance in extracting HR can be unsuitable for HRV analysis, since they may not provide beat locations. Rodriguez et al. [18] evaluate their baseline rPPG method for HRV estimation. Their method is based on bandpass filtering the green channel from regions of interest. However, their results are only reported on their own dataset, which makes direct comparison difficult. Our method also estimates heart rate variability by obtaining precise temporal beat locations from the filtered BVP signal.
3 Method
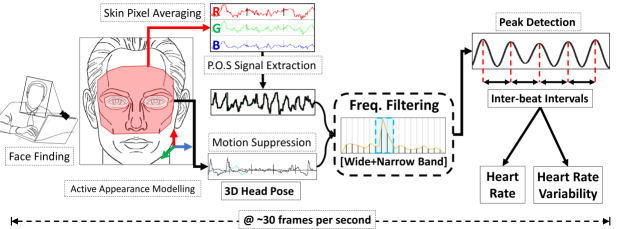
We present a method for extracting heart rate and heart rate variability from the face using only a consumer grade webcam. Figure 1 shows an overview of this method along with a summarized description.
3.1 Skin pixel selection
The first step in the pipeline includes face finding [32] and fitting an active appearance model (AAM) [30]. This AAM is then used to determine facial landmarks and head orientation. The landmarks are used to define a region of interest (RoI) which only contains pixels on the face belonging to skin. This allows us to robustly track the pixels in this RoI over the course of the whole video. Our RoI consists of the upper region of the face excluding the eyes. An example of this can be seen in Figure 1 and 3. The head orientation is used to measure and track the pitch, roll, and yaw angles of the head per frame. Across all pixels in the RoI, the averages for each colour channel (R,G,B) is computed and tracked (concatenated) to create three colour signals.
3.2 Signal extraction
The colour signals and the head orientation angles are tracked over a running window of 8.53 seconds. This window duration corresponds to 256 frames at 30 fps, or 512 frames at 60 fps. All signals are resampled using linear interpolation to counteract variations in frame rates of the input. They are resampled to either 30 or 60 fps, whichever is closer to the frame rate of the source video. Subsequently, the three colour signals from R, G and B channels are combined into a single rPPG signal using the POS method [33]. The POS method filters out intensity variations by projecting the R, G and B signals on a plane orthogonal to an experimentally determined normalized skin tone vector. The resulting 2-D signal is combined into a 1-D signal with one of the input signal dimensions being weighted by an alpha parameter that is the quotient of the standard deviations of each signal. This ensures that the resulting rPPG signal contains the maximum amount of pulsating component.
3.3 Signal filtering
Rhythmic motion noise suppression
A copy of the extracted rPPG signal as well as the head-orientation signals are converted to frequency domain using Fast Fourier Transform. The three resulting head-orientation spectra (one each of pitch, roll, and yaw) are combined into one via averaging. This is then subtracted from the raw rPPG spectrum after amplitude normalization. This way, the frequency components having a high value in the head-orientation spectrum are attenuated in the rPPG spectrum. Subsequently, the frequencies outside of the human heart rate range (0.7 - 4 Hz / 42 - 200 bpm) are removed from the spectra.
Wide & narrow band filtering
The highest frequency component inside the resulting spectrum is then used to determine the passband range of a narrow-bandpass filter with a bandwidth of 0.47 Hz. Such a filter can either be realized via inverse FFT or a high order FIR filter (e.g. ~50th order Butterworth). The selected filter is then applied to the original extracted rPPG signal to produce noise-free BVP.
3.4 Post processing
To prevent minor shifts in the locations of the crest of each beat over multiple overlapping running windows, the signals from each window are overlap added with earlier signals [5, 6, 33]. First, the filtered rPPG signal is normalized by subtracting its mean and dividing it by its standard deviation. During resampling of the signal, the number of samples to shift is determined based on the source and resampled frame rates. The signal is then shifted back in time accordingly and added to the previous/already overlapped signals. Older values are divided by the times they have been overlap added, to ensure all temporal locations lie in the same amplitude range. Over time, a cleaner rPPG signal is obtained from this.
3.5 Output calculation
Once a clean rPPG signal is obtained, we can perform peak detection on it to locate the individual beats in time in the signal. From the located beats, heart rate and heart rate variability can be calculated. To do this, we first extract the inter-beat-intervals (IBIs) from the signal, which are the time intervals between consecutive beats.
Heart rate calculation
Heart rate is calculated by averaging all IBIs over a time window, and computing the inverse of it. That is, , where is the mean of all inter-beat intervals that fall within the time window . The choice of this time window can be based on the user’s requirement (e.g. instantaneous HR, long-term HR).
Heart rate variability calculation
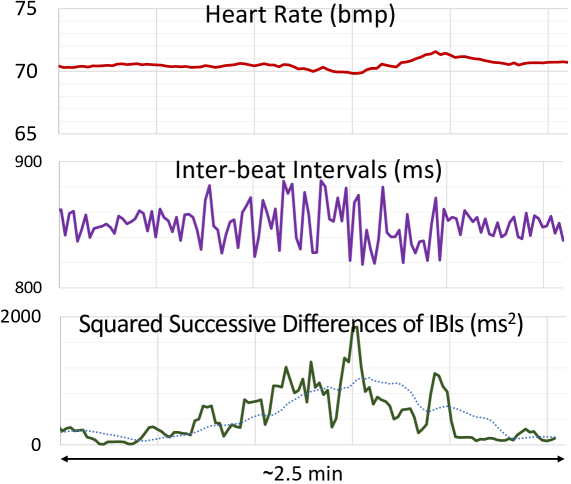
Multiple metrics can be computed to express the measure of heart rate variability in different units. In this work, we focus on one of the most popular time-domain metric for summarizing HRV called the root mean square of successive differences (RMSSD) [10, 13, 18], expressed in units of time. As the name suggests, this is computed by calculating the root mean square of time difference between adjacent IBIs:
| (1) |
where represents the th inter-beat interval, and represents the number of IBIs in the sequence. A graphical example of such HRV calculation is shown in Figure 2.
In addition, we also compute two frequency-domain metrics of HRV, simply known as Low-frequency (LF) and High-frequency (HF) band [13] (as well as a ratio of them), that are commonly used in rPPG HRV literature [1, 14, 18]. The LF and HF components are calculated using Welch’s power spectral density estimation. Since Welch’s method expects evenly sampled data, the IBIs are interpolated at a frequency of 2.5Hz and zero padded to the nearest power of two. The power of each band is calculated as total power in a region of the periodogram: the LF band from [0.04 to 0.15 Hz], and the HF band from [0.15 to 0.4 Hz]. Details about these metrics can be found in [20]. Both metrics are converted to normalized units by dividing them by the sum of LF and HF.
4 Experiments and Results
4.1 Datasets
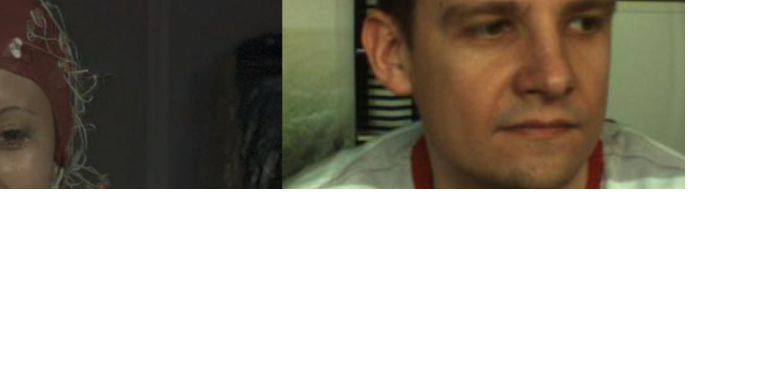
Some example frames from the datasets used in this paper can be seen in Figure 3.
StableSet rPPG dataset
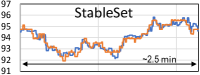
To make a proof-of-concept test of our proposed rPPG method, we recorded the StableSet rPPG dataset⋆⋆\star⋆⋆\starAs part of research work at the Human-Technology interaction group, Eindhoven University of Technology. We acknowledge and thank dr. Daniel Lakens and the research team for their valuable contributions.. This video dataset consists of 24 subjects recorded at 25 fps in 19201080 resolution using a RGB camera and a 1 KHz medical-grade electrocardiogram (ECG) device connected to the subjects. The subjects’ head movements were physically stabilised using a chin rest with the intention of minimizing motion induced noise in rPPG measurements. The subjects were recorded while watching emotion inducing video stimuli as well as playing the game of Tetris at varying difficulty levels. This was done with the intention of inducing HRV changes.
VicarVision rPPG dataset - VicarPPG
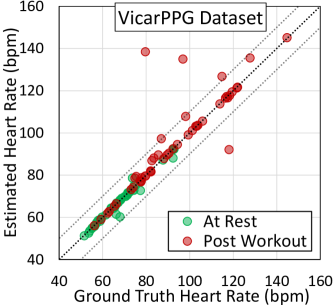
The VicarPPG dataset [28] consists of 20 video recordings of 10 unrestrained subjects sitting in front of a webcam (Logitech c920). The subjects were recorded under two conditions: at rest while exhibiting stable heart rates, and under a post-workout condition while exhibiting higher heart rates gradually reducing. The videos were originally recorded at 1280720 resolution with an uneven variable frame rate ranging from as low as ~5 fps up to 30 fps. The frames were later upsampled and interpolated to a fixed 30 fps frame rate video file. The ground truth was obtained via a finger pulse oximeter device (CMS50E).
Pulse Rate Detection Dataset - PURE
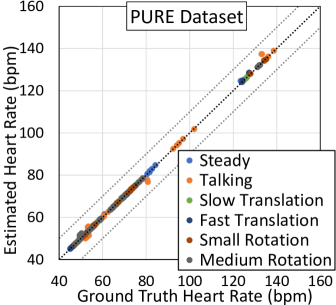
The PURE dataset [24] comprises of 60 videos of 10 subjects. Every subject is recorded under 6 different conditions with increasing degree of head movements including talking, slow and fast translation, small and large rotation. The videos were recoded at 30 fps in 640480 resolution with no compression (lossless), and the ground truth was obtained via a pulse oximeter (CMS50E).
MAHNOB-HCI Tagging rPPG Dataset
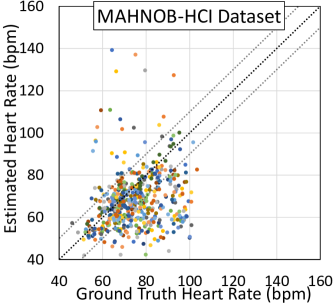
This dataset consists of 527 videos of 27 subjects, along with 256 Hz ECG ground truth recording. The videos were recoded at 61 fps in 780580 resolution and compressed to a high degree. To make our results comparable to previous work, we extract the same 30 second video duration from these videos (frames [306 - 2135]) and only analyse these.
4.2 Heart Rate Analysis
![[Uncaptioned image]](/html/1909.01206/assets/x8.png)

To assess the heart rate estimation accuracy of our method, we measure the deviation of the predicted heart rates from the ground truth in all the datasets. We express this deviation in terms of the mean absolute error (MAE) metric in beats per minute (bpm). This metric is the average of the absolute differences between predicted and true average heart rates obtained within a set time window. To make a fair comparison with other work, we set different time-window sizes for MAE computation per dataset to match the ones used in prior work: 8.5 secs, 15 secs, 30 secs, and 30 secs on StableSet, VicarPPG, PURE, and MAHNOB-HCI respectively. It should be noted that while shorter time-windows require more precise estimation, the choice of this window size did not affect our results significantly.
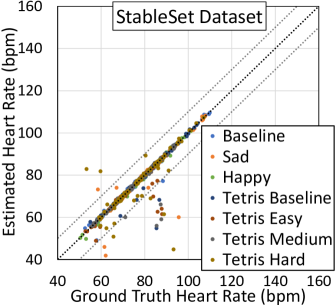
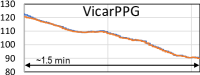
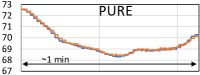
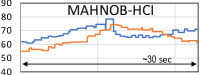
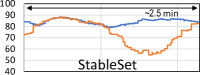
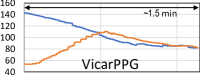
The summarised results of this heart rate analysis in comparison with other work can be in Table 1 and Figure 4, while some qualitative examples can be seen in Figure 5. On the StableSet, our proposed method obtains a low error rate of 1.02 bpm. This high accuracy can be attributed to the fact that subjects’ movements were physically stabilized via a chin-rest (see Figure 3).
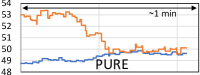
On the VicarPPG and the PURE datasets, our method outperforms all previous methods by a large margin. This is in spite of the subjects being unrestrained, exhibiting a wide range of changing heart rates, and performing a variety of large and small head movements. The very high accuracy of 0.3 bpm on the PURE dataset can be attributed to the fact that the videos were lossless encoded and had no compression noise. All the noise was caused was purely due to head movements, and this was the main failure point of other methods. Our method is able to filter out this motion noise significantly well. Conversely, on closer analysis, we found that the relatively lower average error on the VicarPPG dataset was primarily due to some segments in the videos having very low effective frame rates (~5 fps). This low frame rate approaches the Nyquist frequency for human heart rate analysis, which is a theoretical limitation that says sampling frequency must at least be twice the highest frequency to be measured. If videos severely suffering from such low frame rate artefacts are excluded (namely 06_WORKOUT, 08_WORKOUT), the error rate drops to 0.840.75 bpm.
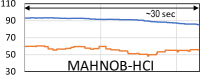
On the MAHNOB-HCI dataset, we see that similar to the majority of signal processing methods, our method does not achieve a very good accuracy. An interesting observation is that the accuracy produced by almost all methods is close to that of a dummy baseline method that blindly predicts the mean heart rate of the dataset (~71 bpm) for any input. Apart from [12], only the deep learning based methods perform better. This could be an indication that the high compression noise distorts the pulse information in the spatial averages of skin pixels. Deep learning based methods are able to somewhat overcomes this, perhaps by learning to detect and filter out the spatial ‘pattern’ of such compression noise. In addition, deep learning methods might also be implicitly learning to track ballistic head movements of the subjects since it is also caused by blood pulsations [3, 23]. In fact, the lowest error rate is obtained by the ballistic head movement based method described in [8]. This method does not rely on colour information at all, and hence its prediction is not affected by the underlying compression noise. This suggests a similar conclusion: simple spatial averaging of pixel values is not sufficient to estimate HR accurately in this dataset due to the high compression noise.
4.3 Heart Rate Variability Analysis
[\capbeside\thisfloatsetupcapbesideposition=left,bottom,capbesidewidth=0.48]figure[\FBwidth]
![[Uncaptioned image]](/html/1909.01206/assets/x21.png)
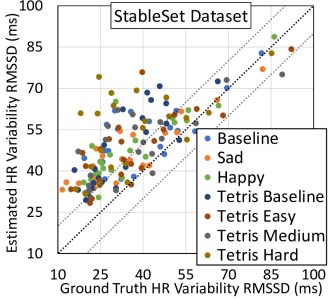
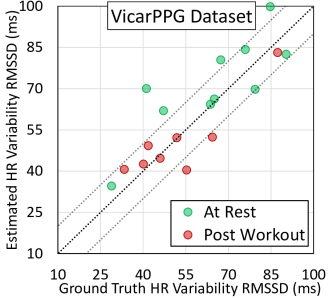
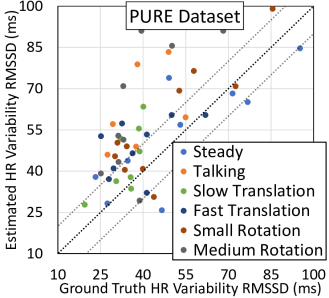
The task of assessing heart rate variability is greatly more noise-sensitive than estimating heart rate. To validate our method on this task, we compute mean absolute error between the time-domain HRV measure root mean square of successive differences (RMSSD) of the predicted heart beats in comparison the ground truth. In addition, we also report the mean absolute errors of frequency domain metrics: Low Frequency (LF), High Frequency (HF) (in normalized units), and their ratio LF/HF. We evaluate HRV on the StableSet, VicarPPG and PURE datasets, all of which contain videos longer than one minute in duration.
The results of this analysis can be seen in Table 2 and Figure 6. Similar to the results of HR analysis, our method predicts HRV with a good degree of accuracy on all three datasets over the length of the full video (1 min to 2.5 min). Based on HRV literature [20] and considering that the average human heart rate variability is in the range of [19-75] ms RMSSD, error rates less than ~20 ms RMSSD can be considered acceptably accurate.
4.4 In-depth Analysis
![[Uncaptioned image]](/html/1909.01206/assets/x22.png)
Since both the VicarPPG and PURE dataset have physiological and physical condition partitions, it is possible to perform a more in-depth analysis of the HR and HRV results from our experiments. These in-depth individual error rates per condition can be seen in Table 3.
VicarPPG Conditions
It can be noticed that while the proposed method is fairly accurate over all conditions, it estimates heart rates in the post-workout condition less accurately than in the rest condition. This can also be observed in the scatter plot of Figure 4b: while the overall average HR is accurate, there are more outliers in the higher HR region. On closer examination, we found the primary reason for this to be that a much larger number of video segments with a very low variable frame rate were present in the post-workout partition. Such low frame rate artefacts affect the estimation of higher HRs more severely as the Nyquist frequency requirement is also higher. Figure 5 also shows this for an example video from the VicarPPG dataset: the predicted HR follows the ground truth very well except for in the starting segment which has a higher heart rate (but low frame rate). If these videos are excluded (06_WORKOUT, 08_WORKOUT), the error rates drop significantly to 0.990.8 bpm, and so does the discrepancy between the two conditions.
PURE Conditions
The PURE dataset conditions are based on the amount and type of movement the subjects perform. As can be seen in Table 3, our method performs almost equally well in all movement conditions. In fact, even large rotations and fast translations of the face are handled just as good as the Steady condition. This is primarily due to the motion noise suppression step and the translation-robustness of the appearance modelling. We are still able to closely track our regions of interest through the movement. The worse performing condition is Talking. This is somewhat expected as moving the mouth and jaw deforms the face in a non-trivial manner which the appearance model is unable to adapt well to. In addition, repetitive muscle movements in the face during talking can interfere with the observed colour changes.
StableSet Conditions
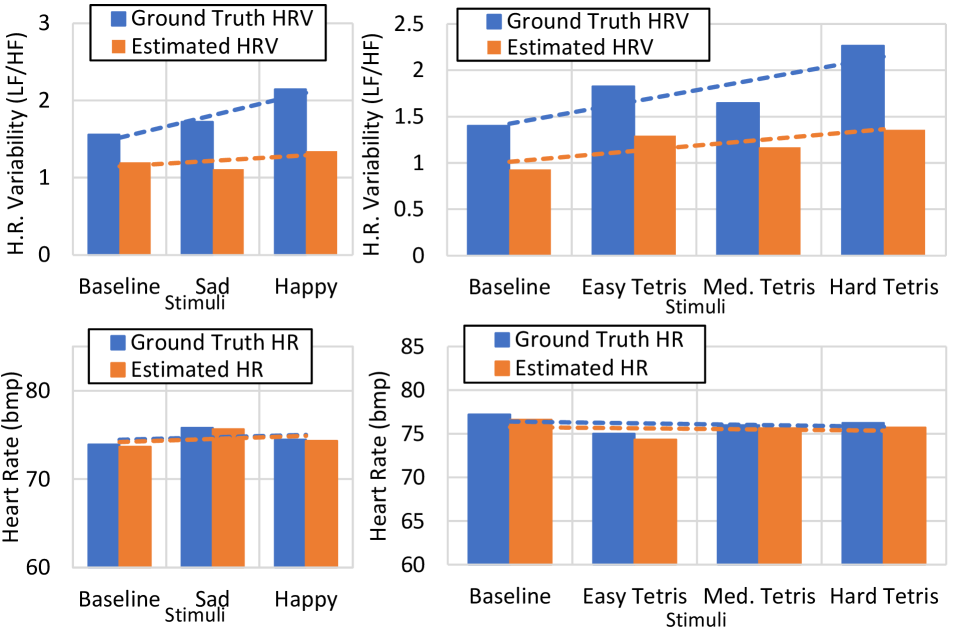
Unlike the previous datasets, the conditions in the StableSet do not relate to physical (or physically induced) differences, but to the type of stimuli applied to the subjects while being recorded. These include two emotion-inducing videos (sad and happy), and three stress-inducing Tetris-game playing tasks with increasing levels of difficulty.
The average HR and HRV estimations in comparison with the ground truth for each condition is shown in Figure 7. While no significant differences can be seen in the average heart rate measurements of the subjects under different conditions, their HRV measurements show some interesting results: the emotional videos and the higher difficulty Tetris games induce a higher HRV in the subjects when compared to the baseline. These results demonstrate the usefulness of heart rate variability in assessing the underlying psychological conditions: HRV is able to highlight differences by showing variations under different conditions while HR stays the same.
4.5 Processing Speeds
![[Uncaptioned image]](/html/1909.01206/assets/x24.png)
For real time application, processing speed is just as vital as prediction accuracy. The average CPU processing times of our method and its individual components are listed in Table 4 (on an Intel Xeon E5-1620). We see that the method is comfortably able to perform the full analysis with a good real-time speed for a video resolution of 640480. For videos at 1280720, the analysis speed drops to ~23 fps, which can still be considered real-time. The only bottleneck in the pipeline is the face finding and modelling step, which is modular w.r.t the rPPG pipeline. Swapping this for faster face and landmark detectors (e.g. [36] ~10 ms on CPU) can significantly improve overall processing speeds.
5 Discussion
We were able to obtain successful and promising results from our appearance modelling and signal-processing based rPPG method. The results show that this method is able to obtain high accuracies, surpassing the state-of-the-art on two public datasets (VicarPPG and PURE). We showed that small/large movements and rapidly changing heart rate conditions do not degrade performance. This can be attributed to the appearance modelling and noise suppression steps in the pipeline. Only non-trivial facial deformations (e.g. during talking) proved slightly challenging, but the method still produced sub-1 bpm error rates in these conditions.
This high accuracy was obtain while being efficient: the method’s computational costs were very low and the full pipeline could be executed in real-time on CPUs. This is in contrast to deep learning based methods where larger models that can potentially form computational bottlenecks in such pipelines. This efficiency is attained by taking advantage of our prior domain knowledge about the rPPG process, which the deep learning methods have to spend computational resources to learn and execute.
This high precision in estimating the pulse signal enables the measurement of heart rate variability (HRV), whose computation is sensitive to noise. HRV is a useful measure: As shown in the results, it can indicate underlying physio/psychological conditions (like stress) where HR is unable to show any difference.
A limitation of this method was observed in analysis of videos with very high compression rates. The resultant noise distorts the pulse signal almost completely when employing spatial averaging techniques. Deep learning methods like HR-CNN [22] have shown better results in this setting, while it fails to match our method in cases with lower compression. This could be because the network is able to learn the spatial patterns of this compression noise and filter it out, as well as track ballistic head movements and infer heart rate from it. In contrast, in lower compression cases, our prior domain knowledge assumptions perform more accurately. While this makes our method well suited for modern videos, deep learning might be better suited for processing archival videos, often subjected to higher compression.
6 Conclusion
This paper demonstrates a refined and efficient appearance modelling and signal processing based pipeline for remote photo-plethysmography. This method is able to estimate both heart rate and heart rate variability using cameras at real-time speeds. This method was validated on multiple public datasets and state-of-the-art results were obtained on VicarPPG and PURE datasets. We verify that this method is able to perform equally well under varying movement and physiological conditions. However, while the estimations are precise under ordinary video-compression conditions, high levels of compression noise degrades the accuracy.
References
- [1] K. Alghoul, S. Alharthi, H. Al Osman, and A. El Saddik. Heart rate variability extraction from videos signals: Ica vs. evm comparison. IEEE Access, 5:4711–4719, 2017.
- [2] J. Allen. Photoplethysmography and its application in clinical physiological measurement. Physiological measurement, 28(3):R1, 2007.
- [3] G. Balakrishnan, F. Durand, and J. Guttag. Detecting pulse from head motions in video. In Proceedings of the IEEE Conference on Computer Vision and Pattern Recognition, pages 3430–3437, 2013.
- [4] W. Chen and D. McDuff. Deepphys: Video-based physiological measurement using convolutional attention networks. In Proceedings of the European Conference on Computer Vision (ECCV), pages 349–365. Springer, Cham, 2018.
- [5] G. De Haan and V. Jeanne. Robust pulse rate from chrominance-based rppg. IEEE Transactions on Biomedical Engineering, 60(10):2878–2886, 2013.
- [6] G. De Haan and A. Van Leest. Improved motion robustness of remote-ppg by using the blood volume pulse signature. Physiological measurement, 35(9):1913, 2014.
- [7] H. Demirezen and C. E. Erdem. Remote photoplethysmography using nonlinear mode decomposition. In 2018 IEEE International Conference on Acoustics, Speech and Signal Processing (ICASSP), pages 1060–1064. IEEE, 2018.
- [8] M. A. Haque, R. Irani, K. Nasrollahi, and T. B. Moeslund. Heartbeat rate measurement from facial video. IEEE Intelligent Systems, 31(3):40–48, May 2016.
- [9] M. Hassan, A. S. Malik, D. Fofi, N. Saad, B. Karasfi, Y. S. Ali, and F. Mériaudeau. Heart rate estimation using facial video: A review. Biomedical Signal Processing and Control, 38:346–360, 2017.
- [10] R.-Y. Huang and L.-R. Dung. Measurement of heart rate variability using off-the-shelf smart phones. Biomedical engineering online, 15(1):11, 2016.
- [11] Y. LeCun and Y. Bengio. The handbook of brain theory and neural networks. chapter Convolutional Networks for Images, Speech, and Time Series, pages 255–258. MIT Press, Cambridge, MA, USA, 1998.
- [12] X. Li, J. Chen, G. Zhao, and M. Pietikainen. Remote heart rate measurement from face videos under realistic situations. In Proceedings of the IEEE conference on Computer Vision and Pattern Recognition (CVPR), pages 4264–4271, 2014.
- [13] M. Malik, J. T. Bigger, A. J. Camm, R. E. Kleiger, A. Malliani, A. J. Moss, and P. J. Schwartz. Heart rate variability: Standards of measurement, physiological interpretation, and clinical use. European heart journal, 17(3):354–381, 1996.
- [14] D. McDuff, S. Gontarek, and R. W. Picard. Improvements in remote cardiopulmonary measurement using a five band digital camera. IEEE Transactions on Biomedical Engineering, 61(10):2593–2601, 2014.
- [15] D. McDuff, S. Gontarek, and R. W. Picard. Remote detection of photoplethysmographic systolic and diastolic peaks using a digital camera. IEEE Transactions on Biomedical Engineering, 61(12):2948–2954, 2014.
- [16] M.-Z. Poh, D. J. McDuff, and R. W. Picard. Advancements in noncontact, multiparameter physiological measurements using a webcam. IEEE transactions on Biomedical Engineering, 58(1):7–11, 2010.
- [17] M.-Z. Poh, D. J. McDuff, and R. W. Picard. Non-contact, automated cardiac pulse measurements using video imaging and blind source separation. Optics express, 18(10):10762–10774, 2010.
- [18] A. M. Rodríguez and J. Ramos-Castro. Video pulse rate variability analysis in stationary and motion conditions. Biomedical engineering online, 17(1):11, 2018.
- [19] P. V. Rouast, M. T. Adam, R. Chiong, D. Cornforth, and E. Lux. Remote heart rate measurement using low-cost rgb face video: a technical literature review. Frontiers of Computer Science, 12(5):858–872, 2018.
- [20] F. Shaffer and J. Ginsberg. An overview of heart rate variability metrics and norms. Frontiers in Public Health, 5:258, 2017.
- [21] M. Soleymani, J. Lichtenauer, T. Pun, and M. Pantic. A multi-modal affective database for affect recognition and implicit tagging. Affective Computing, IEEE Transactions on, 3:1 – 1, 01 2012.
- [22] R. Spetlik, J. Cech, V. Franc, and J. Matas. Visual heart rate estimation with convolutional neural network. In British Machine Vision Conference (BMVC), 08 2018.
- [23] I. Starr, A. Rawson, H. Schroeder, and N. Joseph. Studies on the estimation of cardiac ouptut in man, and of abnormalities in cardiac function, from the heart’s recoil and the blood’s impacts; the ballistocardiogram. American Journal of Physiology-Legacy Content, 127(1):1–28, 1939.
- [24] R. Stricker, S. Müller, and H.-M. Gross. Non-contact video-based pulse rate measurement on a mobile service robot. In The 23rd IEEE International Symposium on Robot and Human Interactive Communication (Ro-Man), pages 1056–1062. IEEE, 2014.
- [25] Y. Sun, S. Hu, V. Azorin-Peris, R. Kalawsky, and S. E. Greenwald. Noncontact imaging photoplethysmography to effectively access pulse rate variability. Journal of biomedical optics, 18(6):061205, 2012.
- [26] Y. Sun and N. Thakor. Photoplethysmography revisited: from contact to noncontact, from point to imaging. IEEE Transactions on Biomedical Engineering, 63(3):463–477, 2015.
- [27] M. P. Tarvainen, P. O. Ranta-Aho, and P. A. Karjalainen. An advanced detrending method with application to hrv analysis. IEEE Transactions on Biomedical Engineering, 49(2):172–175, 2002.
- [28] H. E. Tasli, A. Gudi, and M. den Uyl. Remote ppg based vital sign measurement using adaptive facial regions. In 2014 IEEE International Conference on Image Processing (ICIP), pages 1410–1414. IEEE, 2014.
- [29] S. Tulyakov, X. Alameda-Pineda, E. Ricci, L. Yin, J. F. Cohn, and N. Sebe. Self-adaptive matrix completion for heart rate estimation from face videos under realistic conditions. In Proceedings of the IEEE Conference on Computer Vision and Pattern Recognition (CVPR), pages 2396–2404, 2016.
- [30] H. Van Kuilenburg, M. Wiering, and M. Den Uyl. A model based method for automatic facial expression recognition. In European Conference on Machine Learning, pages 194–205. Springer, 2005.
- [31] W. Verkruysse, L. O. Svaasand, and J. S. Nelson. Remote plethysmographic imaging using ambient light. Optics express, 16(26):21434–21445, 2008.
- [32] P. Viola and M. Jones. Rapid object detection using a boosted cascade of simple features. In Proceedings of the 2001 IEEE Computer Society Conference on Computer Vision and Pattern Recognition (CVPR), volume 1, Dec 2001.
- [33] W. Wang, A. C. den Brinker, S. Stuijk, and G. de Haan. Algorithmic principles of remote ppg. IEEE Transactions on Biomedical Engineering, 64(7):1479–1491, 2016.
- [34] H.-Y. Wu, M. Rubinstein, E. Shih, J. Guttag, F. Durand, and W. T. Freeman. Eulerian video magnification for revealing subtle changes in the world. ACM Transactions on Graphics (Proc. SIGGRAPH), 31(4), 2012.
- [35] Y. Zhang, S. L. Pintea, and J. C. Van Gemert. Video acceleration magnification. In Proceedings of the IEEE Conference on Computer Vision and Pattern Recognition, pages 529–537, 2017.
- [36] Z. Zhang, P. Luo, C. C. Loy, and X. Tang. Facial landmark detection by deep multi-task learning. In European conference on computer vision, pages 94–108. Springer, 2014.