CGC-Net: Cell Graph Convolutional Network for Grading of Colorectal Cancer Histology Images
Abstract
Colorectal cancer (CRC) grading is typically carried out by assessing the degree of gland formation within histology images. To do this, it is important to consider the overall tissue micro-environment by assessing the cell-level information along with the morphology of the gland. However, current automated methods for CRC grading typically utilise small image patches and therefore fail to incorporate the entire tissue micro-architecture for grading purposes. To overcome the challenges of CRC grading, we present a novel cell-graph convolutional neural network (CGC-Net) that converts each large histology image into a graph, where each node is represented by a nucleus within the original image and cellular interactions are denoted as edges between these nodes according to node similarity. The CGC-Net utilises nuclear appearance features in addition to the spatial location of nodes to further boost the performance of the algorithm. To enable nodes to fuse multi-scale information, we introduce Adaptive GraphSage, which is a graph convolution technique that combines multi-level features in a data-driven way. Furthermore, to deal with redundancy in the graph, we propose a sampling technique that removes nodes in areas of dense nuclear activity. We show that modeling the image as a graph enables us to effectively consider a much larger image (around 16 larger) than traditional patch-based approaches and model the complex structure of the tissue micro-environment. We construct cell graphs with an average of over 3,000 nodes on a large CRC histology image dataset and report state-of-the-art results as compared to recent patch-based as well as contextual patch-based techniques, demonstrating the effectiveness of our method.
![[Uncaptioned image]](/html/1909.01068/assets/top2-min.png)
1 Introduction
Colorectal cancer (CRC) is one of the most common cancers worldwide. According to the Global Cancer Statistics 2018, CRC is the third most commonly occurring cancer among men and women and is the second most common cause of cancer related mortality [5]. Among CRC cases, more than of them are colorectal adenocarcinomas (CRA). Based on the degree of glandular formation, CRA can be divided into low-grade and high-grade cancer, whereby low-grade CRA contains well/moderately differentiated adenocarcinomas and high-grade CRA contains poorly differentiated/undifferentiated adenocarcinomas [24]. Grading CRA is a crucial task due to its fundamental role in deciding on an appropriate follow-up treatment and is also indicative of overall patient outcome [9].
There has been a recent surge in interest for digital pathology, where tissue samples are digitised with a scanner to create whole slide images (WSIs), enabling efficient storage and management of the specimens. WSIs are stored in a multi-resolution format, where at the highest resolution they can be up to 150,000100,000 pixels in size and contain hundreds of thousands of cells. The rise of digital pathology has led to the development of computational techniques for automatic quantification and assessment of the tissue, helping reduce the inter-observer variability between pathologists. Furthermore, digital signatures within the tissue can be used to assist with cancer diagnosis and to enable prediction of cancer prognosis and clinical outcome, providing motivation for the use of computational pathology within routine clinical practice. Recently, several automatic methods have been proposed to grade or classify different cancers including breast, colon and lung cancer [1, 10, 22]. To cope with the very large size of WSIs, the general framework of these methods consists of two steps: patch-based image classification followed by aggregation of patch based classification at the slide level. First, the WSI is divided into small image patches, where each patch is processed independently. Then, all predictions are combined to obtain the final decision.
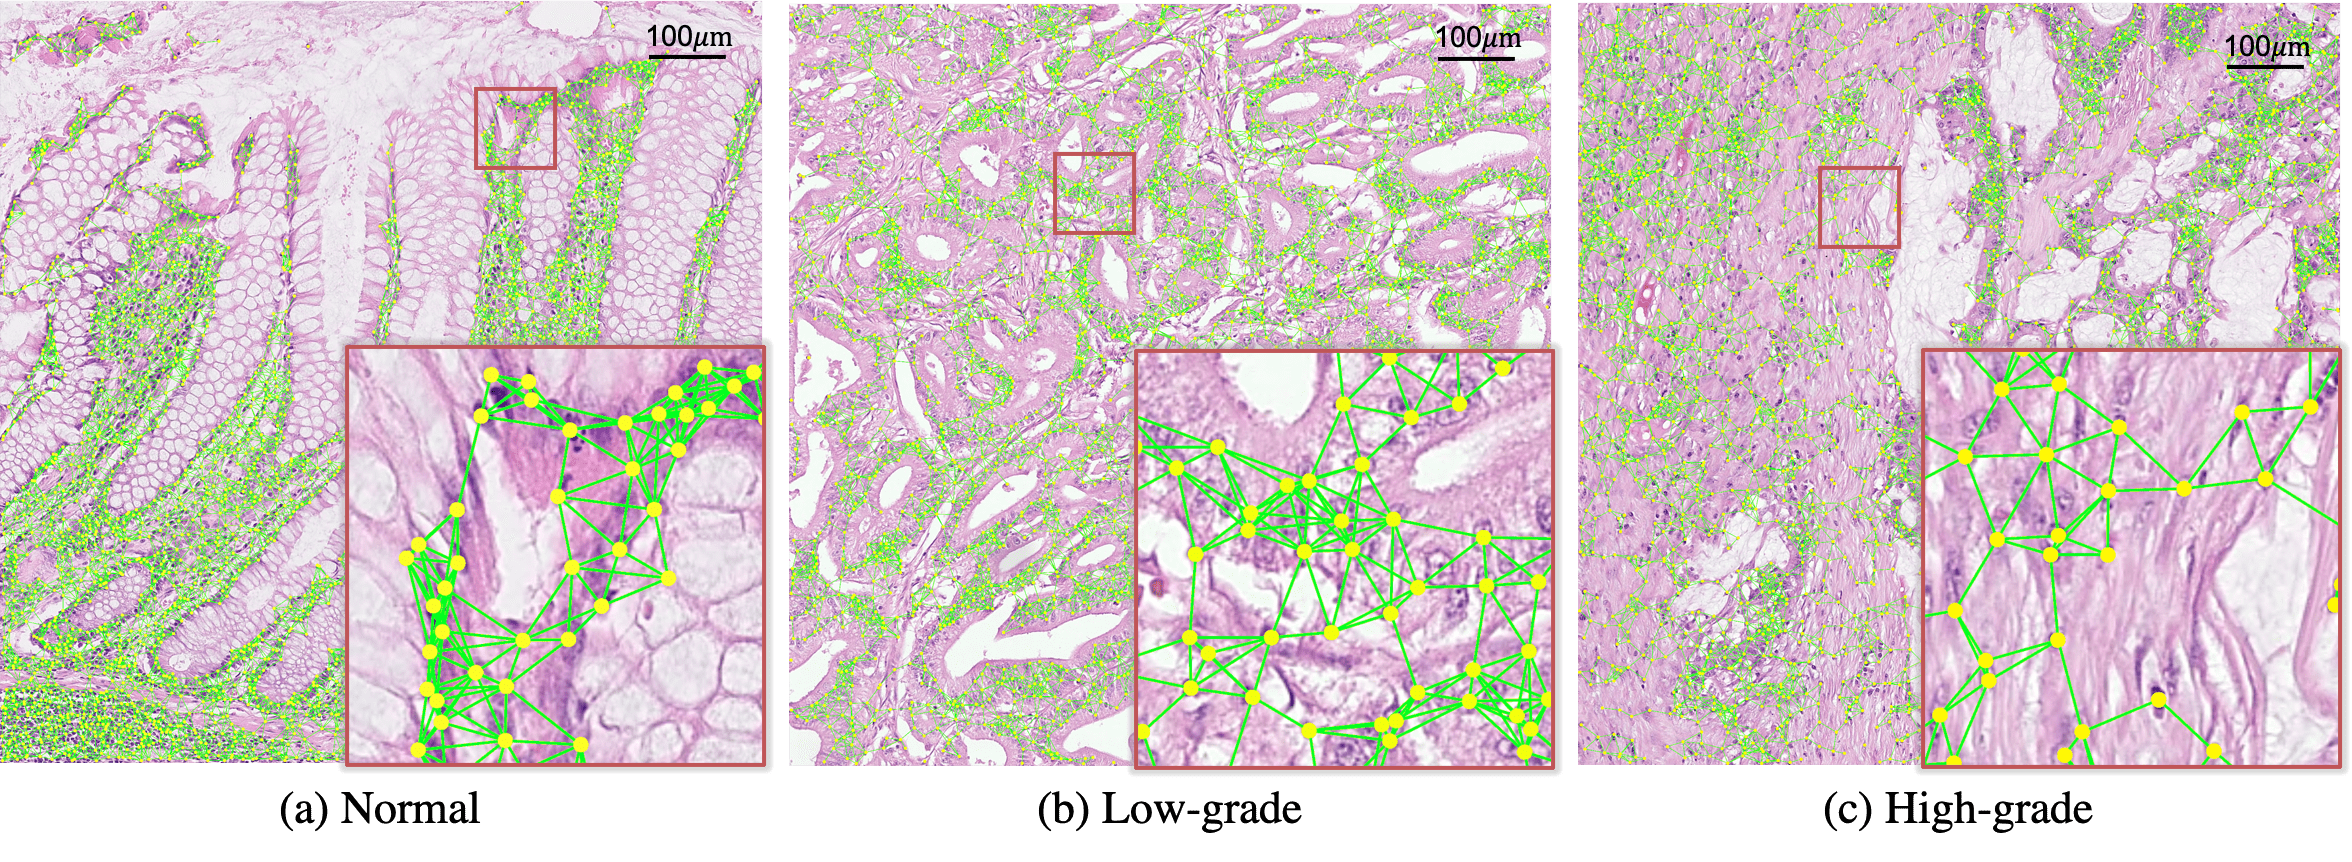
There are two main drawbacks faced by patch based approaches: First, there is an inherent trade-off between the resolution of each image patch and the context provided. The favourable size for each image patch is data-dependent. For example, in CRA, the grade of cancer is determined by assessing the degree of glandular formation in the tumour. However, the variation in glandular morphology and size leads to a difficulty in defining an appropriate image patch size. Within Figure 2, (a) shows a normal case where the glands have a clear tubular structure. On the other hand, (b) and (c) show cancerous cases where typical glandular appearance is less evident. Given a set resolution, the maximum image size that can be used is limited by the memory of the GPU. An alternate strategy is to use a lower resolution, which enables the same size patch to provide more context, but at the same time will lose cell-level information that may be diagnostically important. Second, due to the biases present within the features learned by a convolutional neural network (CNN), features extracted from each image patch may lack an interpretable correspondence to the tissue morphology and glandular structure.
A way to address the above drawbacks is to model nuclear features along with their cellular interactions in the form of a graph, which accounts for both cell-level information and the overal tissue micro-architecture. A graph constructed from cells within a WSI contains many millions of nodes and edges and therefore contains diagnostically important information relating to the tissue micro-architecture that may not be visible by manual inspection. Recently, cell graphs using graph theory have been studied , in order to capture the functional organisation of cells [49]. Previous work computed predefined graph-based features for cancer diagnosis [13, 4, 3, 43, 28]. However, it remains unclear how to select and combine graph-level features to best represent the complex organisation of cells in different tissue components.
In this paper, we propose a novel and general framework called Cell Graph Convolutional Network (CGC-Net) for histology image classification, based on the recent development of graph convolutional neural networks, and demonstrate its effectiveness for grading of colorectal cancer histology images. A cell graph is directly constructed from an image, where the nuclei are regarded as the nodes and the potential cellular interactions as edges of the graph. To acquire accurate node features, we apply a nuclear segmentation network and extract appearance features based on the segmented foreground instances. Instead of computing predefined graph-level features from the cell graph, the proposed CGC-Net takes the entire graph as input to obtain a compact representation of the tissue micro-environment for cancer grading in an end-to-end manner. Within our proposed model, we introduce the Adaptive GraphSage as a new graph convolution module to enforce the fusion of multi-level node features in a data-driven manner, followed by the graph clustering module to coarsen the graph. We then employ the learned hierarchical features for graph-based classification. We would like to emphasize that it is non-trivial to construct a cell graph suitable for the graph convolutional network due to the large number of cells in a histology image. Therefore, a representative nuclei sampling strategy is proposed to reduce the number of nodes and edges according to the relative inter-node distance.
Overall, our main contributions can be summarized as follows:
-
•
The CGC-Net is the first network of its kind for cancer grading that bridges the gap between the deep learning framework and the conventional cell graph.
-
•
A general cell graph construction pipeline with a representative nuclei sampling strategy that utilizes nuclear appearance and spatial information.
-
•
The CGC-Net utilizes the nuclei rather than small patches as descriptors, where cluster visualization leads to better biological insight and interpretability.
-
•
A comprehensive study on a large colorectal cancer dataset. Results show the proposed CGC-Net outperforms other state-of-the-art methods.
2 Related Work
Cancer grading in histology images: In the literature, earlier methods relied on different hand-crafted feature extraction techniques, including nuclear appearance features (e.g. colour, texture and shape) [14, 15] and morphological features [51, 35] to distinguish between different grades of cancer. Recently, deep learning methods have been widely used in various cancer grading tasks for a variety of tissues, including: lung; breast and colorectal cancer [10, 44, 2]. Typically, the grading framework utilises a CNN for patch-level classification and then individual image patch predictions are combined to yield the overall result. Different strategies have been proposed to utilise contextual information to obtain a better prediction. for example, [19, 33] combined multi-resolution information in either image space or feature space, whereas [11] used an adaptive patch selection approach. In [42], the authors conducted a comprehensive study on multi-scale information fusion methods and proved that utilizing LSTM units to embed features with larger context results in a superior performance.
In the case of colorectal adnocarcinoma, Awan et al. [2] proposed a novel Best Alignment Metric (BAM) to measure glandular morphology for classification, highlighting the importance of the glands within colorectal cancer grading. As a prerequisite, the BAM metric relies on a good quality gland segmentation, which has been successfully explored in recent work [21]. Recently, Shaban et al. [41] proposed a context-aware network which uses an attention mechanism to aggregate information from larger contextual regions and outperforms other context-based methods as well as domain-oriented methods. However, despite some of the aforementioned methods incorporating additional context, they are still limited by a pre-defined patch size and do not necessarily incorporate the entire tissue micro-environment.
Cell graph: Cell graphs aim to model the relationship between different cells and the tissue micro-environment utilizing graph features [40, 47, 13]. Within a cell graph, the nuclei or cell clusters are regarded as vertices and the potential signal between them are regarded as the edges. Based on the assumption that adjacent cells are more likely to interact, the graph can be constructed via Delaunay triangulation [30] or the K-nearest-neighbour method [4]. After cell graph construction, the distribution of cell level features are converted into global features and combined with other predefined graph features to train a machine learning algorithm, e.g. SVM, Bayesian, and KNN [37]. Bilgin et al. [3], proposed the ECM-aware cell graph for bone tissue modeling and classification by incorporating colour information and assigning a colour label for each node. Aside from the task of cancer diagnosis, Sirinukunwattana et al. [43] leveraged of the cell-cell interaction between different cell types as tissue phenotypic signatures and used an unsupervised learning approach to group the different tissue types for distant metastasis estimation. All the above mentioned methods need to define and extract graph-level features for further classification or clustering.
Graph neural network: Earlier Graph neural network methods [20, 34, 39] utilise recurrent neural networks for neighbor information propagation. To reduce the expensive computation, recent work utilised the concept of convolution and proposed various Graph Convolutional Networks (GCNs), which can be divided into spectral-based GCN [6, 12, 31] and spatial-based GCN [36, 25]. Kipf and Welling [31] proposed a localised first-order approximation of spectral graph convolutions for scalable semi-supervised learning. GraphSage was proposed in [25], which introduces aggregation functions for message parsing and a batch-training strategy to improve the scalability of large graphs. To learn hierarchical features for better graph-level classification and to reduce the computational complexity, different graph pooling methods have been proposed to reduce the graph size [52, 18, 50]. Ying et al. [50] proposed the differential graph pooling method which utilises another graph convolution layer to generate the assignment matrix for each node. Xu et al. [48] proposed to leverage different neighborhood ranges adaptively for better feature representation. Recently, [29] attempted to model the relation-aware representation for cervical cell classification. However, no work has been done to utilise GCNs to model the tissue micro-environment.
3 Method
3.1 Graph Convolutional Network
Different from the conventional convolution which operates on the regular grid in the Euclidean space, the graph convolution extends the information aggregation to the non-Euclidean space to allow incorporation of irregular data structure.
A graph is defined as , which consists of a node set with d-dimensional node features for and edge set , where denotes an edge. An adjacency matrix has non-zero entry if . Let denote the hidden features in the -th layer for node , then its analogous neighborhood is . Here, we use for the input layer. A typical graph convolution operation can be written as:
| (1) |
where is a pre-defined aggregation function, is the learnable weight in the -th layer shared by all the nodes and is the non-linear function, where specifically we use ReLU in our experiments.
3.2 Cell Graph Construction
Constructing a meaningful graph which reflects the potential interactions between cells is a vital part of our analysis.
Each image is converted to a cell graph, where nodes are nuclear descriptors and edges are the potential interactions between cells.
In order to construct the graph, we complete the following steps: i) nuclear instance segmentation to extract node features; ii) representative node sampling to remove redundancy in the graph and iii) graph edge configuration to define potential cellular interactions.
Nuclear instance segmentation:
Precise nuclear instance segmentation leads to more reliable node features in the cell graph. Therefore, due to its high performance, we use CIA-Net [53] to accurately delineate the boundaries of each nucleus. CIA-net is a contour-aware network with two interacting branches that aggregate both contour and nuclear features for a superior result.
Cell nuclei feature extractor: The nuclear masks obtained via CIA-Net are used to extract nuclear shape and appearance features to strengthen the diagnostic capability of our graph-based approach for colorectal cancer grading. In order to select the most predictive nuclear descriptors, we first implemented a random forest model to classify nuclei as either epithelial, inflammatory or spindle-shaped and then utilised feature selection to choose the 16 most predictive features. We chose to select features that were predictive of the nuclear category because the features can subsequently help to indirectly encode the category of each nucleus. Here, we chose to keep the raw descriptors rather than the predicted categories because we assume that they may be more informative for predicting the grade of cancer. In addition, we incorporate the centroid coordinates and therefore in total use seventeen nuclear descriptors: mean nuclei intensity; average fore-/background difference; standard deviation of nuclei intensity; skewness of nuclei intensity; mean entropy of nuclei intensity; GLCM of dissimilarity; GLCM of homogeneity; GLCM of energy; GLCM of ASM; eccentricity; area, maximum length of axis; minimum length of axis; perimeter, solidity; orientation and centroid coordinates.
Representative nuclei sampling strategy: Utilizing all nuclei in the image as nodes within a graph is undesirable because of the following reasons: First, some regions are dense with many cells containing similar features and therefore it is unnecessary to incorporate them all within the graph. Second, some graphs contain a huge amount of nuclei and therefore utilizing them all within the graph is very computationally expensive.
To resolve this problem, we propose to sample -ratio of the representative nuclei, instead of using all of them. Specifically, we use the Farthest Point Sampling (FPS) method [16] to choose a subset of nuclei, where each nucleus has the farthest distance to the selected nuclei collection. Compared to random sampling, it effectively alleviates the problem of removing nuclei within sparse areas. Furthermore, to prevent over-fitting we sample -ratio of nuclei randomly and add them to the selected subset. We choose and in all experiments.
Graph edge configuration: In the cell graph, we define an edge as the potential interaction between two nuclei. We hypothesise that the cells with a smaller Euclidean distance are more likely to interact. To this end, we assign an edge between two nuclei if they are within a fixed distance from each other. Moreover, the maximum degree of each node is set to corresponding to its -nearest neighbors. Formally, the adjacency matrix can be written as follow:
| (2) |
denotes Euclidean distance.
3.3 Cell Graph Network Architecture
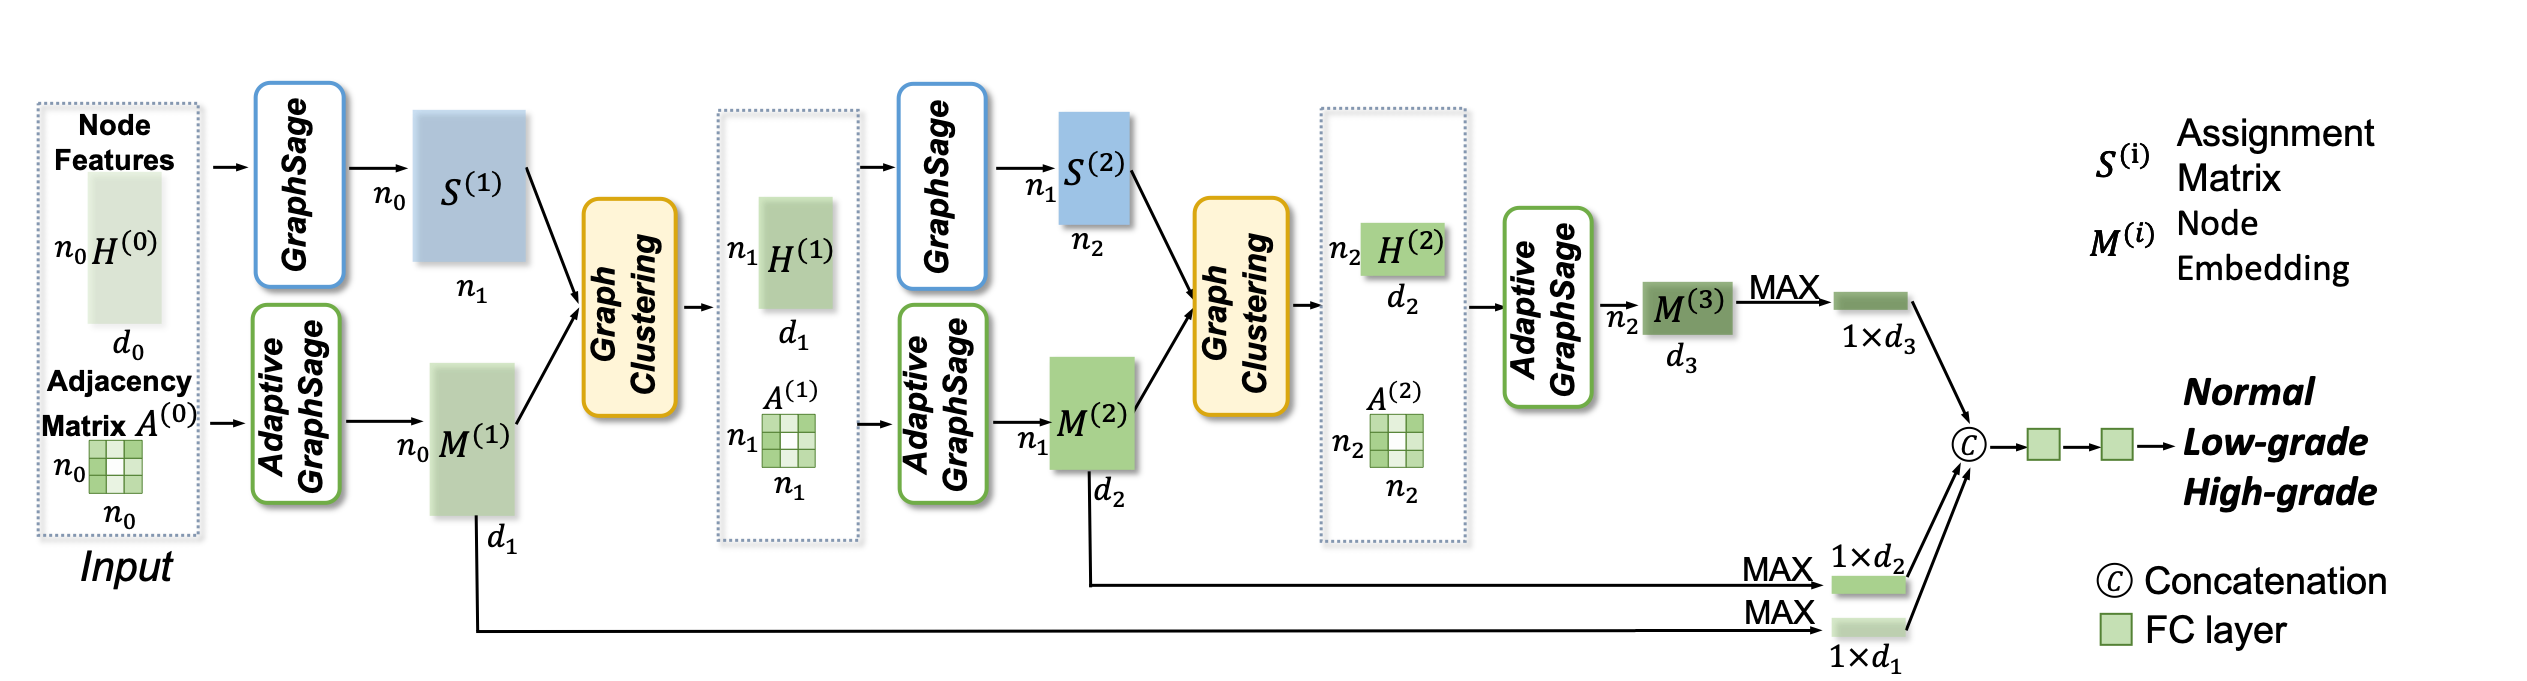
After constructing the cell graph, the task of colorectal cancer grading can be considered as a graph-level classification problem. We proposed the CGC-Net equipped with a stack of graph convolution and graph pooling modules. The graph convolution aggregates features from the nodes’ local neighbors, which in our case is the nuclei along with their interactions. To enable the nodes to fuse multi-scale features according to the contextual structure adaptively, we proposed Adaptive GraphSage which combines multi-level features in a data-driven way. After generating the node’s hidden embedding, the graph clustering operation coarsens the graph by assigning the nodes to different groups, which can be considered as an extension of the standard pooling operation.
Adaptive GraphSage: Given node features and edge information, various types of graph convolution can be used to learn the nodes’ hidden representation. In [25], it processes the predefined aggregation functions in Eq. 1 including mean, sum and max function. Then, it combines the multi-level node representation by concatenation and applies the operation times to capture the -hop neighbors’ information.
Although the node embedding after GraphSage contains multi-level neighborhood information, it cannot adaptively assign weights to the features according to the local topological structure around the target node. In other words, it can only fuse the multi-level embedding features in the same way for all nodes in that graph, which is not suitable for the cell graph because we want to capture the gland structure at various scales.
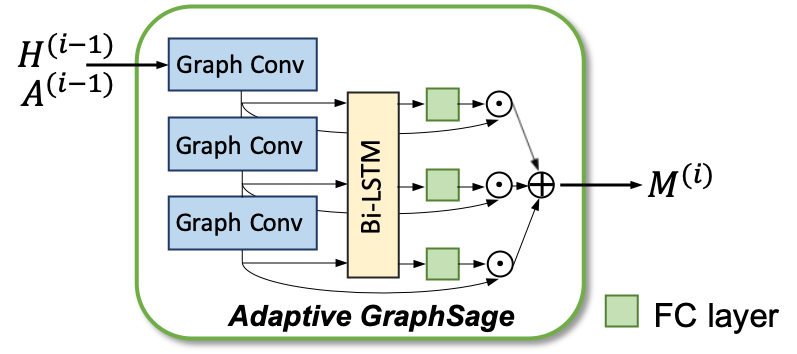
Inspired by [48], we propose a learnable pattern to aggregate multi-level embedding features for each node to address this issue. In particular, the proposed Adaptive GraphSage stacks graph convolutions, which means that each node can aggregate information from its -hop neighbors. We consider the intermediate outputs from graph convolutions as sequential inputs with dependent information and feed them into a bi-directional LSTM to acquire the forward and backward hidden embeddings and for each feature. Then for each layer , the concatenation of forward and backward hidden embeddings are passed through a linear mapping function followed by a Softmax to get the importance score . Finally, the representation of each node is obtained by performing a weighted sum of the multi-level features .
The proposed Adaptive GraphSage utilises an attention mechanism to enable multi-scale feature fusion.
This mechanism allows the network to generate an effective node representation according to its local structure, adaptively.
Graph clustering module:
After the input is passed through the Adaptive GraphSage, the node features contain the local contextual information.
However, the flat structure remains a drawback because the the hierarchical structure is lost when using global mean/max pooling to get the graph-level prediction.
Therefore, the clustering operation is necessary to extract more abstract features for hierarchical representation. We make use of the graph clustering method used by Ying et al. [50] that utilises another graph convolution for node assignment prediction in parallel with feature extraction.
To be concise, let denote the features for all nodes after -th graph clustering and denotes the adjacency matrix ( and are the input features and adjacency matrix). One Adaptive GraphSage is applied to generate the embedding matrix . Meanwhile, the nodes are passed through another GraphSage followed by a linear function to generate the assignment matrix . denotes the probability of each node being assigned to each cluster, e.g. denotes the probability of assigning the -th node to the -th cluster.
After we get the and , the clusters are considered as new nodes for the following layer, where the clusters’ features and corresponding adjacency matrix are:
| (3) |
| (4) |
Over-smooth problem: The literature reports that there exists the over-smooth problem for graph convolution networks [7, 32]. To alleviate this problem, we apply the re-weighted scheme that was originally proposed by Chen et al. [7]. Concretely, this scheme is defined as:
| (5) |
where in our experiment.
Combining Hierarchical features for graph-level classification: We utilise a max operation for the node embeddings at each stage to get a fixed-size representation. Then the concatenation of multi-level representations is fed into the linear layer to get the prediction for 3-class classification. The whole network is trained with cross-entropy loss.
3.4 Implementation
All the node features are normalised by subtracting the mean and dividing by its standard deviation channel-wise. To prevent over-fitting, Dropout [45] is used with during training. The CGC-Net is implemented using PyTorch [38] with the geometric deep learning package [17]. We use Adam optimization with an initial learning rate of . All models are trained for 30 epochs with a batch size of 40. The learning rate is dropped to after 10 and 20 epochs respectively and the weight decay is set to be . The model has 1.44M parameters. The training process takes 12 hours on a server with 4 NVIDIA TITAN V GPUs. It takes 6 minutes to process 10500 patches() on a single GPU.
4 Experiment
4.1 Dataset and Evaluation Metrics
Colorectal Cancer(CRC) dataset: The proposed method is evaluated on the CRC dataset [2], which consists of 139 images taken from WSIs with an average size of 45487520 at 20 magnification. The images are divided into normal, low grade and high grade based on the degree of gland differentiation. To conduct a fair comparison, we split the dataset the same way as [41] into three folds for cross-validation. We extract patches with a size of 17921792 pixels for cell graph construction, which is the same size that the context-aware learning method [41] used. Similar to [41], majority voting is used to generate the image-level prediction. To evaluate the performance, we use the average accuracy at both image-level (45487520) and patch-level (17921792).
Colorectal nuclear segmentation and phenotypes (CoNSeP) dataset: To train the nuclear segmentation network for graph construction, we use the CoNSeP dataset [23]. CoNSeP consists of 41 H&E stained images with 10001000 pixels at 40 magnification extracted from 16 CRA WSIs. Image patches were chosen to be representative of the tissue within CRA histology images and therefore we expect a method trained no this dataset to generalise well to the images used for graph construction.
4.2 Experimental Results
| Node Features | GC | Sampling | Patch Accuracy | Image Accuracy |
| Appearance & Spatial | GS | Fuse | 89.42 1.68 | 96.28 2.82 |
| Appearance & Spatial | AGS | Random | 88.11 2.47 | 93.25 1.94 |
| Appearance & Spatial | AGS | Farthest | 89.47 2.71 | 96.28 1.03 |
| Spatial | AGS | Fuse | 69.50 3.56 | 86.63 4.67 |
| Appearance | AGS | Fuse | 89.68 2.28 | 97.00 1.10 |
| Appearance & Spatial | AGS | Fuse | 91.60 1.26 | 97.00 1.10 |
| Method | Image Accuracy |
|---|---|
| BAM-1 [2] | 87.79 2.32 |
| BAM-2 [2] | 90.66 2.45 |
| Context - G [42] | 89.96 3.54 |
| ResNet50 [26] | 92.08 2.08 |
| MobileNet [27] | 92.78 2.74 |
| InceptionV3 [46] | 91.37 3.55 |
| Xception [8] | 92.09 0.98 |
| CA-CNN [41] | 95.70 3.04 |
| Ours | 97.00 1.10 |
4.2.1 Comparison with State-of-the-Art
To prove the effectiveness of CGC-Net, we compared the proposed method with recent state-of-the-art methods.
(1) Context-Aware-CNN (CA-CNN) [41]: the state-of-the-art context-aware learning framework for CRC grading which incorporates large contextual regions and aggregates information via patch-based feature-cubes.
(2) BAM [2]: a two-step method for CRC grading which first segments glands and then computes the Best Alignment Metric (BAM) for classification. Here, we report the results of BAM-1 and BAM-2. BAM-1 computes the average BAM and the BAM entropy, whereas BAM-2 additionally computes the Regularity Index.
(3) Context-G [42]: A context-aware approach which makes use of a shared CNN followed by a long-short term memory (LSTM) to aggregate multi-scale information.
(4) Patch-based models: Several State-of-the-arts networks including ResNet50 [26], MobileNet [27], InceptionV3 [46] and Xception [8] are trained small patches of size 224224.
It must be noted that the 3 folds were split in the same way as [41] and therefore we utilise the comparative results from the respective paper.
As can be seen in Table 2, our proposed CGC-Net outperforms all competing methods by a large margin with smaller standard deviation, highlighting that CGC-Net is well suited to the task of colorectal cancer grading by incorporating both nuclear and graph-level features.
4.2.2 Ablation Studies
Adaptive GraphSage:
Inspired by GraphSage [25] and JK-Net [48], we proposed a new graph convolution method for neighboring aggregation, named Adaptive GraphSage.
Compared with GraphSage [25], the proposed method aggregates information within a neighbourhood adaptively, which is of significance for the cell graph of CRC with irregular glandular structure.
Comparative results are shown in Table 1, where we observe that our proposed method achieves the best performance on both patch-level and image-level accuracy.
Node Features:
In order to test the effect of nucleus appearance features and spatial features, we construct the cell graph utilizing different features combination.
Results can be seen in Table 1.
Cell graph with only spatial features achieves for image-level accuracy, which demonstrates the tissue architecture is informative for CRC grading.
Meanwhile, the results of cell graph with nucleus appearance features are only below the cell graph with combined features on patch-level accuracy, which shows that the cellular heterogeneity in cancer region is a pivotal visual cue for cancer grading.
Graph equipped with combined features achieves the highest results, for patch accuracy and for image accuracy.
Though the image-level results are the same, utilizing complementary information from combined features has higher patch-level accuracy, which demostrates the patch predictions within one image are more consistent.
Nuclei sampling strategy:
As introduced in Section 3.2, to reduce the size of the cell graph and preserve the cell architecture information in the graph, we propose a representative nuclei sampling strategy.
Experiments of utilizing different sample strategy can be seen in Table 1, where Random, Farthest and Fuse denote the random sampling, farthest sampling and our proposed sampling method.
Compared with results from random sampling in the second row, using farthest sampling achieves improvement from to for the patch accuracy, as well as the image accuracy from to .
This is because the farthest sampling can preserve the glandular structures better.
In addition, the patch accuracy is further improved from to using our proposed sampling methods, which is because it either preserves the tissue structures or reflects the cell density to some extent, which can be considered as a trade-off between them.
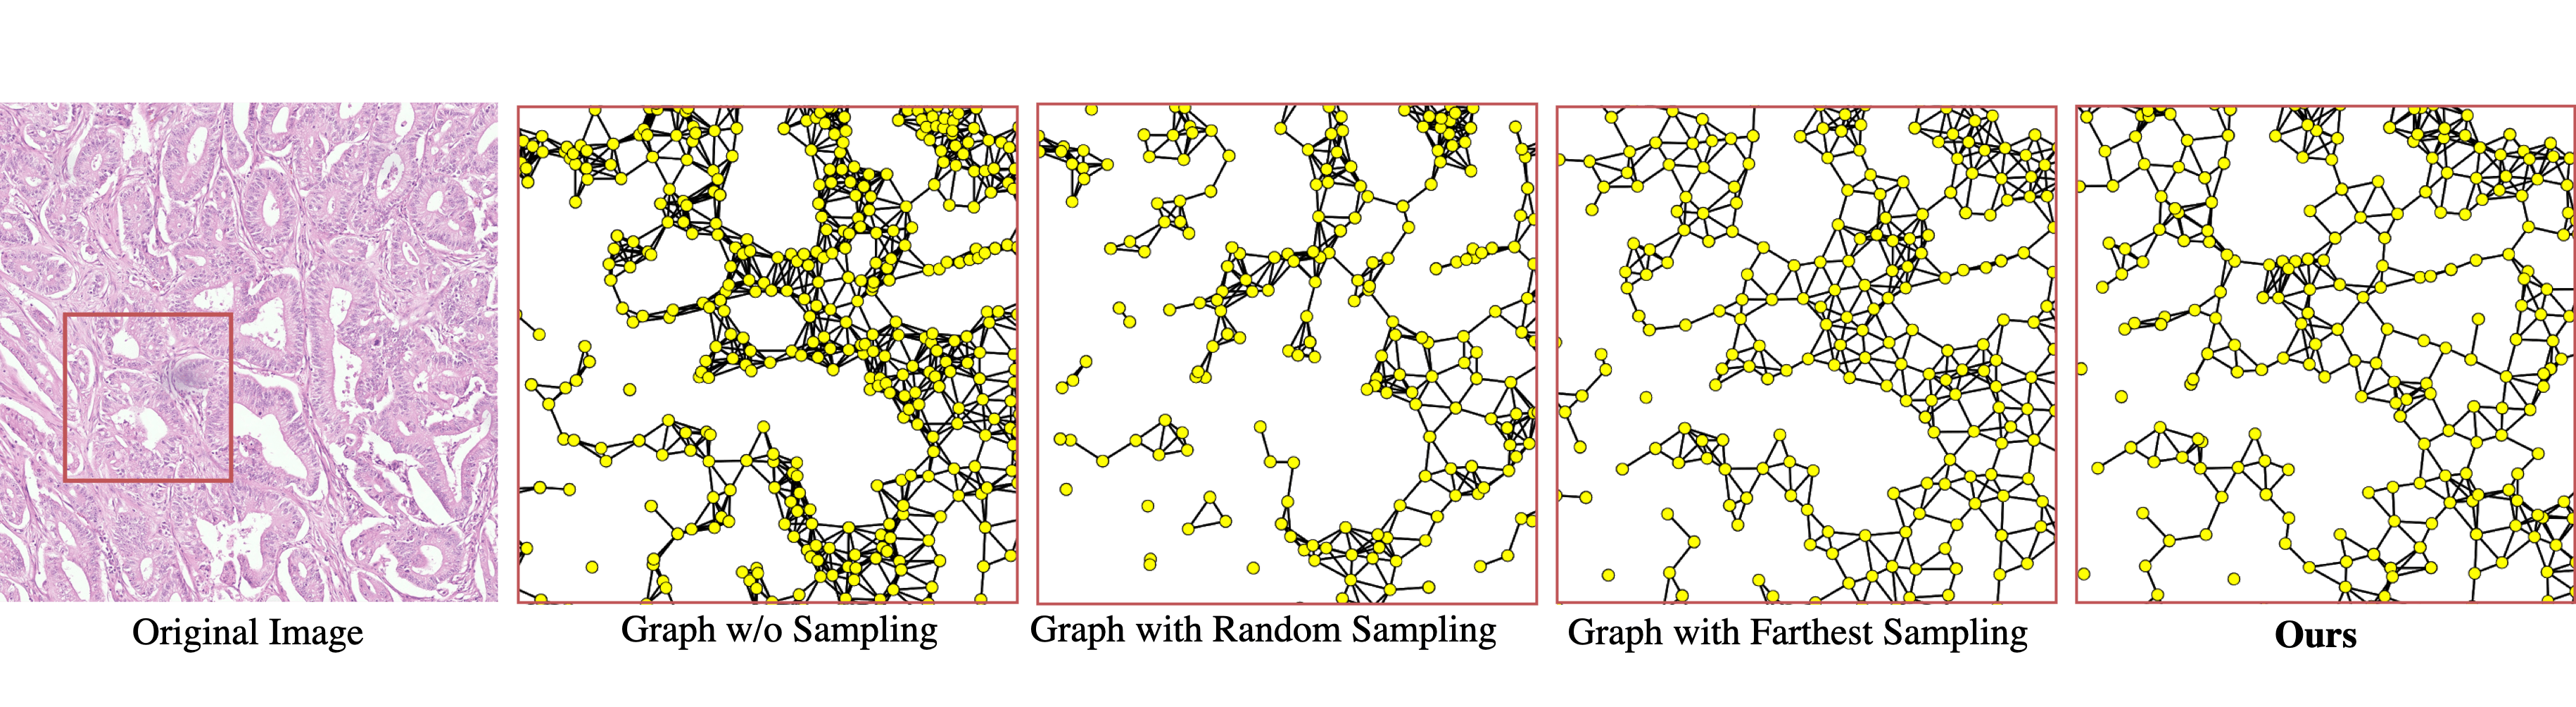
Visualisation of different cell graphs constructed by different sampling methods can be seen in Figure 5. Cells in the original graph are extremely dense with a large number of edges, which is neither feasible nor necessary for training. Random sampling leads to a large number of disjoint sub-graphs in the sparse cell regions and therefore does no appropriately model the micro-environment well. In addition, farthest sampling leads to a better tissue structure representation, especially in regions with very few cells, but does not reflect the cell density well, which could also be informative when grading the cancer. Lastly, our method effectively captures the structures and the cell density to some extent, which can better model the tissue micro-environment.
4.3 Cell Graph Visualisation
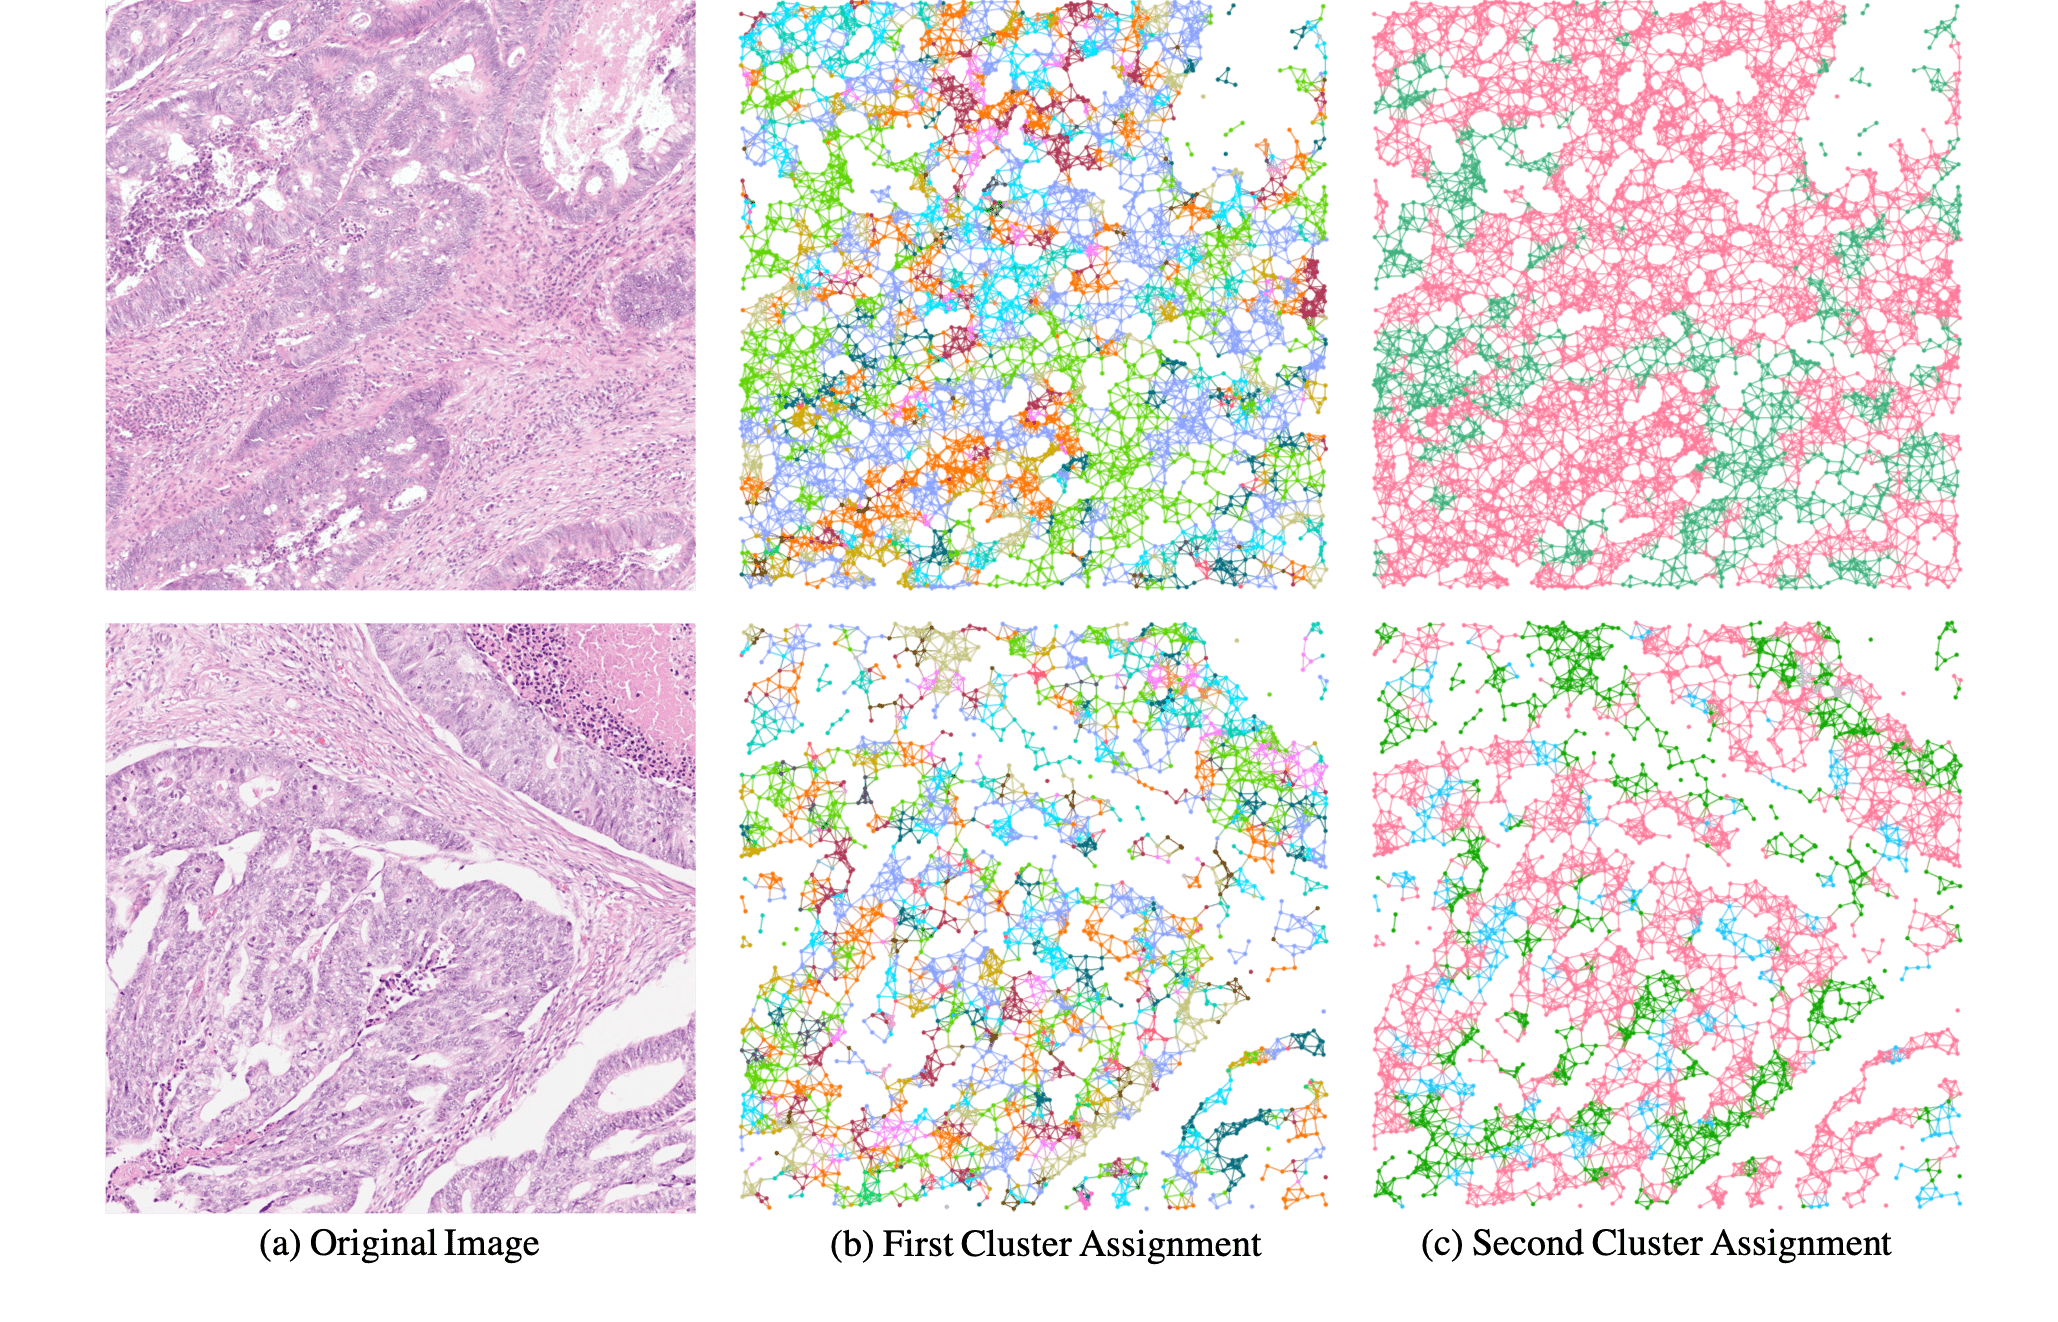
To fully understand our method, we visualise the cluster assignment of each node in the first and second layers of our proposed CGC-Net. Specifically, we assign each node to a cluster ID according to the maximum probability in the assignment matrix. For the second cluster assignment output, we map the cluster ID back to the original nodes. As can be seen in Figure 6, the first clustering operation groups cells with similar appearance into many small clusters, which shows the nodes have aggregated local contextual information. After the second clustering operation, we observe that fewer clusters are present within the graph and cells belonging to similar tissue structures tend to gather together. Specifically, we observe that nuclei within potential tumour regions are assigned to the red cluster and nuclei in normal tissue regions are assigned to the green cluster. Overall, it demonstrates the CGC-Net hierarchically aggregates information and captures both the local and the global features. Not only this, but the cluster visualisation gives us confidence that the features that the graph convolutional network are learning are biologically plausible.
5 Conclusion
In this paper, we propose a novel first-of-its-kind cell graph convolutional network for grading of colorectal cancer histology images, effectively aggregating information about cell morphology and tissue micro-architecture through a stack of graph convolution and clustering operations. Furthermore, we propose a general cell-graph construction pipeline with a representative nuclei sampling strategy to reduce computational redundancy. The proposed CGC-Net effectively models the tissue micro-environment by considering the appearance features of the cell nuclei along with their local interactions, outperforming current state-of-the-art methods on a large-scale colorectal cancer grading dataset.
Acknowledgments
This work was supported in part by the UK Medical Research Council grant# MR/P015476/1 and the Hong Kong Research Grants Council under General Research Fund (Project No. 14225616). The authors are also grateful to the Warwick Global Partnership Fund (GPF) for funding the collaboration between Warwick and CUHK.
References
- [1] Teresa Araújo, Guilherme Aresta, Eduardo Castro, José Rouco, Paulo Aguiar, Catarina Eloy, António Polónia, and Aurélio Campilho. Classification of breast cancer histology images using convolutional neural networks. PloS one, 12(6):1–14, 2017.
- [2] Ruqayya Awan, Korsuk Sirinukunwattana, David Epstein, Samuel Jefferyes, Uvais Qidwai, Zia Aftab, Imaad Mujeeb, David Snead, and Nasir Rajpoot. Glandular morphometrics for objective grading of colorectal adenocarcinoma histology images. Scientific reports, 7(1):16852, 2017.
- [3] Cemal Cagatay Bilgin, Peter Bullough, George E Plopper, and Bulent Yener. Ecm-aware cell-graph mining for bone tissue modeling and classification. Data Mining and Knowledge Discovery, 20(3):416–438, 2010.
- [4] Cemal Cagatay Bilgin, Cigdem Gunduz Demir, Chandandeep Nagi, and Bulent Yener. Cell-graph mining for breast tissue modeling and classification. In Engineering in Medicine and Biology Society. IEEE, 2007.
- [5] Freddie Bray, Jacques Ferlay, Isabelle Soerjomataram, Rebecca L Siegel, Lindsey A Torre, and Ahmedin Jemal. Global cancer statistics 2018: Globocan estimates of incidence and mortality worldwide for 36 cancers in 185 countries. CA: a cancer journal for clinicians, 68(6):394–424, 2018.
- [6] Joan Bruna, Wojciech Zaremba, Arthur Szlam, and Yann LeCun. Spectral networks and locally connected networks on graphs. In International Conference on Learning Representations, 2014.
- [7] Zhaomin Chen, Xiushen Wei, Peng Wang, and Yanwen Guo. Multi-label image recognition with graph convolutional networks. In Proceedings of the IEEE Conference on Computer Vision and Pattern Recognition, 2019.
- [8] François Chollet. Xception: Deep learning with depthwise separable convolutions. In Proceedings of the IEEE Conference on Computer Vision and Pattern Recognition, 2017.
- [9] Carolyn C Compton, L Peter Fielding, Lawrence J Burgart, Barbara Conley, Harry S Cooper, Stanley R Hamilton, M Elizabeth H Hammond, Donald E Henson, Robert VP Hutter, Raymond B Nagle, et al. Prognostic factors in colorectal cancer: College of american pathologists consensus statement 1999. Archives of Pathology & Laboratory Medicine, 124(7):979–994, 2000.
- [10] Nicolas Coudray, Paolo Santiago Ocampo, Theodore Sakellaropoulos, Navneet Narula, Matija Snuderl, David Fenyö, Andre L Moreira, Narges Razavian, and Aristotelis Tsirigos. Classification and mutation prediction from non–small cell lung cancer histopathology images using deep learning. Nature Medicine, 24(10):1559, 2018.
- [11] Angel Cruz-Roa, Hannah Gilmore, Ajay Basavanhally, Michael Feldman, Shridar Ganesan, Natalie Shih, John Tomaszewski, Anant Madabhushi, and Fabio González. High-throughput adaptive sampling for whole-slide histopathology image analysis (HASHI) via convolutional neural networks: Application to invasive breast cancer detection. PloS one, 13(5):1–23, 2018.
- [12] Michaël Defferrard, Xavier Bresson, and Pierre Vandergheynst. Convolutional Neural Networks on Graphs with Fast Localized Spectral Filtering. In Advances in Neural Information Processing Systems. Curran Associates, Inc., 2016.
- [13] Cigdem Demir, S Humayun Gultekin, and Bulent Yener. Augmented cell-graphs for automated cancer diagnosis. Bioinformatics, 21(suppl_2):ii7–ii12, 2005.
- [14] James Diamond, Neil H Anderson, Peter H Bartels, Rodolfo Montironi, and Peter W Hamilton. The use of morphological characteristics and texture analysis in the identification of tissue composition in prostatic neoplasia. Human Pathology, 35(9):1121–1131, 2004.
- [15] M Murat Dundar, Sunil Badve, Gokhan Bilgin, Vikas Raykar, Rohit Jain, Olcay Sertel, and Metin N Gurcan. Computerized classification of intraductal breast lesions using histopathological images. IEEE Transactions on Biomedical Engineering, 58(7):1977–1984, 2011.
- [16] Yuval Eldar, Michael Lindenbaum, Moshe Porat, and Yehoshua Y Zeevi. The farthest point strategy for progressive image sampling. IEEE Trans. Image Processing, 6(9):1305–1315, 1997.
- [17] Matthias Fey and Jan E. Lenssen. Fast graph representation learning with PyTorch Geometric. In ICLR Workshop on Representation Learning on Graphs and Manifolds, 2019.
- [18] Hongyang Gao and Shuiwang Ji. Graph U-nets. In International Conference on Machine Learning, 2019.
- [19] Baris Gecer, Selim Aksoy, Ezgi Mercan, Linda G Shapiro, Donald L Weaver, and Joann G Elmore. Detection and classification of cancer in whole slide breast histopathology images using deep convolutional networks. Pattern Recognition, 84:345–356, 2018.
- [20] Marco Gori, Gabriele Monfardini, and Franco Scarselli. A new model for learning in graph domains. In Proceedings. 2005 IEEE International Joint Conference on Neural Networks, 2005. IEEE, 2005.
- [21] Simon Graham, Hao Chen, Jevgenij Gamper, Qi Dou, Pheng-Ann Heng, David Snead, Yee Wah Tsang, and Nasir Rajpoot. MILD-Net: Minimal information loss dilated network for gland instance segmentation in colon histology images. Medical Image Analysis, 52:199–211, 2019.
- [22] Simon Graham, Muhammad Shaban, Talha Qaiser, Navid Alemi Koohbanani, Syed Ali Khurram, and Nasir Rajpoot. Classification of lung cancer histology images using patch-level summary statistics. In Medical Imaging 2018: Digital Pathology, 2018.
- [23] Simon Graham, Quoc Dang Vu, Shan E Ahmed Raza, Ayesha Azam, Yee Wah Tsang, Jin Tae Kwak, and Nasir Rajpoot. Hover-net: Simultaneous segmentation and classification of nuclei in multi-tissue histology images. arXiv preprint arXiv:1812.06499, 2019.
- [24] Stanley R Hamilton, Lauri A Aaltonen, et al. Pathology and genetics of tumours of the digestive system, volume 48. IARC press Lyon:, 2000.
- [25] William L. Hamilton, Zhitao Ying, and Jure Leskovec. Inductive representation learning on large graphs. In Advances in Neural Information Processing Systems, 2017.
- [26] Kaiming He, Xiangyu Zhang, Shaoqing Ren, and Jian Sun. Deep residual learning for image recognition. In Proceedings of the IEEE Conference on Computer Vision and Pattern Recognition, 2016.
- [27] Andrew G Howard, Menglong Zhu, Bo Chen, Dmitry Kalenichenko, Weijun Wang, Tobias Weyand, Marco Andreetto, and Hartwig Adam. Mobilenets: Efficient convolutional neural networks for mobile vision applications. arXiv preprint arXiv:1704.04861, 2017.
- [28] Sajid Javed, Muhammad Moazam Fraz, David Epstein, David Snead, and Nasir Rajpoot. Cellular community detection for tissue phenotyping in histology images. In Computational Pathology and Ophthalmic Medical Image Analysis. Springer, 2018.
- [29] Shi Jun, Wang Ruoyu, Zheng Yushan, Jiang Zhiguo, and Yu Lanlan. Graph convolutional networks for cervical cell classification. https://openreview.net/pdf?id=S1gX_tlc-S.
- [30] Stephen J Keenan, James Diamond, W Glenn McCluggage, Hoshang Bharucha, Deborah Thompson, Peter H Bartels, and Peter W Hamilton. An automated machine vision system for the histological grading of cervical intraepithelial neoplasia (cin). The Journal of Pathology, 192(3):351–362, 2000.
- [31] Thomas Kipf and Max Welling. Semi-supervised classification with graph convolutional networks. In In Proceedings of the International Conference on Learning Representations, 2017.
- [32] Qimai Li, Zhichao Han, and Xiao-Ming Wu. Deeper insights into graph convolutional networks for semi-supervised learning. In Thirty-Second AAAI Conference on Artificial Intelligence, 2018.
- [33] Yun Liu, Krishna Gadepalli, Mohammad Norouzi, George E Dahl, Timo Kohlberger, Aleksey Boyko, Subhashini Venugopalan, Aleksei Timofeev, Philip Q Nelson, Greg S Corrado, et al. Detecting cancer metastases on gigapixel pathology images. arXiv preprint arXiv:1703.02442, 2017.
- [34] Alessio Micheli. Neural network for graphs: A contextual constructive approach. IEEE Transactions on Neural Networks, 20(3):498–511, 2009.
- [35] Kien Nguyen, Bikash Sabata, and Anil K Jain. Prostate cancer grading: Gland segmentation and structural features. Pattern Recognition Letters, 33(7):951–961, 2012.
- [36] Mathias Niepert, Mohamed Ahmed, and Konstantin Kutzkov. Learning convolutional neural networks for graphs. In International Conference on Machine Learning, 2016.
- [37] Basak Oztan, Hui Kong, Metin N Gürcan, and Bülent Yener. Follicular lymphoma grading using cell-graphs and multi-scale feature analysis. In Medical Imaging 2012: Computer-Aided Diagnosis, 2012.
- [38] Adam Paszke, Sam Gross, Soumith Chintala, Gregory Chanan, Edward Yang, Zachary DeVito, Zeming Lin, Alban Desmaison, Luca Antiga, and Adam Lerer. Automatic differentiation in PyTorch. In NIPS Autodiff Workshop, 2017.
- [39] Franco Scarselli, Marco Gori, Ah Chung Tsoi, Markus Hagenbuchner, and Gabriele Monfardini. The graph neural network model. IEEE Transactions on Neural Networks, 20:61–80, 2009.
- [40] F Schnorrenberg, CS Pattichis, CN Schizas, K Kyriacou, and M Vassiliou. Computer-aided classification of breast cancer nuclei. Technology and Health Care, 4(2):147–161, 1996.
- [41] Muhammad Shaban, Ruqayya Awan, Muhammad Moazam Fraz, Ayesha Azam, David Snead, and Nasir M. Rajpoot. Context-Aware Convolutional Neural Network for Grading of Colorectal Cancer Histology Images. arXiv preprint arXiv:1907.09478, 2019.
- [42] Korsuk Sirinukunwattana, Nasullah Khalid Alham, Clare Verrill, and Jens Rittscher. Improving Whole Slide Segmentation Through Visual Context - A Systematic Study. In Medical Image Computing and Computer Assisted Intervention, Cham, 2018.
- [43] Korsuk Sirinukunwattana, David Snead, David Epstein, Zia Aftab, Imaad Mujeeb, Yee Wah Tsang, Ian Cree, and Nasir Rajpoot. Novel digital signatures of tissue phenotypes for predicting distant metastasis in colorectal cancer. Scientific Reports, 8(1):13692, 2018.
- [44] Fabio Alexandre Spanhol, Luiz S Oliveira, Caroline Petitjean, and Laurent Heutte. Breast cancer histopathological image classification using convolutional neural networks. In International Joint Conference on Neural Networks. IEEE, 2016.
- [45] Nitish Srivastava, Geoffrey Hinton, Alex Krizhevsky, Ilya Sutskever, and Ruslan Salakhutdinov. Dropout: a simple way to prevent neural networks from overfitting. The Journal of Machine Learning Research, 15(1):1929–1958, 2014.
- [46] Christian Szegedy, Wei Liu, Yangqing Jia, Pierre Sermanet, Scott Reed, Dragomir Anguelov, Dumitru Erhan, Vincent Vanhoucke, and Andrew Rabinovich. Going deeper with convolutions. In Proceedings of the IEEE Conference on Computer Vision and Pattern Recognition, 2015.
- [47] Barbara Weyn, Gert van de Wouwer, Samir Kumar-Singh, André van Daele, Paul Scheunders, Eric Van Marck, and Willem Jacob. Computer-assisted differential diagnosis of malignant mesothelioma based on syntactic structure analysis. Cytometry: The Journal of the International Society for Analytical Cytology, 35(1):23–29, 1999.
- [48] Keyulu Xu, Chengtao Li, Yonglong Tian, Tomohiro Sonobe, Ken-ichi Kawarabayashi, and Stefanie Jegelka. Representation learning on graphs with jumping knowledge networks. In International Conference on Machine Learning, 2018.
- [49] Bulent Yener. Cell-graphs: image-driven modeling of structure-function relationship. Communications of the ACM, 60(1):74–84, 2016.
- [50] Zhitao Ying, Jiaxuan You, Christopher Morris, Xiang Ren, William L. Hamilton, and Jure Leskovec. Hierarchical graph representation learning with differentiable pooling. In Advances in Neural Information Processing Systems, 2018.
- [51] Frederic Zana and J-C Klein. Segmentation of vessel-like patterns using mathematical morphology and curvature evaluation. IEEE Trans. Image Processing, 10(7):1010–1019, 2001.
- [52] Muhan Zhang, Zhicheng Cui, Marion Neumann, and Yixin Chen. An end-to-end deep learning architecture for graph classification. In Thirty-Second AAAI Conference on Artificial Intelligence, 2018.
- [53] Yanning Zhou, Omer Fahri Onder, Qi Dou, Efstratios Tsougenis, Hao Chen, and Pheng-Ann Heng. CIA-Net: Robust nuclei instance segmentation with contour-aware information aggregation. In International Conference on Information Processing in Medical Imaging, 2019.