Constraining GRBs pseudo-redshifts using different empirical correlations
Abstract:
The determination of distances is highly constrained to a small number of Gamma-Ray Bursts (GRBs) because it requires observations at different wavelengths. Some empirical functions to estimate redshifts have been identified using populations of GRBs with reported redshifts. For example, the Amati correlation relates of the spectrum when modeled with a Band function and the total energy emitted in a time integrated analysis. A multiple-component scenario has been proposed in order to explain GRBs spectra, and in this context when a fine-time spectral analysis is performed a correlation between the non-thermal component’s peak energy and the luminosity () appears. This correlation is also used to infer distances to GRBs. In this work we present a sample of bright GRBs and apply these empirical correlations to constrain the pseudo-redshift of the selected burst sample. Our results for GRB080916C, GRB090926A and GRB150214A with reported redshift are totally consistent. Another three bursts with lower luminosities were selected. For these bursts, the pseudo-redshift range obtained with the two correlations are not totally in agreement.
1 Introduction
Gamma Ray Bursts (GRBs) are the most energetic transients in the universe. They are characterized by a prompt release of gamma and X-ray photons with a radiated energy of erg liberated in a few seconds, followed by an long lasting afterglow emission that radiates in different wavelengths. The spectrum of GRBs prompt emission in the keV-MeV energy range is typically described by the empirical Band function [1] but some bursts present additional spectral components [2, 3, 4]. The most accepted model describing GRBs emissions is the so called Fireball model [5, 6, 7], which predicts a compact object as the GRB central engine that can be originated either from the collapse of a massive star [8, 9] or from the merger of two compact objects. This central engine launches high relativistic jets [6].
Due to their high luminosity GRBs are visible up to high distances, , becoming good candidates for high redshift studies. Unfortunately despite all the observational an theoretical advances in the field there is not a direct way to infer distances from prompt gamma-ray observations. Different functions (or correlations) have been proposed using prompt, afterglow and prompt-afterglow observations. From prompt emission observations some empirical correlations between GRBs observables have been reported using different spectral components and obtained from both time integrated and fine time analysis, such as the peak energy of the prompt emission spectra, peak luminosity and the isotropic energy [10, 11, 12, 13, 14].
In this work we consider two different correlations to infer a redshift range for every GRB of a sample of Fermi bursts using GBM data. First we use one of the most investigated correlation, the so called Amati correlation [10]. When fitting the spectrum of the GRB prompt emission with a Band function a correlation is reported between the cosmological rest frame peak energy of the spectrum () and the isotropic equivalent energy . Even though this correlation presents a dispersion, it has been used as a pseudo-redshift estimator because of its consistency with several observed redshifts of GRBs from different missions. Amati correlation has been used to constrain cosmological parameters. In the past years several bursts have presented a clear deviation from the Band function in their prompt emission spectra [2, 15, 16, 13], in some cases requiring an additional power law component (PL) and in some others a thermal like black body component (BB). The second correlation considered in this work is proposed by [12, 13, 17] within a multi-component prompt emission spectral scenario. When fitting the spectra in a fine time spectral analysis of these bursts with three different components: a thermal black body component (BB), a non thermal cutoff power law component (NT) and a Power Law component (PL), a strong correlation in the central engine rest frame appears between the luminosity of the non thermal component of the time interval () and the peak energy of the same component in the same time interval. ().
The text is organized as follows. In section 2, we present the procedure followed for inferring the pseudo-redshifts using the two mentioned correlations. In section 3, we present the properties of the bursts included in our sample. Finally in section 4, we present the range of values for the distances inferred for the objects in the sample using both correlations and discuss our results.
2 Empirical correlations
Most of GRBs prompt emission spectra are best fit with the non-thermal Band function [1], two broken power laws smoothly jointed at a break energy. Correlations between some observable quantities have been reported. One of the most studied is the so called Amati correlation. Using a sample of long GRBs with known redshifts a correlation between the rest frame peak energy , the energy where the spectrum presents its maximum, and the isotropic equivalent energy in the energy range between 1-10000 keV has been reported and well studied [10].
The Amati correlation [10] is given as:
| (1) |
We use values of , and a dispersion deviation of the power law of as reported in [10]. The - Amati correlation is cosmological dependent since
| (2) |
where is the luminosity distance and is the bolometric fluence of the burst. We use standard cosmological values of Hubble constant km s-1 Mpc-1, matter density parameter and dark energy parameter .
The second correlation used in this work is the one reported by [12, 13, 17]. This one is based on a multi-component spectral scenario: a superposition of a thermal black body component (BB), a non thermal cutoff power law component (NT) and a Power Law component (PL). This correlation is also cosmological dependent and we use the same values for the cosmological parameters as for the Amati correlation. When performing fine time analysis for several Fermi and BATSE bursts a correlation appears between parameters of the non-thermal component, namely the luminosity and the peak energy of the time interval. This correlation is also proposed as a pseudo-redshift estimator and was used to obtain redshift estimates of three BATSE bursts [17]. The correlation reported by [12], as a result of the analysis of several Fermi bursts, is given by:
| (3) |
We perform a fine-time spectral analysis for our selected bursts following the procedure described in [13] and [17]. We assume that the relation 3 is universal for all Fermi bursts and estimate the corresponding pseudo-redshifts. Roughly, the procedure consists in varying the redshift of the selected burst until the relation of - becomes the relation 3.
3 Burst Sample
We performed spectral analysis to a sample of six GRBs detected by Fermi. Three of the selected bursts have reported redshifts.
GRB 080916C is one of the brightest Fermi burst. It was located at R. A. = 119.85o and Dec.= -56.63o with a duration of T63 s. When fitting this burst with a Band function using three NaI detectors (NaI 0, NaI 3 and NaI 4) along with a BGO detector we obtain spectral parameters in agreement with the ones reported in [12], peak energy of keV, low energy index and high energy index of . This burst has a reported redshift of 4.15 0.15 obtained with optical observations by GROND [18].
The very bright burst GRB090926A was observed by Fermi at R. A. = 353.4o and Dec.= -66.32o and with a reported redshift of obtained from optical observations by the Very Large Telescope [19] of the afterglow emission. We perform the spectral analysis following the procedure of [12] using only GBM data from the two BGO detectors plus three NaI detectors: NaI 3, NaI 6 and NaI 7. When fitting the burst with a Band function we obtained keV, and .
GRB150105A was located at R. A. = 124.3o and Dec= -14.8o with a duration of T73 s. In order to use the Amati correlation we performed the time integrated spectral fitting using a Band function. The detectors NaI 8, NaI 11 and BGO1 were used and the resulting parameters are: keV, and .
GRB150314A has a reported redshift of 1.758 [20]. The integrated spectral analysis was performed using detectors NaI 1, NaI 9 and BGO1. Only a Band function was included. We obtain the following spectral parameters: peak energy of keV, low energy index and high energy index of .
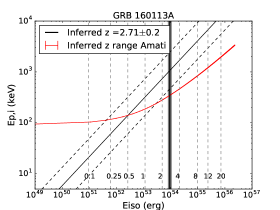
GRB160113A was located at R. A. = 187.3o and Dec.= 11.5o with a duration of T24 s. It has been associated to possible host candidates within a redshift range between z=0.087 up to z=0.382 [21]. We use detectors NaI 8, NaI 11 and BGO1 in the spectral analysis. The time integrated Band function is described by keV, and .
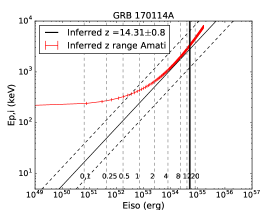
Finally GRB170114A was located at R. A. = 12.08o and Dec.= -12.55o with a duration of T14 s. Detectors NaI 1, NaI 2 and BGO0 were used. The Band parameters of the time integrated spectral fit are keV, and .
4 Results and discussion
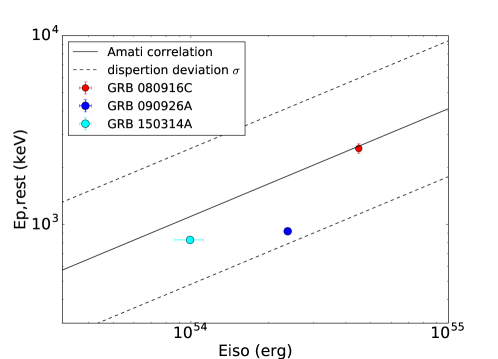
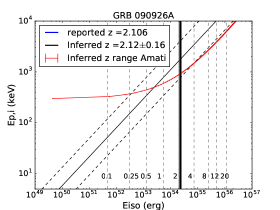
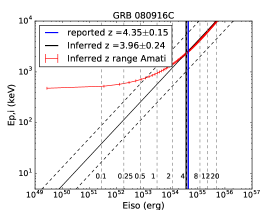
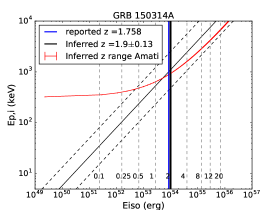
We follow the two empirical correlations presented in section 2 in order to obtain pseudo-redshifts of a sample of Fermi GRBs using GBM data. For the three bright GRBs: GRB080916C, GRB090926A and GRB150314A, the results from both correlations are consistent and in agreement with the reported redshifts (see table 1). In particular, these three bursts are also in agreement with the Amati correlation, see figure 1,.
| GRB | Reported | Amati | redshift inferred |
|---|---|---|---|
| redshift | redshift range | - correlation | |
| GRB080916C | 4.15 0.15 | > 2 | 3.96 0.24 |
| GRB090926A | 2.106 | 4 > z > 0.25 | 2.12 0.16 |
| GRB150314A | 1.758 | z > 0.4 | 1.9 0.13 |
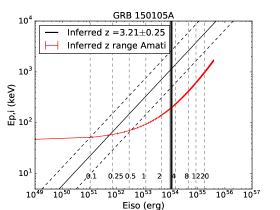
| GRB150105A | – | 0.5 > z > 0.1 | 3.21 0.25 |
| GRB160113A | – | 1.7 > z > 0.2 | 2.71 0.2 |
| GRB170114A | – | > 0.7 | 14.31 0.8 |
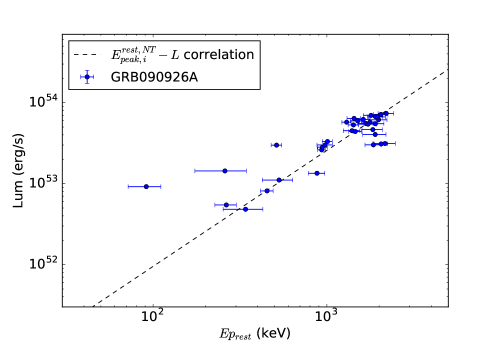
Burst GRB080916C and GRB090926A present clear deviations from the Band function as reported by [12] and both have been used to test theoretical models. These bursts were used to validate the correlation presented in eq. 3. In particular, for GRB 090926A we find the correlation shown in figure 2 which is in agreement with equation 3.
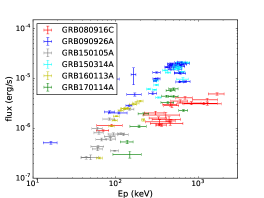
To obtain the pseudo-redshift of these bursts using the - correlation we followed the procedure described in section 2. First, we obtain the Epeak-Flux correlation as it is seen in left panel of figure 3. Then, we obtain the - correlation that is more alike to relation 3 for each burst, see right panel of figure 3.
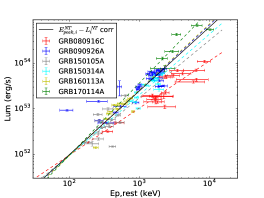
For GRB090926A, a value of z = 2.12 016 was obtained which is really close to the observed value of 2.106. For GRB080916C, the value we obtained for the pseudo-redshift is 3.95 0.24 which is close to the reported redshift of 4.15 0.15 and for GRB150314A, a value of 1.9 was obtained, also consistent with the value reported of 1.758. All these values are in the range of pseudo-redshifts obtained for the burst using the Amati correlation as can be seen in figure 4 and Table 1.
For the other three objects the pseudo-redshifts obtained using the two correlations do not seem to be in total agreement as can be seen in figure 5 and Table 1. This is particularly notorious for GRB150105A for which the Amati approach predicts z between 0.1-0.5 and from relation 3 a value of 3.21 0.25 is obtained. They differ by one order of magnitude.
For GRB160113A there is also disagreement between results from the two correlations. For this burst there are possible host candidates. The redshifts of the hosts obtained from optical observations [21] overlap with the results obtained from the Amati correlation. The E-Luminosity correlation predicts higher values.
For GRB170114 an extremely high pseudo-redshift is predicted with the E-Luminosity correlation. The values obtained with the Amati correlation are weakly restrictive and include the values obtained by the E-Luminosity correlation. This could be the most distant of the three bursts with unknown redshift.
We conclude that the two correlations seems to be in agreement for bright bursts, and that for other less luminous bursts the E-Luminosity predicts higher pseudo-redshifts. Several models predict emission in the TeV energy range, high pseudo-redshifts could suggest that a TeV detection is not expected from these bursts. For this sample when considering the E-Luminosity correlation all objects were too far to be detected by TeV instruments.
Acknowledgements
The authors would like to thank DGAPA-UNAM for financial support by grant AG100317 and DIGED-USAC.
References
- [1] D. Band, J. Matteson, L. Ford, B. Schaefer, D. Palmer, B. Teegarden et al., BATSE observations of gamma-ray burst spectra. I - Spectral diversity, ApJ 413 (1993) 281.
- [2] M. M. González, B. L. Dingus, Y. Kaneko, R. D. Preece, C. D. Dermer and M. S. Briggs, A -ray burst with a high-energy spectral component inconsistent with the synchrotron shock model, Nature 424 (2003) 749.
- [3] M. M. González, J. R. Sacahui, J. L. Ramirez, B. Patricelli and Y. Kaneko, GRB980923. A Burst with a Short Duration High-energy Component, ApJ 755 (2012) 140 [1205.4073].
- [4] S. Guiriec, V. Connaughton, M. S. Briggs, M. Burgess, F. Ryde, F. Daigne et al., Detection of a Thermal Spectral Component in the Prompt Emission of GRB 100724B, ApJ 727 (2011) L33 [1010.4601].
- [5] G. Cavallo and M. J. Rees, A qualitative study of cosmic fireballs and gamma-ray bursts, Month notices .. 183 (1978) 359.
- [6] B. Paczynski, Gamma-ray bursters at cosmological distances, ApJ 308 (1986) L43.
- [7] M. J. Rees and P. Meszaros, Unsteady outflow models for cosmological gamma-ray bursts, ApJ 430 (1994) L93 [arXiv:astro-ph/9404038].
- [8] S. E. Woosley, Gamma-ray bursts from stellar mass accretion disks around black holes, ApJ 405 (1993) 273.
- [9] A. I. MacFadyen and S. E. Woosley, Collapsars: Gamma-Ray Bursts and Explosions in “Failed Supernovae”, ApJ 524 (1999) 262 [arXiv:astro-ph/9810274].
- [10] L. Amati, The Ep,i-Eiso correlation in gamma-ray bursts: updated observational status, re-analysis and main implications, mnras 372 (2006) 233 [astro-ph/0601553].
- [11] G. Ghirlanda, G. Ghisellini and D. Lazzati, The Collimation-corrected Gamma-Ray Burst Energies Correlate with the Peak Energy of Their Fν Spectrum, apj 616 (2004) 331 [astro-ph/0405602].
- [12] S. Guiriec, C. Kouveliotou, F. Daigne, B. Zhang, R. Hascoët, R. S. Nemmen et al., Toward a Better Understanding of the GRB Phenomenon: a New Model for GRB Prompt Emission and its Effects on the New LiNT- Epeak,irest,NT Relation, ApJ 807 (2015) 148 [1501.07028].
- [13] S. Guiriec, R. Mochkovitch, T. Piran, F. Daigne, C. Kouveliotou, J. Racusin et al., GRB 131014A: A Laboratory for Studying the Thermal-like and Non-thermal Emissions in Gamma-Ray Bursts, and the New LnThi-EnTh,restpeak,i Relation, apj 814 (2015) 10 [1507.06976].
- [14] D. Yonetoku, T. Murakami, T. Nakamura, R. Yamazaki, A. K. Inoue and K. Ioka, Gamma-Ray Burst Formation Rate Inferred from the Spectral Peak Energy-Peak Luminosity Relation, apj 609 (2004) 935 [astro-ph/0309217].
- [15] M. M. González, M. Carrillo-Barragán, B. L. Dingus, Y. Kaneko, R. D. Preece and M. S. Briggs, Broadband, Time-Dependent, Spectroscopy of the Brightest Bursts Observed by BATSE LAD and EGRET TASC, ApJ 696 (2009) 2155.
- [16] M. Ackermann, K. Asano, W. B. Atwood, M. Axelsson, L. Baldini, J. Ballet et al., Fermi Observations of GRB 090510: A Short-Hard Gamma-ray Burst with an Additional, Hard Power-law Component from 10 keV TO GeV Energies, ApJ 716 (2010) 1178 [1005.2141].
- [17] S. Guiriec, M. M. Gonzalez, J. R. Sacahui, C. Kouveliotou, N. Gehrels and J. McEnery, CGRO/BATSE Data Support the New Paradigm for GRB Prompt Emission and the New LInTh-Epeak,InTh,rest Relation, apj 819 (2016) 79 [1507.04081].
- [18] J. Greiner, C. Clemens, T. Krühler, A. von Kienlin, A. Rau, R. Sari et al., The redshift and afterglow of the extremely energetic gamma-ray burst GRB 080916C, aap 498 (2009) 89 [0902.0761].
- [19] E. Bissaldi, GRB 090926: Fermi GBM detection., GRB Coordinates Network 9933 (2009) 1.
- [20] A. de Ugarte Postigo, J. P. U. Fynbo, C. Thoene, N. R. Tanvir, R. Sanchez-Ramirez, J. Gorosabel et al., GRB 150314A: Redshift from OSIRIS/GTC., GRB Coordinates Network 17583 (2015) 1.
- [21] L. P. Singer, V. Bhalerao, S. B. Cenko and M. M. Kasliwal, GRB 160113A: iPTF P48 Observations and Optical Transient Candidates., GRB Coordinates Network 18859 (2016) 1.