THE GALACTIC HALO CONTRIBUTION TO THE DISPERSION MEASURE
OF
EXTRAGALACTIC FAST RADIO BURSTS
Abstract
A new model of the Milky Way (MW) halo component of the dispersion measure (DM) for extragalactic sources, such as fast radio bursts (FRBs), is presented in light of recent diffuse X-ray observations. In addition to the spherical component of isothermal gas ( keV) in hydrostatic equilibrium with the Galactic gravitational potential, our model includes a disk-like non-spherical hot gas component to reproduce the directional dependence of the observed X-ray emission measure (EM). The total gas mass () is dominated by the spherical component, and is consistent with the total baryon mass of the MW expected from the dark matter mass and the cosmic baryon-to-dark-matter ratio. Our model predicts a mean halo DM of , with a full range of – over the whole sky. The large scatter seen in the X-ray EM data implies a dex (rms) fluctuation of the MW halo DM. We provide an analytic formula to estimate the MW halo DM of our model along any line of sight, which can be easily used to compute the total MW component of DM toward extragalactic sources, in combination with existing DM models of the warm ionized medium associated with the Galactic disk.
1 Introduction
The millisecond-duration radio transients, the so-called fast radio bursts (FRBs) are one of the most enigmatic astronomical objects (e.g., Lorimer et al. 2007; Thornton et al. 2013). FRB observation is a rapidly growing field; about 90 FRBs have been reported to date (Petroff et al., 2016), but their origin and physical mechanism (see Platts et al. 2018; Cordes & Chatterjee 2019 for review) remain shrouded in a deep fog of mystery. Interestingly, their dispersion measures (a line-of-sight integration of electron number density ), typically hundreds of , are too large to be attributed to free electrons in the Milky Way (MW), and a cosmological distance scale of 1 is inferred if the dominant contribution to DMs is from electrons in the ionized intergalactic medium (IGM). The cosmological origin has been first confirmed for a repeating source FRB 121102 (Spitler et al., 2016) with its localization to a dwarf star-forming galaxy at redshift (Chatterjee et al., 2017; Tendulkar et al., 2017). Recently, the host galaxies of two FRBs that have not yet repeated, FRB 180924 (Bannister et al., 2019) and 190523 (Ravi et al., 2019), have been identified to massive galaxies with no or weak star formation at and , respectively. Even more recently, nine new repeating sources have been discovered by CHIME (CHIME/FRB Collaboration et al., 2018, 2019) and repetitions have been confirmed for FRB 171019 originally singly-detected by ASKAP (Kumar et al., 2019), but their host galaxies remain unidentified.
In general, the observed total dispersion for an extragalactic source can be split into the four components as
| (1) |
where is the contribution from the warm ionized medium (WIM; K) of interstellar medium (ISM) in the MW disk, is that from the extended hot Galactic halo (– K), is that from IGM, and is that from the host galaxy including the local surrounding environment of the source. Here we neglected the contribution from intervening galaxy halos (McQuinn, 2014; Shull & Danforth, 2018; Prochaska & Neeleman, 2018; Prochaska & Zheng, 2019). In principle we can estimate the contribution of MW electrons to total DM (i.e., and ) for the direction of an observed radio source, thereby obtaining a rough estimate of the maximum source distance through the analytic – relation (Ioka 2003; Inoue 2004; Deng & Zhang 2014; McQuinn 2014; Shull & Danforth 2018; Li et al. 2019, for simulation study see also Dolag et al. 2015; Pol et al. 2019). For the ISM contribution, the warm electron density distribution models, such as NE2001 (Cordes & Lazio, 2002, 2003) and YMW16 (Yao et al., 2017), have been developed and widely used, whereas less attention has been paid to the smaller halo contribution (often ignored for the sake of simplicity indeed).
The distribution of hot gas ( keV) in the MW halo has been studied based on analytic gas density profile or numerical simulations, with observational constraints from oxygen absorption lines in UV or X-ray bands, emission measure (EM) of diffuse X-ray emission, and DM toward the Large Magellanic Cloud (LMC) (Maller & Bullock 2004; Sommer-Larsen 2006; Yao et al. 2009; Fang et al. 2013; Nuza et al. 2014; Dolag et al. 2015; Tepper-García et al. 2015; Roca-Fàbrega et al. 2016; Faerman et al. 2017; Fielding et al. 2017; Li & Bregman 2017; Nakashima et al. 2018; Shull & Danforth 2018; Prochaska & Zheng 2019). The DM value estimated by these modelings is –. Most of these studies considered a spherically symmetric halo, but recent X-ray observations of diffuse halo gas revealed a significant directional dependence of the EM, which motivated several studies to introduce a disk-like halo gas distribution (Yao et al. 2009; Fang et al. 2013; Li & Bregman 2017; Nakashima et al. 2018). It should be noted that this hot disk-like halo component is completely different in physical properties (such as temperature and geometrical shape) from the so-called “warm thick disk”, which is included in the warm ISM models and generally constrained by Galactic pulsar DM measurements (see Section 5.1).
However, such a disk-like model results in a scale radius of less than 10 kpc and the associated gas mass much smaller than that of total halo gas expected from the total dark matter mass of the MW halo and the cosmic ratio of baryons to dark matter. This indicates that we need to incorporate two components for a realistic model of MW halo gas distribution: a spherical component extending up to the virial radius (200 kpc) and a more compact disk-like component responsible for the diffuse X-ray emission111 Fang et al. (2013) explored the Galactic gas distribution by combining warm thick disk and hot spherical halo, which is in contrast to our idea of combining two hot gas halo components.. Both components may have significant contribution to the DM, and the purpose of this work is to construct such a two-component, direction-dependent model of the MW halo gas distribution and DM.
This paper is organized as follows. In Section 2, we describe the framework of our model for spatial distribution of the hot gas halo. The modeled EM and DM are compared with observational constraints in Section 3. We then provide a fitting formula of the halo DM as a function of the Galactic coordinate for a convenient use in FRB observations in Section 4, and discussion on our newly proposed model is given in Section 5, followed by conclusions in section 6. The adopted cosmological parameters for a flat universe are , , and (Planck Collaboration et al., 2016). Our choice of the Galactocentric distance of the Sun is kpc (Kerr & Lynden-Bell, 1986). When calculating the number density of gas particles, we take a mean molecular mass per electron, (, and are gas mass density, the proton mass and electron number density, respectively), a mean particle mass ( denotes the number density of all particles, including baryonic particles and free electrons, that contribute to the gas pressure), and a number density ratio of hydrogen to electron (independent of gas metallicity). These were calculated assuming fully ionized hydrogen and helium with a helium mass abundance of 30%.
2 A Model for the hot gas halo
Hot gas existing in the MW halo can be probed by EM () of diffuse X-ray emission, where is the hydrogen number density and is a coordinate along the line of sight (e.g., Snowden et al. 1997; McCammon et al. 2002; Yao & Wang 2007; Yao et al. 2009; Gupta et al. 2012; Yoshino et al. 2009; Hagihara et al. 2010; Henley & Shelton 2013; Nakashima et al. 2018). Most recently, Nakashima et al. (2018) (hereafter N18) have estimated EM to 107 sightlines by the Suzaku X-ray observations at and . They found that the observed EM distribution over the entire sky cannot be descirbed by a spherically symmetric electron density distribution, but can be reproduced by a disk-like distribution
| (2) |
where and are the cylindrical coordinates, and ( denotes the halo hot gas metallicity), , and . The metallicity dependence appears because X-ray emissivity is dominated by oxygen ions.
However, the total mass of this disk-like component is only , which is much smaller than the total halo gas mass expected by the MW dark halo mass and the cosmic mass ratio of dark to baryonic matter (e.g., Yao & Wang 2007; Fang et al. 2013; Miller & Bregman 2015; Li & Bregman 2017). Although such a more massive, more spherical, and more extended (up to the virial radius) halo may not significantly contribute to the observed EM of diffuse X-ray emission, it should exist theoretically (e.g., Spitzer 1956; Cen & Ostriker 1999) and it is also supported by observations of absorption lines (e.g., Nicastro et al. 2002; Tumlinson et al. 2011). Therefore in this work we perform a new fit to the observed EM of N18 with the two components of the compact disk-like halo and the extended spherical halo.
For the spherical component, we therefore introduce a theoretical density profile that is modeled as the isothermal gas in hydrostatic equilibrium with a Galactic dark matter halo. In our model, MW’s dark matter halo has a virial mass of and a virial radius of kpc according to the model by Klypin et al. (2002). We assume that the dark matter distribution follows the NFW-profile gravitational potential with a concentration of with being a NFW scale radius (Navarro et al. 1997; Bullock et al. 2001). The gravitational potential of the Galactic stellar disk is neglected since it has little effect on the resulting density profile. Assuming the ideal gas with a constant temperature , gas pressure is given by and hydrostatic equilibrium (HE) reduces to
| (3) |
where is a dimensionless constant with being the NFW scale density. We assume the same temperature for the disk-like and spherical components as keV based on the X-ray observation (N18). The central electron density is determined so that the enclosed gas mass of the spherical component within is equal to the Galactic baryon mass :
| (4) |
We choose the fiducial total baryon mass to be , assuming the baryon fraction of the MW is % of the cosmic mean , which is the same value as adopted by Prochaska & Zheng (2019). These figures are roughly consistent with an estimate that % of galactic baryons reside in the stars and ISM (Fukugita et al., 1998), if the remaining % of baryons are in the galactic halo. Combining the above assumptions, we obtain and as fiducial values for our model.
3 Observational constraints
Here we construct our non-spherical hot gas halo models by fitting to the observed X-ray EM. Then we present our model in comparison with existing theoretical models, and examine its consistency with DM of LMC pulsars and absorption line observations.
3.1 Fit to X-ray EM
Observations of the diffuse X-ray EM have benefits of a large number of sightlines. To construct a direction-dependent model of the MW halo DM, we utilize the measurements of halo gas EM, EMN18,⊙, which are presented as EMhalo in Table 1 of N18. The EMN18,⊙ for each siteline was determined, along with gas temperature and [O/Fe], by spectral fittings. The medians of temperature and [O/Fe] over all sitelines are keV and , respectively (N18). The metallicity of the halo gas is not well constrained by the X-ray data, and it was fixed to the solar abundance. However, X-ray emissions are dominated by continuum recombination emission from oxygen ions. Therefore the true EM should scale with the halo gas metallicity as:
| (5) |
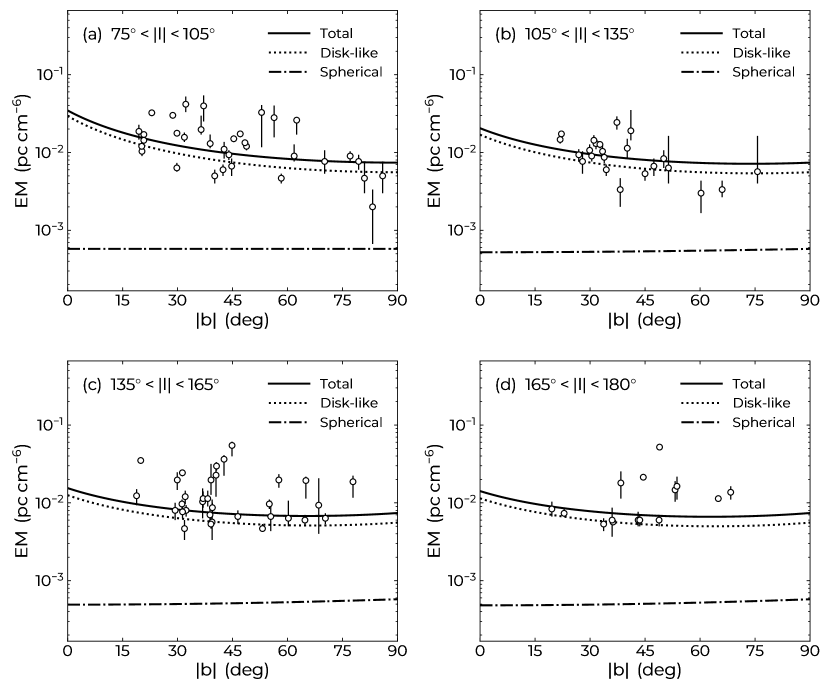
Throughout this work, we adopt as suggested by cosmological simulations (Cen & Ostriker, 2006) and observations of high velocity clouds (e.g., Gibson et al. 2000; Fox et al. 2005). Distribution of EMN18 is shown in four panels of Figure 1 as a function of Galactic latitude. Despite the large scatter seen in the data, N18 statistically confirm the trend of decreasing EMs as Galactic latitudes increase.
We construct an empirical model for the entire electron density distribution of the hot gas by combining Equation (2) and (3): . Since the mass ratio between the disk-like and spherical halo components within is expected to be small, a naive summation of these barely affects the HE assumption. The modeled EM of the halo gas towards a given Galactic coordinate is computed by
| (6) |
where is the hydrogen number density and we integrate the hot gas halo density profile along the line-of-sight from the solar system out to the maximum distance corresponding to the virial radius of the MW halo.
Since the spherical component is already fixed by Equation (4), the remaining parameters to be determined are , and that characterize the disk-halo component. These are determined by fitting EMmodel to EMN18 using Markov Chain Monte Carlo (MCMC) sampling with emcee, a Python based affine invariant sampler (Foreman-Mackey et al., 2013). The likelihood function is , where the standard deviation associated with each data is defined by the geometric mean of the asymmetric errors. We adopt a flat prior distribution for all of our parameters in the , , and . We generate samples and obtain the best set of parameters with , , , where errors are estimated by the th and th percentile of the MCMC realizations.
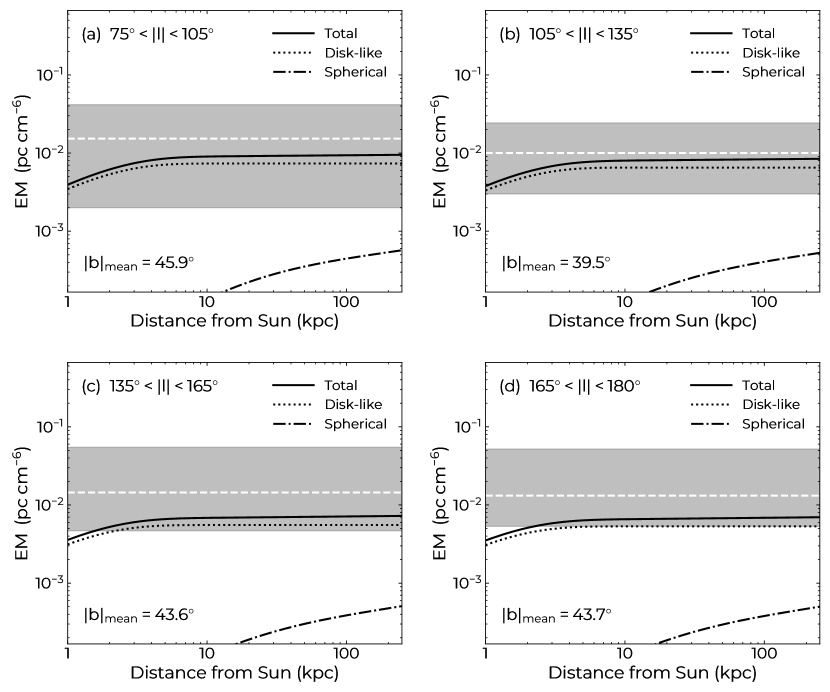
The EMs predicted with best-fit parameters as a function of Galactic latitude and distance are presented in Figure 1 and Figure 2, respectively. In Figure 1 we see that the modeled EM is dominated by the disk-like component, and our model matches the trend of EM against spatial directions. Figure 2 indicates that the total EM reaches the observed EM at kpc from the Sun, reflecting the dominance of the disk-like halo. The large scatter of the data from the mean might be due to a density fluctuation in the disk-like halo.
3.2 Comparison with Previous Studies
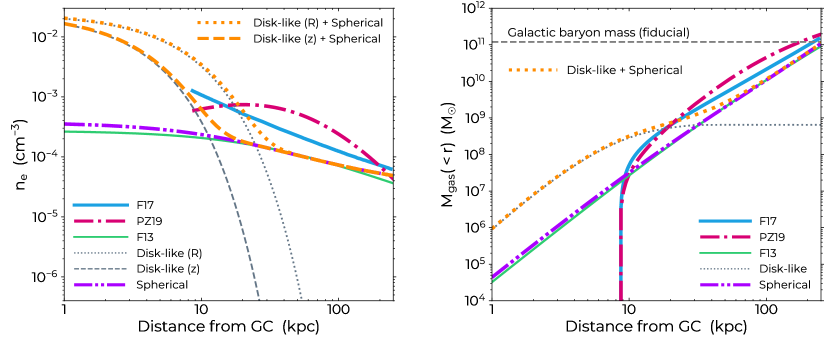
Here we compare our model with three models of previous studies in the literature: (1) an isothermal model with multiple gas phases (the fiducial model with of Faerman et al. 2017; hereafter F17), (2) an adiabatic gas model with polytropic index (Fang et al. 2013, hereafter F13, see also Maller & Bullock 2004) and (3) a modified NFW profile with of Mathews & Prochaska (2017) and Prochaska & Zheng (2019) (hereafter PZ19). Figure 3 shows density (left panel) and mass (right panel) profile of the hot gas for different models. Since the disk-like component in our model has directional dependence, profiles to two directions (along - and -axis) are shown. The spherical component of our model is quantitatively similar to the F13 model.
3.3 LMC Pulsar Dispersion Measure
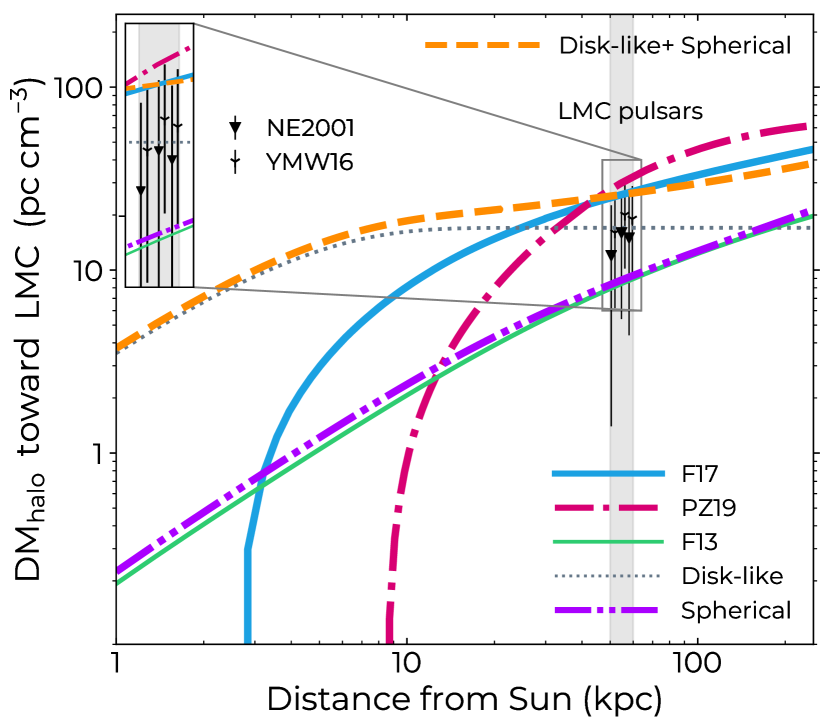
The dispersion measurements of pulsars outside the Galactic disk provide us the most direct tool to reveal the gas distribution in the MW. While most Galactic pulsars lie in the Galactic disk, some of them have been found in the Large Magellanic Cloud (LMC) at a distance of kpc (Pietrzyński et al., 2013) from the Sun. Because of the large offsets from the Galactic disk, LMC pulsars have been used to probe the hot halo gas distribution in the literature (e.g., Anderson & Bregman 2010; F13). Here we focus on three LMC pulsars with the lowest DMs of (McConnell et al., 1991; Manchester et al., 2006). To estimate the hot gas halo contribution to LMC pulsar DMs, we need to subtract the contribution from the ISM in the MW disk and spiral arms. We find for NE2001 model ( for YMW16 model), thereby obtaining upper-limits on the hot gas halo DM at the LMC location as – for NE2001 (– for YMW16). Here we assume that the measurement uncertainty and the DM contribution from local gas within the LMC are both negligible. The uncertainty arising from models is conservatively taken to be % (Cordes & Lazio, 2002).
Figure 4 shows the hot gas halo DM profiles along the LMC sightline () for different halo gas models. Given the large uncertainty of warm ISM models, most of the models are marginally consistent with the upper-limits established by the LMC pulsar DM. It should be noted that the DM predicted by our model is dominated by the disk-like component, which is not taken into account in previous models. This implies that gas density of the previous models by F17 and PZ19 is too high as that of the spherical component of our model.
3.4 Absorption Line Measurements
Another observational constraint comes from the X-ray absorption lines of highly ionized oxygen (O vii and O viii) and a UV absorption line (O vi) by MW halo gas seen in distant active galactic nuclei (AGN) or blazar spectra (e.g., Nicastro et al. 2002; Fang et al. 2002, 2003; Rasmussen et al. 2003; Sembach et al. 2003; Collins et al. 2004; McKernan et al. 2004; Wang et al. 2005; Bregman 2007; Bregman & Lloyd-Davies 2007; Hagihara et al. 2010; Gupta et al. 2012; Miller & Bregman 2013, 2015; Fang et al. 2015). These observations have been used to constrain the MW halo gas models (e.g., F17 and PZ19).
However, we only utilize data of the diffuse X-ray EM in this study for the following reasons. First, since the absorption lines are not fully resolved with grating spectrometers, the same line velocity width often needs to be assumed for different sitelines, and thus the inferred ionic column density (i.e., DM) strongly depends on the assumed gas kinematics. The other reason is that absorption line measurements tend to be limited to the direction of bright AGNs or blazars, which would lead to a smaller size of sample per each measurement (, Gupta et al. 2012; Miller & Bregman 2013, 2015; Fang et al. 2015) compared to diffuse X-ray observations (, Henley & Shelton 2013; N18). Therefore we chose to fix the spherical component of our model by the total gas mass theoretically expected from the MW dark mass.
| Disk-like Spherical () | ||||||||
| Spherical () | ||||||||
| – | – | – | – | |||||
| – | – | – | – | |||||
| – | – | – | – | |||||
| – | – | – | – | |||||
| – | – | – | – | |||||
One of the most recent study of OVII absorptions toward nearby AGNs at high Galactic latitudes (Fang et al. 2015) suggests that typical column densities through the Galactic halo are – with large scatters likely due to the measurement uncertainties. Assuming that O vii is the dominant state among ionized oxygens with the hot gas metallicity of , this translates into a dispersion measure of
| (7) |
where we adopt a rough median value for (see also Shull & Danforth 2018 and PZ19 for similar estimates). Meanwhile, our model predicts – over the same region of the sky. Therefore, the difference between F17, PZ19, and the spherical component of our model is within the uncertainty in using absorption lines, and hence our model is fully consistent with the absorption line observations.
4 Analytic formula for MW halo DM
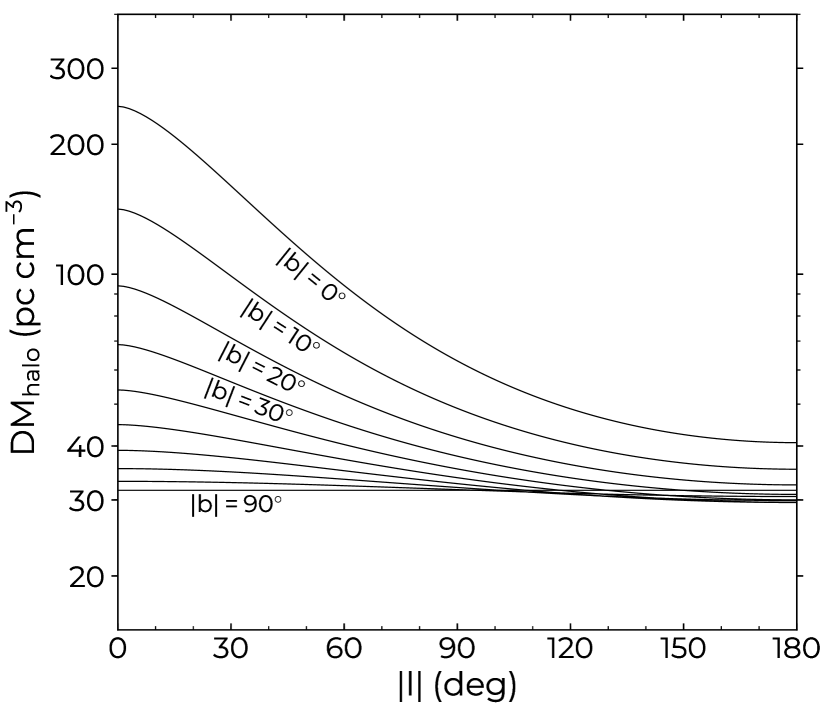
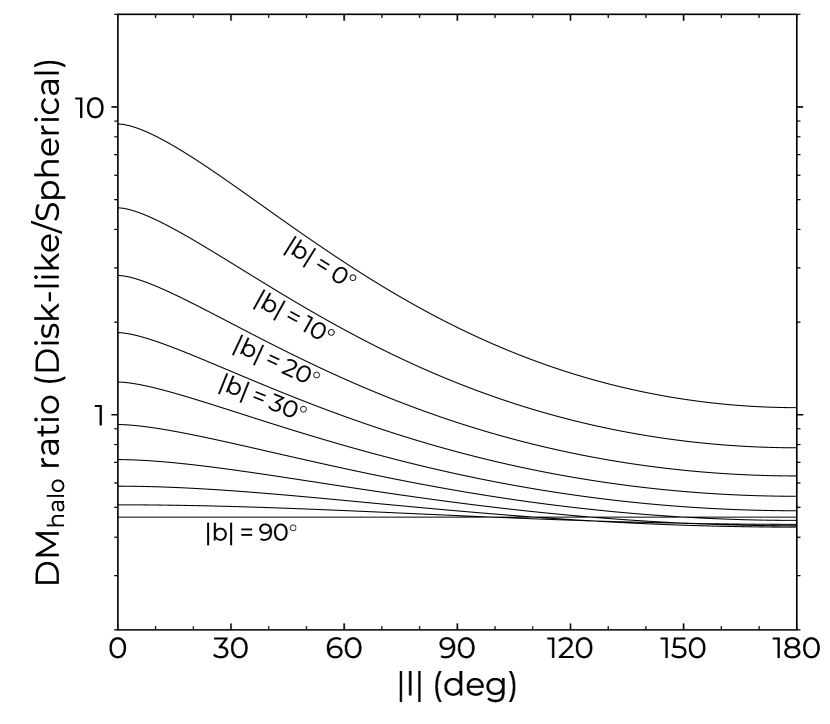
Based on our new hot gas halo model, here we aim to provide a convenient analytic formula of the hot gas halo DM to any given direction to an extragalactic object. We calculated a full-sky map for by integrating until the sightline intersects the sphere of the virial radius . Figure 5 describes the derived DM profile for selected Galactic latitudes. The halo DM of our model spans the range – over the whole sky, with a mean of . Figure 6 shows the ratio of the two components of the halo DM, disk-like to spherical, and it ranges in – over the full-sky region, which demonstrates the highly non-spherical nature of our model.
The fitting formula of the halo DM as a function of the Galactic coordinate is obtained with the th-order polynomial as
| (8) |
where is the fitting coefficient in units of , and are Galactic coordinates measured in radians, and . The fitting result is summarized in Table 1. We confirm that this formula reproduces the theoretical prediction within % accuracy, and the regions of an accuracy better than 1% amount to 98% of the entire sky. This formula for can be used in combination with existing models (NE2001 and YMW16) to estimate the total DM by electrons in the MW. In order to separate the contributions by disk-like and spherical component, we also show a fitting result only for the spherical halo component with in Table 1, which achieves a higher model accuracy (within %) due to a smaller directional dependence of the spherical halo.
5 Discussion
5.1 Relation to the Warm Electron Models
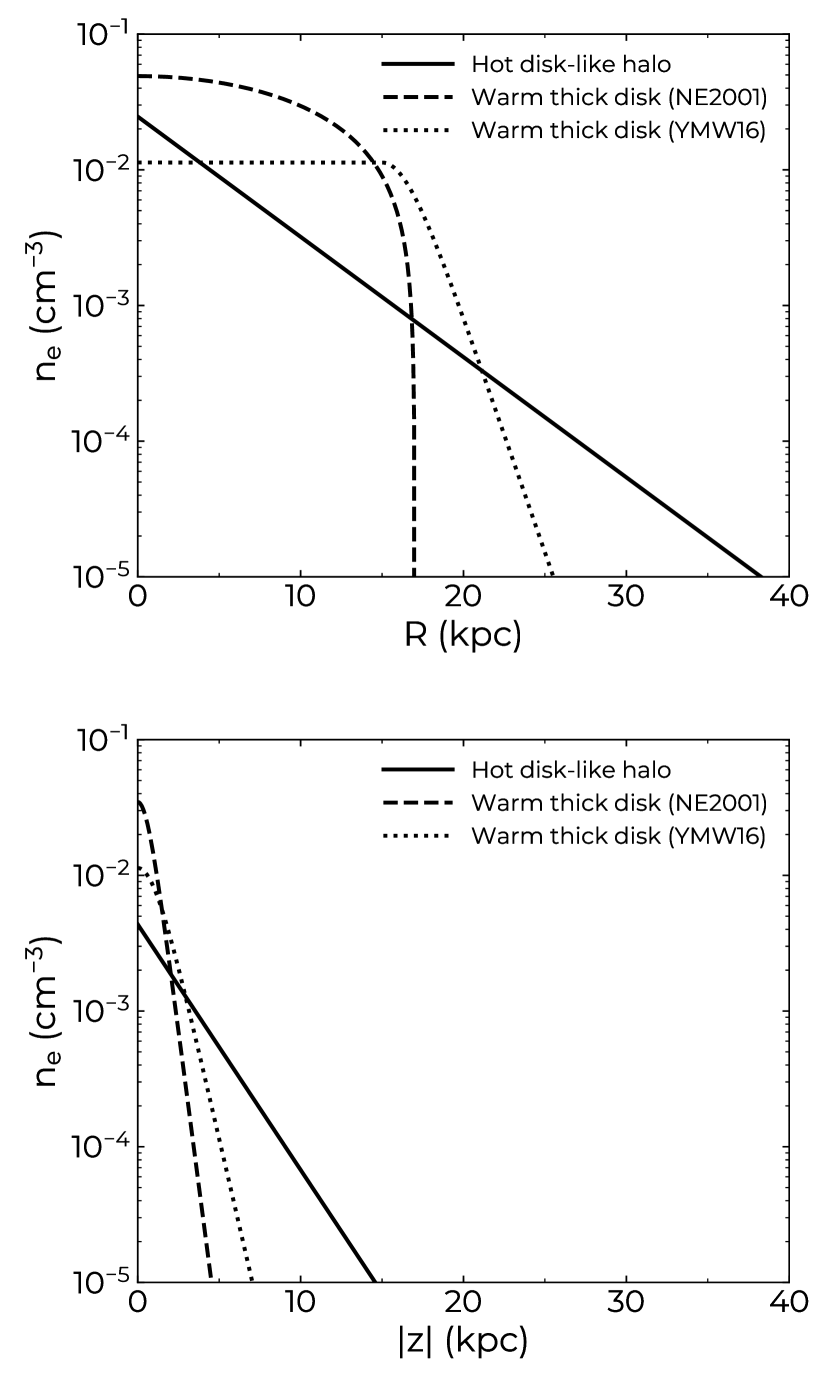
The spatial distributions of WIM in the Galactic ISM have been modeled by the observed DMs toward Galactic radio pulsars (Taylor & Cordes, 1993; Cordes & Lazio, 2002, 2003; Yao et al., 2017), and the diffuse component of WIM is known to distribute in the so-called “thick disk” with a vertical scale height of kpc and a mid-plane electron number density of (see, e.g., Readhead & Duffett-Smith 1975; Reynolds 1989; Gaensler et al. 2008; Savage & Wakker 2009). Figure 7 illustrates the density profile of warm thick disks (NE2001 and YMW16) in comparison with our hot disk-like halo. Since the gas distribution of the hot disk-like halo component evidently overlaps with those of thick disk models, there is a possibility that the hot disk-like halo has already been taken into account partly in the modeling of the thick disk by NE2001 and YMW16.
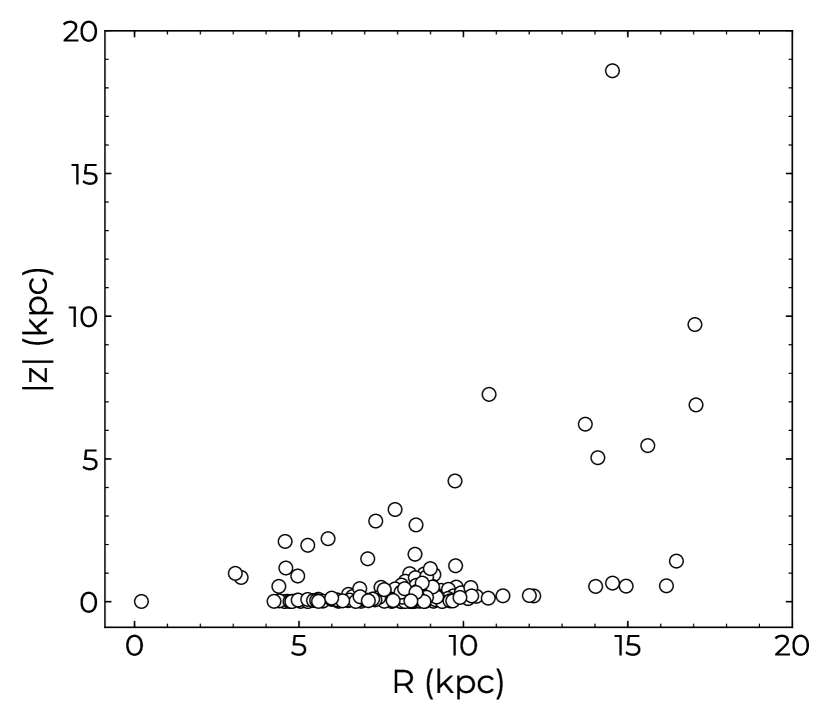
In Figure 8 we show the spatial distribution of 189 Galactic pulsars having independent distance constraints (mostly by parallax measurements) that have been used to model the warm thick disks (YMW16, see also the ATNF Pulsar Catalogue documented in Manchester et al. 2005). The average distance from the Sun to those pulsars is kpc, and most of them lie in the vicinity of the Galactic plane ( kpc and kpc kpc). Figure 9 compares the predicted DM for these pulsars by the warm thick disks and the hot disk-like halo. It clearly indicates that for the majority of these pulsars, DM contribution from warm thick disks is at least a few times larger than that from the hot disk-like halo. The geometrical shapes of the thick disks and our disk-like halo are significantly different, and it is unlikely that the disk-like halo is properly taken into account in the warm disk models. Therefore, we recommend to simply add of our model (presented in Section 4) to of NE2001 or YMW16 to estimate the total DM of the MW.

5.2 Model Uncertainties
Based on our fiducial hot gas halo model, we estimate the mean halo DM of . We note that this number should only be considered as a benchmark due to the following systematic uncertainties. First, since the observed EMs can be almost fitted with the disk-like halo component alone, the major source of uncertainty originates from the the modelling of spherical halo component (i.e., the total gas mass of the spherical halo within the virial radius ). We find that the fraction of the cosmic baryons in the Galactic halo , defined as , needs to be less than unity (a fiducial value of ) in order to be consistent with the DM toward the LMC with the best-fit disk-like halo component being unchanged. If we consider the possible range of (although is a rather extreme limit), the mean halo DM over the whole sky ranges –. This means that a choice of different (or ) change the estimate of by at most . By contrast, statistical uncertainties in the best-fit parameters of the disk-like halo component is negligible. Secondly, it is found that a choice of larger integration limits corresponding to – increases the mean value only by %–%. Lastly, if we attribute the scatter seen in the X-ray EM data ( dex) to the fluctuation of the hot gas density, should have a scatter of dex over the whole sky, as and .
5.3 Application to Host-identified FRBs
Here we focus on two non-repeating sources FRB 180924 (Bannister et al., 2019) and FRB 190523 (Ravi et al., 2019) for which the redshifts are known. In order to discuss the DM budget for these sources, we utilize the - relation (Ioka, 2003; Inoue, 2004; Deng & Zhang, 2014):
| (9) |
Here is the ionization factor and we neglect the redshift dependence, and denotes the fraction of baryons that reside in the ionized IGM, which has yet to be constrained well. The current cosmic baryon census suggests that (Shull et al., 2012) and could be as high as (e.g., Fukugita & Peebles 2004) provided that all the missing baryons (%) exist as a form of diffuse IGM. Here we set as a plausible range. The systematic errors in our halo model is conservatively taken to be (see Section 5.2).
FRB 180924.—The host is an massive galaxy with stellar mass of at (Bannister et al., 2019). The total DM is reported to be (Bannister et al., 2019), and an upper limit on DMIGM is obtained by DM DM DM DMhalo, where the equality holds when DM. The ISM contribution to this direction [] is estimated as (NE2001) or (YMW16) by the two different models. The MW halo contribution to this direction by our model is , compared to – estimated by PZ19. Compared with the theoretical value of from Eq. (5.3), the observation gives a constraint on . Our DMhalo model predicts a lower value than PZ19, and hence a weaker constraint of – depending on the DMISM models, which should be compared with – when the high end value of PZ19 is adopted.
FRB 190523.—The host is a massive () galaxy at (Ravi et al., 2019). The total DM is reported to be (Bannister et al., 2019), with warm ISM contribution averaged over two models (NE2001) and (YMW16) for the FRB direction . The MW halo DM of our model is . Compared with the theoretical , is constrained to – using our halo DM model, while – is derived using the high end value of PZ19.
6 Conclusions
In this study, we constructed a new model for DM associated with the extended hot gas halo in the MW, by taking into account the recent diffuse X-ray observation. Our hot gas halo model comprises of the two components: disk-like and spherical halo. The former is suggested by the recent diffuse X-ray observations, while the latter is theoretically introduced to make the total baryonic halo mass consistent with the cosmic baryon-to-dark-matter ratio. The radial profile of the spherical component is modeled by an isothermal gas under dynamical equilibrium with the dark matter halo potential of the MW. It is shown that the inclusion of the disk-like component is essential to explain the directional dependence of the observed EMs, which is in contrast to the previous models considering only the spherical halo.
Based on the newly proposed hot gas halo density profile, we derive the halo DM along any line of sight. Our model predicts a full range of – over the whole sky, with a mean of , which is slightly higher than the prevailing value () based on cosmological simulations (Dolag et al., 2015), but lower than the range preferred by a recent model of PZ19 (–). We provide a convenient analytic formula for the MW halo DM, which enables an easy estimate of along any siteline toward extragalactic sources.
With the advent of large field-of-view surveys, such as CHIME and Apertif (van Leeuwen, 2014), the number of nearby FRBs with (e.g., FRB 171020 with found by ASKAP; Shannon et al. 2018; Mahony et al. 2018, FRB 110214 with by Parkes; Petroff et al. 2019 and FRB 181030.J1054+73 with by CHIME; CHIME/FRB Collaboration et al. 2019) is expected to increase in the foreseeable future. Since the total DMs of nearby FRBs might be dominated by the contribution from Galactic electrons, the estimate of and would be more important.
References
- Anderson & Bregman (2010) Anderson, M. E., & Bregman, J. N. 2010, ApJ, 714, 320, doi: 10.1088/0004-637X/714/1/320
- Astropy Collaboration et al. (2013) Astropy Collaboration, Robitaille, T. P., Tollerud, E. J., et al. 2013, A&A, 558, A33, doi: 10.1051/0004-6361/201322068
- Bannister et al. (2019) Bannister, K. W., Deller, A. T., Phillips, C., et al. 2019, Science, doi: 10.1126/science.aaw5903
- Bregman (2007) Bregman, J. N. 2007, ARA&A, 45, 221, doi: 10.1146/annurev.astro.45.051806.110619
- Bregman & Lloyd-Davies (2007) Bregman, J. N., & Lloyd-Davies, E. J. 2007, ApJ, 669, 990, doi: 10.1086/521321
- Bullock et al. (2001) Bullock, J. S., Kolatt, T. S., Sigad, Y., et al. 2001, MNRAS, 321, 559, doi: 10.1046/j.1365-8711.2001.04068.x
- Cen & Ostriker (1999) Cen, R., & Ostriker, J. P. 1999, ApJ, 514, 1, doi: 10.1086/306949
- Cen & Ostriker (2006) —. 2006, ApJ, 650, 560, doi: 10.1086/506505
- Chatterjee et al. (2017) Chatterjee, S., Law, C. J., Wharton, R. S., et al. 2017, Nature, 541, 58, doi: 10.1038/nature20797
- CHIME/FRB Collaboration et al. (2018) CHIME/FRB Collaboration, Amiri, M., Bandura, K., et al. 2018, ApJ, 863, 48, doi: 10.3847/1538-4357/aad188
- CHIME/FRB Collaboration et al. (2019) CHIME/FRB Collaboration, :, Andersen, B. C., et al. 2019, arXiv e-prints, arXiv:1908.03507. https://arxiv.org/abs/1908.03507
- Collins et al. (2004) Collins, J. A., Shull, J. M., & Giroux, M. L. 2004, ApJ, 605, 216, doi: 10.1086/382269
- Cordes & Chatterjee (2019) Cordes, J. M., & Chatterjee, S. 2019. https://arxiv.org/abs/1906.05878
- Cordes & Lazio (2002) Cordes, J. M., & Lazio, T. J. W. 2002, arXiv e-prints, astro. https://arxiv.org/abs/astro-ph/0207156
- Cordes & Lazio (2003) —. 2003, arXiv e-prints, astro. https://arxiv.org/abs/astro-ph/0301598
- Deng & Zhang (2014) Deng, W., & Zhang, B. 2014, ApJ, 783, L35, doi: 10.1088/2041-8205/783/2/L35
- Dolag et al. (2015) Dolag, K., Gaensler, B. M., Beck, A. M., & Beck, M. C. 2015, MNRAS, 451, 4277, doi: 10.1093/mnras/stv1190
- Faerman et al. (2017) Faerman, Y., Sternberg, A., & McKee, C. F. 2017, ApJ, 835, 52, doi: 10.3847/1538-4357/835/1/52
- Fang et al. (2013) Fang, T., Bullock, J., & Boylan-Kolchin, M. 2013, ApJ, 762, 20, doi: 10.1088/0004-637X/762/1/20
- Fang et al. (2015) Fang, T., Buote, D., Bullock, J., & Ma, R. 2015, ApJS, 217, 21, doi: 10.1088/0067-0049/217/2/21
- Fang et al. (2002) Fang, T., Marshall, H. L., Lee, J. C., Davis, D. S., & Canizares, C. R. 2002, ApJ, 572, L127, doi: 10.1086/341665
- Fang et al. (2003) Fang, T., Sembach, K. R., & Canizares, C. R. 2003, ApJ, 586, L49, doi: 10.1086/374680
- Fielding et al. (2017) Fielding, D., Quataert, E., McCourt, M., & Thompson, T. A. 2017, Mon. Not. Roy. Astron. Soc., 466, 3810, doi: 10.1093/mnras/stw3326
- Foreman-Mackey et al. (2013) Foreman-Mackey, D., Hogg, D. W., Lang, D., & Goodman, J. 2013, PASP, 125, 306, doi: 10.1086/670067
- Fox et al. (2005) Fox, A. J., Wakker, B. P., Savage, B. D., et al. 2005, ApJ, 630, 332, doi: 10.1086/431915
- Fukugita et al. (1998) Fukugita, M., Hogan, C. J., & Peebles, P. J. E. 1998, ApJ, 503, 518, doi: 10.1086/306025
- Fukugita & Peebles (2004) Fukugita, M., & Peebles, P. J. E. 2004, ApJ, 616, 643, doi: 10.1086/425155
- Gaensler et al. (2008) Gaensler, B. M., Madsen, G. J., Chatterjee, S., & Mao, S. A. 2008, Publications of the Astronomical Society of Australia, 25, 184, doi: 10.1071/AS08004
- Gibson et al. (2000) Gibson, B. K., Giroux, M. L., Penton, S. V., et al. 2000, AJ, 120, 1830, doi: 10.1086/301545
- Gupta et al. (2012) Gupta, A., Mathur, S., Krongold, Y., Nicastro, F., & Galeazzi, M. 2012, ApJ, 756, L8, doi: 10.1088/2041-8205/756/1/L8
- Hagihara et al. (2010) Hagihara, T., Yao, Y., Yamasaki, N. Y., et al. 2010, PASJ, 62, 723, doi: 10.1093/pasj/62.3.723
- Henley & Shelton (2013) Henley, D. B., & Shelton, R. L. 2013, ApJ, 773, 92, doi: 10.1088/0004-637X/773/2/92
- Inoue (2004) Inoue, S. 2004, MNRAS, 348, 999, doi: 10.1111/j.1365-2966.2004.07359.x
- Ioka (2003) Ioka, K. 2003, ApJ, 598, L79, doi: 10.1086/380598
- Kerr & Lynden-Bell (1986) Kerr, F. J., & Lynden-Bell, D. 1986, MNRAS, 221, 1023, doi: 10.1093/mnras/221.4.1023
- Klypin et al. (2002) Klypin, A., Zhao, H., & Somerville, R. S. 2002, ApJ, 573, 597, doi: 10.1086/340656
- Kumar et al. (2019) Kumar, P., et al. 2019. https://arxiv.org/abs/1908.10026
- Li & Bregman (2017) Li, Y., & Bregman, J. 2017, ApJ, 849, 105, doi: 10.3847/1538-4357/aa92c6
- Li et al. (2019) Li, Z., Gao, H., Wei, J.-J., et al. 2019, ApJ, 876, 146, doi: 10.3847/1538-4357/ab18fe
- Lorimer et al. (2007) Lorimer, D. R., Bailes, M., McLaughlin, M. A., Narkevic, D. J., & Crawford, F. 2007, Science, 318, 777, doi: 10.1126/science.1147532
- Mahony et al. (2018) Mahony, E. K., Ekers, R. D., Macquart, J.-P., et al. 2018, ApJ, 867, L10, doi: 10.3847/2041-8213/aae7cb
- Maller & Bullock (2004) Maller, A. H., & Bullock, J. S. 2004, MNRAS, 355, 694, doi: 10.1111/j.1365-2966.2004.08349.x
- Manchester et al. (2006) Manchester, R. N., Fan, G., Lyne, A. G., Kaspi, V. M., & Crawford, F. 2006, ApJ, 649, 235, doi: 10.1086/505461
- Manchester et al. (2005) Manchester, R. N., Hobbs, G. B., Teoh, A., & Hobbs, M. 2005, AJ, 129, 1993, doi: 10.1086/428488
- Mathews & Prochaska (2017) Mathews, W. G., & Prochaska, J. X. 2017, ApJ, 846, L24, doi: 10.3847/2041-8213/aa8861
- McCammon et al. (2002) McCammon, D., Almy, R., Apodaca, E., et al. 2002, ApJ, 576, 188, doi: 10.1086/341727
- McConnell et al. (1991) McConnell, D., McCulloch, P. M., Hamilton, P. A., et al. 1991, MNRAS, 249, 654, doi: 10.1093/mnras/249.4.654
- McKernan et al. (2004) McKernan, B., Yaqoob, T., & Reynolds, C. S. 2004, Astrophys. J., 617, 232, doi: 10.1086/425338
- McQuinn (2014) McQuinn, M. 2014, ApJ, 780, L33, doi: 10.1088/2041-8205/780/2/L33
- Miller & Bregman (2013) Miller, M. J., & Bregman, J. N. 2013, ApJ, 770, 118, doi: 10.1088/0004-637X/770/2/118
- Miller & Bregman (2015) —. 2015, ApJ, 800, 14, doi: 10.1088/0004-637X/800/1/14
- Nakashima et al. (2018) Nakashima, S., Inoue, Y., Yamasaki, N., et al. 2018, ApJ, 862, 34, doi: 10.3847/1538-4357/aacceb
- Navarro et al. (1997) Navarro, J. F., Frenk, C. S., & White, S. D. M. 1997, ApJ, 490, 493, doi: 10.1086/304888
- Nicastro et al. (2002) Nicastro, F., Zezas, A., Drake, J., et al. 2002, ApJ, 573, 157, doi: 10.1086/340489
- Nuza et al. (2014) Nuza, S. E., Parisi, F., Scannapieco, C., et al. 2014, MNRAS, 441, 2593, doi: 10.1093/mnras/stu643
- Petroff et al. (2016) Petroff, E., Barr, E. D., Jameson, A., et al. 2016, Publications of the Astronomical Society of Australia, 33, e045, doi: 10.1017/pasa.2016.35
- Petroff et al. (2019) Petroff, E., Oostrum, L. C., Stappers, B. W., et al. 2019, MNRAS, 482, 3109, doi: 10.1093/mnras/sty2909
- Pietrzyński et al. (2013) Pietrzyński, G., et al. 2013, Nature, 495, 76, doi: 10.1038/nature11878
- Planck Collaboration et al. (2016) Planck Collaboration, Ade, P. A. R., Aghanim, N., et al. 2016, A&A, 594, A13, doi: 10.1051/0004-6361/201525830
- Platts et al. (2018) Platts, E., Weltman, A., Walters, A., et al. 2018, arXiv e-prints, arXiv:1810.05836. https://arxiv.org/abs/1810.05836
- Pol et al. (2019) Pol, N., Lam, M. T., McLaughlin, M. A., Lazio, T. J. W., & Cordes, J. M. 2019, arXiv e-prints, arXiv:1903.07630. https://arxiv.org/abs/1903.07630
- Price-Whelan et al. (2018) Price-Whelan, A. M., Sipőcz, B. M., Günther, H. M., et al. 2018, AJ, 156, 123, doi: 10.3847/1538-3881/aabc4f
- Prochaska & Neeleman (2018) Prochaska, J. X., & Neeleman, M. 2018, MNRAS, 474, 318, doi: 10.1093/mnras/stx2824
- Prochaska & Zheng (2019) Prochaska, J. X., & Zheng, Y. 2019, MNRAS, 485, 648, doi: 10.1093/mnras/stz261
- Rasmussen et al. (2003) Rasmussen, A., Kahn, S. M., & Paerels, F. 2003, in Astrophysics and Space Science Library, Vol. 281, The IGM/Galaxy Connection. The Distribution of Baryons at z=0, ed. J. L. Rosenberg & M. E. Putman, 109
- Ravi et al. (2019) Ravi, V., Catha, M., Addario, L. D., et al. 2019, Nature, doi: 10.1038/s41586-019-1389-7
- Readhead & Duffett-Smith (1975) Readhead, A. C. S., & Duffett-Smith, P. J. 1975, A&A, 42, 151
- Reynolds (1989) Reynolds, R. J. 1989, ApJ, 339, L29, doi: 10.1086/185412
- Roca-Fàbrega et al. (2016) Roca-Fàbrega, S., Valenzuela, O., Colín, P., et al. 2016, ApJ, 824, 94, doi: 10.3847/0004-637X/824/2/94
- Savage & Wakker (2009) Savage, B. D., & Wakker, B. P. 2009, ApJ, 702, 1472, doi: 10.1088/0004-637X/702/2/1472
- Sembach et al. (2003) Sembach, K. R., Wakker, B. P., Savage, B. D., et al. 2003, ApJS, 146, 165, doi: 10.1086/346231
- Shannon et al. (2018) Shannon, R. M., Macquart, J.-P., Bannister, K. W., et al. 2018, Nature, 562, 386, doi: 10.1038/s41586-018-0588-y
- Shull & Danforth (2018) Shull, J. M., & Danforth, C. W. 2018, ApJ, 852, L11, doi: 10.3847/2041-8213/aaa2fa
- Shull et al. (2012) Shull, J. M., Smith, B. D., & Danforth, C. W. 2012, ApJ, 759, 23, doi: 10.1088/0004-637X/759/1/23
- Snowden et al. (1997) Snowden, S. L., Egger, R., Freyberg, M. J., et al. 1997, ApJ, 485, 125, doi: 10.1086/304399
- Sommer-Larsen (2006) Sommer-Larsen, J. 2006, ApJ, 644, L1, doi: 10.1086/505489
- Spitler et al. (2016) Spitler, L. G., Scholz, P., Hessels, J. W. T., et al. 2016, Nature, 531, 202, doi: 10.1038/nature17168
- Spitzer (1956) Spitzer, Jr., L. 1956, ApJ, 124, 20, doi: 10.1086/146200
- Taylor & Cordes (1993) Taylor, J. H., & Cordes, J. M. 1993, ApJ, 411, 674, doi: 10.1086/172870
- Tendulkar et al. (2017) Tendulkar, S. P., Bassa, C. G., Cordes, J. M., et al. 2017, ApJ, 834, L7, doi: 10.3847/2041-8213/834/2/L7
- Tepper-García et al. (2015) Tepper-García, T., Bland-Hawthorn, J., & Sutherland, R. S. 2015, ApJ, 813, 94, doi: 10.1088/0004-637X/813/2/94
- Thornton et al. (2013) Thornton, D., et al. 2013, Science, 341, 53, doi: 10.1126/science.1236789
- Tumlinson et al. (2011) Tumlinson, J., Thom, C., Werk, J. K., et al. 2011, Science, 334, 948, doi: 10.1126/science.1209840
- van Leeuwen (2014) van Leeuwen, J. 2014, in The Third Hot-wiring the Transient Universe Workshop, ed. P. R. Wozniak, M. J. Graham, A. A. Mahabal, & R. Seaman, 79–79
- Wang et al. (2005) Wang, Q. D., Yao, Y., Tripp, T. M., et al. 2005, Astrophys. J., 635, 386, doi: 10.1086/497584
- Yao et al. (2017) Yao, J. M., Manchester, R. N., & Wang, N. 2017, ApJ, 835, 29, doi: 10.3847/1538-4357/835/1/29
- Yao & Wang (2007) Yao, Y., & Wang, Q. D. 2007, ApJ, 658, 1088, doi: 10.1086/512003
- Yao et al. (2009) Yao, Y., Wang, Q. D., Hagihara, T., et al. 2009, ApJ, 690, 143, doi: 10.1088/0004-637X/690/1/143
- Yoshino et al. (2009) Yoshino, T., Mitsuda, K., Yamasaki, N. Y., et al. 2009, PASJ, 61, 805, doi: 10.1093/pasj/61.4.805