A search for cosmogenic neutrinos with the ARIANNA test bed using 4.5 years of data
Abstract
The primary mission of the ARIANNA ultra-high energy neutrino telescope is to uncover astrophysical sources of neutrinos with energies greater than . A pilot array, consisting of seven ARIANNA stations located on the surface of the Ross Ice Shelf in Antarctica, was commissioned in November 2014. We report on the search for astrophysical neutrinos using data collected between November 2014 and February 2019. A straight-forward template matching analysis yielded no neutrino candidates, with a signal efficiency of . We find a 90% confidence upper limit on the diffuse neutrino flux of for a decade wide logarithmic bin centered at a neutrino energy of , which is an order of magnitude improvement compared to the previous limit reported by the ARIANNA collaboration. The ARIANNA stations, including purpose built cosmic-ray stations at the Moore’s Bay site and demonstrator stations at the South Pole, have operated reliably. Sustained operation at two distinct sites confirms that the flexible and adaptable architecture can be deployed in any deep ice, radio quiet environment. We show that the scientific capabilities, technical innovations, and logistical requirements of ARIANNA are sufficiently well understood to serve as the basis for large area radio-based neutrino telescope with a wide field-of-view.
1 Introduction
Since the discovery of extremely energetic cosmic rays more than a half century ago, the elusive quest to uncover the sources of these enigmatic particles has provided many challenges. Despite progress in experimental capabilities and theoretical insight, we do not yet know the acceleration mechanism for those particles with energies that have been measured in excess of [1]. Being electrically charged, cosmic rays are deflected by galactic and intergalactic magnetic fields such that the arrival direction at the Earth no longer points back to their origin, making source identification difficult. In addition, interactions with cosmic microwave photons limit the direct observation of ultra-high energy cosmic rays sources to our local supercluster (the GZK horizon) [2, 3].
Neutrino astronomy offers a new and powerful tool to provide insight into the physics associated with the acceleration process, and complements and extends measurements not accessible through the observation of other messengers. Charged cosmic rays which interact with gas, dust, or radiation near an accelerating object produce -rays and high-energy neutrinos; referred to here as astrophysical neutrinos. Whereas -rays can be absorbed in dense environments, these astrophysical neutrinos can escape and travel unimpeded to a detector ([4] and references therein). Neutrinos effectively propagate at the speed of light and, unlike charged cosmic rays, neutrinos are not deflected by magnetic fields; which allows for identification of sources, as well as directional and temporal coincidence with photons and gravitational waves from the source object.
The most energetic cosmic rays which do escape their source can interact with the cosmic microwave background en route to the Earth, generating cosmogenic neutrinos with a characteristic energy distribution peaking at [5, 6]. Since the interaction lengths for these neutrinos through the cosmic microwave background would be larger than the observable universe, the detection of neutrinos originating well outside the GZK horizon of becomes possible.
Since neutrinos interact very weakly with matter, and the expected fluxes at the relevant energies are low, large volumes of detection medium are necessary to make a significant measurement. The glaciers of Antarctica and Greenland provide a natural target, and have been leveraged in several detectors including IceCube, ANITA, and RICE [7, 8, 9]. The best limit on the ultra-high energy (UHE, ) neutrino flux up to approximately is currently set by the IceCube collaboration [7]. However, this limit is still orders of magnitude away from contesting the most conservative models of the cosmogenic flux.
The evidence for astrophysical neutrinos in the energy interval between and has grown strong over the last decade [10, 11, 7]. The arrival directions do not cluster around galactic matter but rather follow a uniform distribution indicating an extragalactic origin. Furthermore, the intriguing spatial coincidence of high energy neutrinos with the blazar TXS 0506+056 [12, 13] reported by the IceCube Collaboration prompted renewed interest in the role of point sources in multi-messenger astronomy. Theories of UHE cosmic-ray production predict a deep relationship between gamma-rays, astrophysical neutrinos, and UHE charged cosmic rays [14]. The ability of future radio-based neutrino detectors to measure luminous transient or variable events will be a key requirement for multi-messenger astronomy, and the large effective volumes made possible by radio neutrino detectors provide a low cost opportunity to discover rare or unexpected explosive sources.
While the current paucity of neutrino point sources for neutrino energies between TeV to PeV suggests a population of weak extragalactic sources, it remains an open question if this conclusion is valid at much greater neutrino energies. Perhaps rarer, more luminous, sources will be the keys to understanding the generation of the highest energy cosmic rays. There is growing recognition that "the spatial distribution and clustering of high-energy neutrinos across the sky are key observables for revealing their origins" [4]. This requirement prioritizes sky coverage and pointing resolution for every neutrino event. The ARIANNA [15, 16, 17] concept achieves large sensitivity by minimizing logistical and component costs, simplifying system complexity, and reducing data management costs. Equally important, the ARIANNA design broadens the science capabilities through accurate direction and energy reconstruction, which are discussed in detail in [18] and [19].
Though experiments such as IceCube will continue to improve the limits on diffuse flux by continuing to accrue livetime, sensitivity to transient point sources only depends on effective volume and backgrounds, which create interesting opportunities for radio-based neutrino observatories. The virtues of the ARIANNA concept have been discussed previously [16], and a summary of the detector design can be found in Sec. 2. By taking advantage of attenuation lengths of radio signals in the relevant frequency range in glacial ice, a sparse grid of radio detectors can feasibly instrument hundreds of , which is difficult for an optical (IceCube style) detector [20].
There are several pilot-stage projects which are exploring contrasting designs for the radio-based detection of ultra-high energy (UHE) neutrinos. ARA [21], for example, is an in-situ radio array located near the South Pole. The ARA design employs antennas which are placed in boreholes below the snow surface. Locating the antennas below the firn allows for a slightly greater field of view than a surface detector at the same location (site location impacts field of view, as discussed in Sec. 2.2).
Other proposed designs would aspire to measure a single flavor flux of tau neutrinos. A which undergoes a charged current interaction within the crust, or a mountain, produces a lepton which may decay within the atmosphere. The decaying high-energy would then produce a measurable radio signal through the same mechanisms as a typical cosmic-ray air shower. Projects which aim to leverage this effect include GRAND [22], TAROGE [23] and BEACON [24]. The ARIANNA site at Moore’s Bay is also suited for this detection channel, as it is adjacent to a large mountain range. A prototype tau neutrino station has been running successfully since 2017 [25].
It may be non-obvious that a neutral particle should produce a strong radio signal, but the interaction of UHE neutrinos in ice produce particle showers containing millions of charged particles. Such showers produce coherent radio emission through the Askaryan effect [26], which has been experimentally verified in ice [27]. Interactions between the shower and the dense medium produce a time-varying charge excess along the shower front and near the shower axis. This macroscopic charge excess leads to coherent radio emission concentrated within a few degrees of the Cherenkov cone angle, which is in deep ice with an index-of-refraction of . This signal takes the form of an bipolar pulse with broad-band frequency content exceeding .
2 The ARIANNA Detector
The ARIANNA test bed of radio-based neutrino stations is primarily located in Moore’s Bay on the Ross Ice Shelf, with two additional demonstrator stations located at the South Pole. Each ARIANNA station is designed to operate autonomously, with self-contained power, data acquisition (DAq), and communication systems. A single station is capable of identifying and reconstructing a neutrino signal without the need for multi-station coincidence. This allows stations to be deployed in any configuration at multiple sites, providing a straightforward path towards large area and full sky coverage. In this section, we will discuss the hardware, design philosophy, and capabilities of the detector. For a more thorough description, see [28].
2.1 The 7 Station Test Bed
The main goals of the now complete ARIANNA pilot program were to:
-
1.
Assess the durability and efficacy of the ARIANNA architecture.
-
2.
Evaluate the radio noise environment.
-
3.
Study the propagation of waves at radio frequencies through the polar ice medium.
-
4.
Gain experience with deployment and other logistical issues.
To address these goals, a total of seven ARIANNA stations were deployed on the surface of Moore’s Bay on the Ross Ice Shelf in Antarctica and successfully operated for more than four years. The first four of the seven stations [29] that make up the current test bed were deployed in the 2014-2015 Antarctic summer season, with the remaining three deployed the following season, replacing the previous generations of stations that was analyzed in [16].
2.2 The ARIANNA Site
The ARIANNA site at Moore’s Bay provides several unique advantages for the test bed. At a thickness of [30], the ice shelf at Moore’s Bay provides sufficient volume for the interaction of UHE neutrinos. The low flow rate at Moore’s Bay yields ice which is remarkably free of crevasses, and is expected to limit the effects of birefringence. The depth averaged attenuation length, as a function of frequency, was measured to be between the relevant frequency range of to assuming a reflection coefficient at the bottom of the ice shelf of , making the measurement conservative (i.e., attributing all losses to ice attenuation) [30].
In addition, the ARIANNA stations are designed to take advantage of the boundary between the ice shelf and the Ross Sea beneath. This boundary acts as a highly efficient mirror with an electric field reflection coefficient of [30], reflecting radio signals from neutrino interactions back up towards the surface mounted receivers. Correcting the attenuation length measurement for this reflection coefficient results in a depth-averaged attenuation length of approximately at low frequencies.
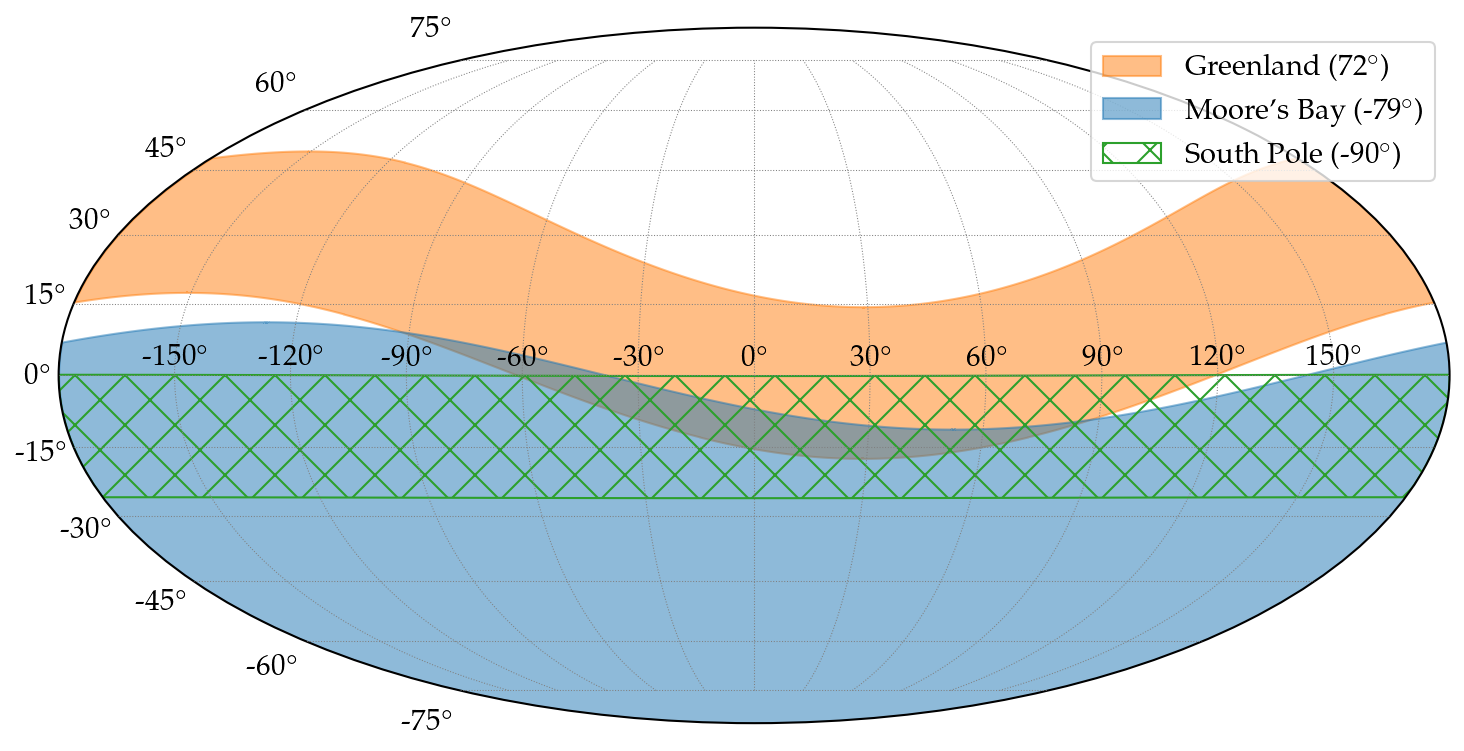
Because of this unique feature, ARIANNA stations at Moore’s Bay can view half the sky at any given instant in time with approximately uniform angular sky coverage (cf. Sec. 3.3). Due to the latitude of the ARIANNA site, different parts of the sky are exposed as the Earth rotates, increasing the field-of-view for sources which are sustained more than a few hours. The reflective layer is a unique feature in contrast to other locations, such as the South Pole and Greenland, where the field-of-view is limited to a band in declination (see Fig. 1) at any given moment.
A future detector at Moore’s Bay would complement IceCube in the search for point sources in the southern sky, and provide comparable or better angular resolution where events are dominated by shower topologies. Since ARIANNA’s field-of-view extends approximately into positive declination, it overlaps a region of the sky which contains the highest energy tracks observed by IceCube. For example, the declination band of ARIANNA includes the neutrino event observed by IceCube from the blazar TXS 0506+056 [12], a region of the sky unavailable to a radio detector at the South Pole. A detector at Moore’s Bay would also scan over parts of the sky covered by optical neutrino telescopes under construction in the northern hemisphere [31, 32].
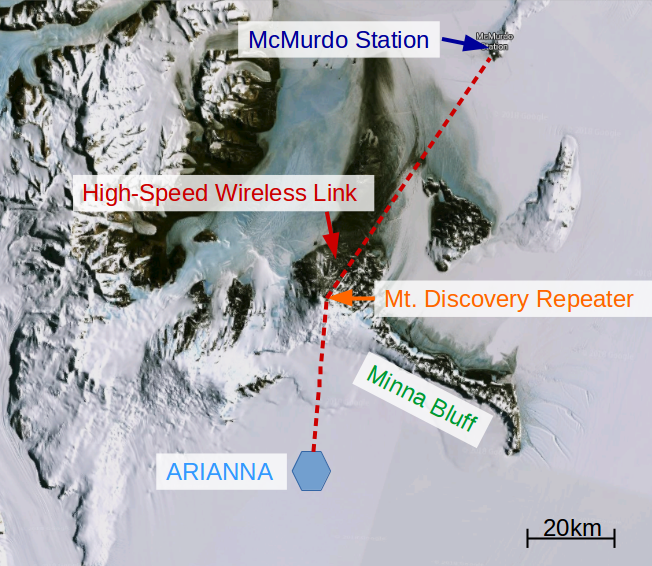
At the same time, the site is shielded from anthropogenic radio frequency (RF) noise originating from McMurdo operations by the nearby mountain ranges, especially Minna Bluff (see Fig. 2). This feature, along with its distance from McMurdo Station, makes the site remarkably radio quiet.
At a distance of , the ARIANNA site is relatively close proximity to the largest U.S. research base in Antarctica (McMurdo Station) allows for a variety of logistical support options, ranging from short-haul helicopter flights (used to transport personnel, cargo, tents, and fuel) to overland traverse (an option for a large scale future array).
2.3 Communication and Data Transfer
The geographical proximity to McMurdo Station enabled the installation of a bidirectional high-speed wireless link to McMurdo (Fig. 2), which maintains internet access 24/7. Each station contains a long range AFAR pulsAR wireless ethernet bridge [34] for near real-time data transfer. When ARIANNA stations connect over this ethernet link, they will transfer all data from the previous data taking window, which is typically set to a 30 minute period. This system is capable of transmission speeds of up to , with each event taking approximately .
ARIANNA stations also contain an Iridium satellite modem for communication via the short burst data (SBD) protocol. This provides a redundant command and (limited) data transfer channel for the ARIANNA test bed. While the ethernet repeater on Mt. Discovery (Fig. 2) operates on solar power and is only available during the summer, the Iridium network is available year-round.
ARIANNA stations operate asynchronously, periodically communicating with the control server at University of California-Irvine to transmit data and/or receive new configuration instructions. All data is saved on an SD card on the main DAq board, so data which is not transferred immediately can be later retrieved in a bulk data transfer, or physically recovered.
2.4 Antennas
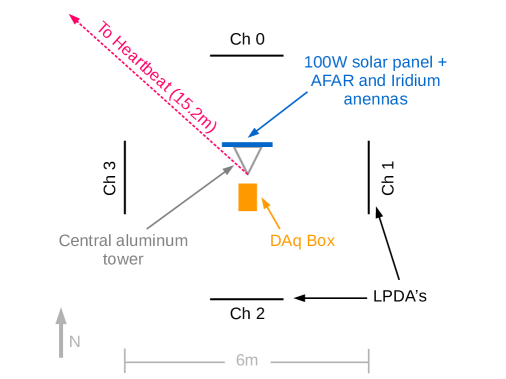
The main detection element of each station consists of four Create Design Corp. CLP5130-2 log-periodic dipole antennas (LPDA) [35]. These are arranged, buried face-down just below the snow level, in two pairs with perpendicular orientation, at a radius from the station center (see Fig. 3). These antennas have an effective bandwidth of 80 - when buried at the top of the firn [15]. Each test bed station also contains a "heartbeat" LPDA placed from the station center, which can direct a calibration pulse towards the detector.
2.5 Data Acquisition
The ARIANNA DAq mainboard is designed around the Synchronous Sampling plus Triggering (SST) chip [29, 36, 37]. Incoming signals are sampled at and held in a 256 sample circular buffer, which is read out when a triggering condition is met. The SST has a remarkably accurate time synchronization of less than between samples and between channels. This timing precision is invaluable for a precise event reconstruction, given the stations’ modest antenna separation (see [17] and [38] for an example event reconstruction using the ARIANNA DAq).
The SST employs a multi-stage coincidence trigger in order to dramatically reduce trigger rates from thermal noise. The first stage requires a coincidence between high and low threshold crossing on a single input channel. Both the high and low threshold are adjustable separately per channel. The second stage requires that two or more channels trigger within a window, taking advantage of the expectation that parallel pairs of LPDA’s should see largely the same signal. A level one (L1) trigger can also be applied on triggered events after readout, to filter out narrow-band anthropogenic background. The L1 trigger has a negligible effect on sensitivity, with a rejection rate of on simulated neutrino events [39].
The ARIANNA electronics can save data to SD card at a maximum event rate of for the 4 channel configurations (and half that rate for the 8 channel configurations), though more typically the trigger rate ranges between to corresponding to a trigger threshold of four times the RMS noise (). These rates were selected to reduce the time required to transmit data over the communication links. Since the ARIANNA station cannot search for neutrino events during data transmission, this strategy reduced the deadtime of the detector.
During most of the data taking time, the triggers are dominated by thermal noise fluctuations. Thus, the typical trigger rate is a function of trigger threshold, where the global trigger rate increases by roughly an order of magnitude when the trigger threshold is lowered by . Hence, the detector sensitivity depends only weakly on the trigger rate. Low trigger rates come with the advantage of real-time data transfer off-continent and allows modest technical requirements for data management and archiving.
In addition to the threshold trigger, ARIANNA stations generates a collection of minimum bias events by periodically forcing an event readout (typically once every ). For the study of background conditions as much as possible of this minimum bias data is transmitted in real-time.
2.6 Amplifiers
Each input channel contains a custom designed amplifier with a gain of roughly over a bandwidth of 100 - . Each amplifier consists of four AC-coupled stages, each composed of a Avago MGA-68563 chip [29]. There are two amplifier revisions deployed with the ARIANNA test bed, referred to as "100 series" and "200 series". The 200 series was developed in order to reduce cost and weight, and was also adjusted for a flatter gain in the bandwidth of interest. As these two amplifier types have slightly different impulse response, they are treated separately in the analysis. All versions of the ARIANNA amplifiers begin to clip at approximately , which limits the dynamic range of the system.
2.7 Power Systems
All ARIANNA stations in Moore’s Bay are solar powered, with a cold weather optimized battery system. The battery system can power a station for approximately 3 days without sun, and significantly increases the stations uptime during the shoulder seasons when the sun sets each day. The current battery system, along with a custom configured charge controller, was deployed on all stations during the 2015-2016 field season, and lead to a significant improvement in reliability and livetime [39].
There has also been an effort to develop and operate wind power systems which can survive Antarctic conditions. This would potentially allow remote ARIANNA stations to operate through winter without access to a power grid, greatly increasing the livetime of the array. Prototype wind generators have been installed on one of the test bed stations, and have shown promising results. The most recent prototype, deployed in November 2018, reached an operational livetime of 40% for a station without solar panels. We estimate that it is feasible to achieve at least 95% livetime for a radio array running solely on renewable energies by scaling the turbine and battery size. See [40] for more details.
2.8 Cosmic Ray Stations
In addition to the 7 station test bed, several specialized stations were deployed at the Moore’s Bay site to answer specific questions associated with the detection and identification (or tagging) of cosmic-ray-induced extended air showers [41], which generate radio pulses of similar strength, frequency content, and duration as expected for signals from neutrinos. These stations comprise four (additional) upward facing LPDA’s. The more abundant radio signals from air showers are not only an important background to tag, but also offer a unique way for an in-situ calibration and test of the detector. Using cosmic-ray data we already demonstrate a resolution in the polarization reconstruction of [42], as well as measurement of the viewing angle, i.e., the angle between the shower axis and the line-of-sight to the emission point [43, 42]. These are crucial properties to determine the neutrino direction and energy, respectively [19].
2.9 South Pole Demonstrator Stations
The autonomous design of the ARIANNA system allows for a station to be deployed essentially anywhere there is ice of sufficient quality. To demonstrate this capability, two ARIANNA detector stations were deployed near the South Pole Station.
The first South Pole demonstrator, SP-1, was deployed in December of 2017. The station is located at a distance of approximately from the main Amundsen-Scott Station. The SP-1 station receives DC power from the ARA [45] electrical grid, allowing it to operate throughout the year. The power is routed approximately from a junction box at the base of ARA Wind Turbine 3.
In December 2018 a second station was deployed at a more remote location, approximately from the main station. This detector, SP-2, is fully independent, operating on a solar power system like the stations at Moore’s Bay. This station was designed to test the feasibility of operating a solar/battery power system in the colder temperatures at the South Pole, and performed reliably while sunlight was available.
3 Data-set and Simulation
This section will define the data set to be used in this analysis (Sec. 4), as well as provide detail on the determination of the livetime used in the calculation of the limit of the diffuse neutrino flux (Sec. 4.3). We also discuss the Monte Carlo simulations that are used to calculate the detector effective volume, and construction of the simulated neutrino signal.
3.1 Definition of the Data Set
The analysis will concern the seven station ARIANNA test bed deployed at the Moore’s Bay site. Only those stations based on the SST data acquisition hardware will be considered here, with the previous generation of detectors being independently analyzed in [16]. Data collected between December \nth8, 2014 and February \nth5, 2019 will be analyzed.
3.2 Operational Livetime
Current ARIANNA hardware does not take data during communication with the server in the US. This introduces downtime which is dependent on the station configuration. Since ARIANNA is a test array, station configurations are often not set to optimize for livetime. During the 2016-2017 season, however, there was a concerted effort to run the array in an efficient manner. Stations were shown to reliably operate with 90% livetime efficiency for extended periods (see Fig. 4), collecting an average of 151 days of livetime per station through the season.
The livetime calculated for analysis excludes times when the field camp at the ARIANNA site was occupied as a precaution against contaminating the data due to camp activities. In principle, only small periods of time involving pulsed radio studies or operating equipment near stations should be unsuitable for analysis, so this is a conservative measure of the usable livetime. Several hours were also removed on Dec 11-\nth13, 2016 during the operation or ANITA’s HiCal pulser [46], which was observed by the stations in Moore’s Bay.
The livetime is also corrected for DAq deadtime due to event readout, which only becomes significant during infrequent periods where events rates increase above . After these corrections, the stations collected a total of 2906.9 days (7.96 station years, with a 365 day year) of livetime for analysis in the period between December 2014 and February 2019 (see Fig. 4), which is the time frame for this analysis. This figure is based on the data which has been successfully transferred from the ARIANNA stations. We estimate that the uncollected data, which can be physically recovered from the stations’ SD cards, would increase the livetime for analysis by approximately 5%.


3.3 Monte Carlo Simulations
The ShelfMC Monte Carlo code [28] was used to calculate the sensitivity of the detector, as well as to generate parameter distributions for the neutrino signal space. ShelfMC is based on a fork of the icemc simulation originally developed by the ANITA collaboration [47]. This section provides a brief overview of the simulation method.
Neutrino interaction vertices are generated uniformly within a fiducial volume, with isotropically distributed arrival directions. Neutrino flavor is also uniformly and randomly assigned, with no special treatment given between or . The frequency domain Askaryan signal near the vertex is calculated according to the parametrization in [48], which is validated against results from the ZHS Monte Carlo [49]. The signal is then propagated through the ice, via a direct and reflected path. The signal strength after accounting for antenna response is calculated for each channel of the detector, and is counted as a triggered event if it satisfies a 2-of-4 majority logic trigger above a specified threshold.
Each trigger is assigned a weight value, which is the probability that the neutrino reached the simulation volume (and was not absorbed by the Earth) to interact at the vertex location. The event weight also contains a factor of where is the ice density at the interaction vertex, and is the density of solid ice. This factor accounts for the variation in the density of nuclear targets within the ice shelf. Weight values are further modified to account for effects of regeneration, wherein produced by the charged current interaction of quickly decay to produce a at lower energy (and longer interaction length) en route to the detector, as described in [50].
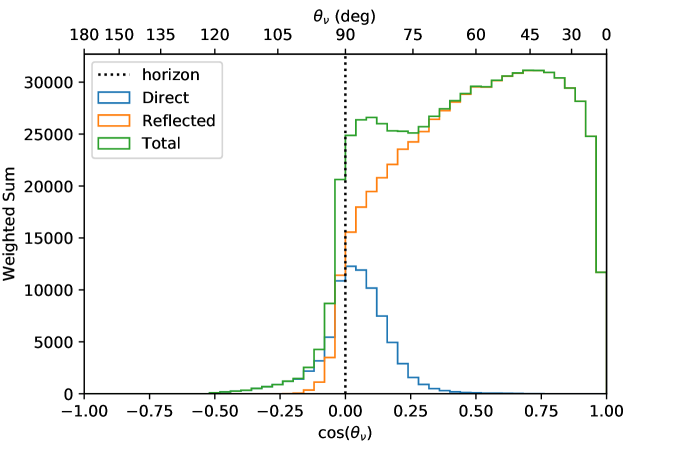
The Askaryan signal amplitude falls rapidly off the Cherenkov cone, especially at high frequencies. This limits the arrival direction for triggering neutrinos such that the signal path to the detector must lie close to the Cherenkov cone. This constrains the arrival direction to be near horizontal for direct signals, but the reflection at the ice/sea boundary allows for neutrinos from the entire sky to potentially trigger. This effect is illustrated in Fig. 5.
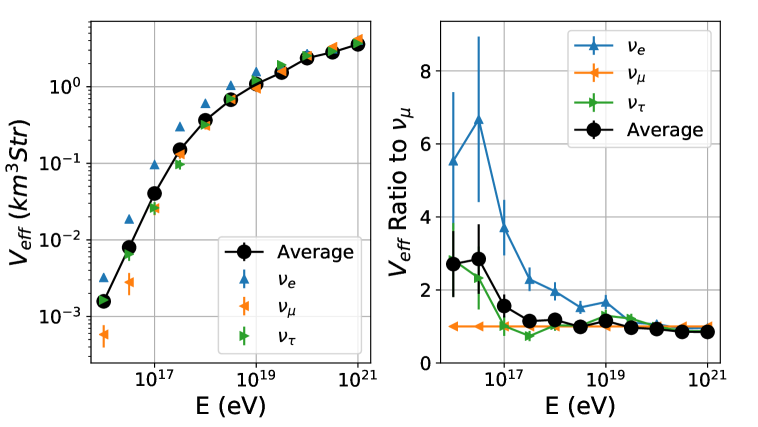
Electromagnetic showers resulting from charged current interactions are elongated due to the LPM effect, which is treated in the simulation as a narrowing of the Cherenkov cone width, according to [51]. It is expected that this picture is complicated at shower energies above because the electromagnetic component breaks into multiple sub-showers (see [52] and references therein). In this work, simulated elongation of the EM shower effectively eliminates their contribution to the effective volume above (see Fig. 6). This treatment avoids the complication of event-by-event variations in the highest energy EM showers, leading to an underestimation of the effective volume for charge current interactions at the highest energies.
The ice shelf is modeled as having an exponential density profile [30, 53], which leads to the following dependence of index of refraction with depth:
| (3.1) |
As the index of refraction changes with depth, it causes the signal ray path to bend, and creates a region in which signal can not propagate to the detector, which is referred to here as the "shadow zone." Recent measurements show that it is, in fact, possible to measure signals generated within this zone [53]. However, only a small fraction of the Askaryan signal couples into such a propagation mode such that the influence of shadow zone signals on the effective volume is small. An exception might be very high energy events where sufficient energy fluence is channeled into this propagation mode [54]. For this analysis, no interaction vertices are generated in the shadow zone. In the shelf-mc code, the shadow zone boundary is calculated via a numerical ray tracing technique using the density profile from Eq. (3.1). For emitter positions outside the shadow zone, the signal ray path is approximated with two straight line segments where the ray is refracted once at a depth corresponding with the bottom of the firn (for more details see [28]).
| Parameter | Setting |
|---|---|
| Spectrum | GZK |
| Energy Range | - |
| Ice Thickness | |
| C (see Eqn. 3.1) | |
| Firn Depth | |
| Depth Averaged Attenuation Length | |
| Noise Temperature | |
| Bandwidth | 50 - |
| Noise Before Trigger | Disabled |
| Reflection Coefficient | 0.9 |
| Trigger Threshold | |
| Majority Logic | 2 of 4 |
| Tau Regeneration | Enabled |
| Shadowing | Enabled |
For effective volume simulations, neutrinos at several energies are simulated, and the weighted number of triggers is used to calculate the water-equivalent effective volume according to
| (3.2) |
where is the fiducial volume, is the total number of simulated events, and are the weights of the triggered neutrinos. The normalization factor of corresponds to an integration over the solid angle of the simulation. This is a typical choice for expressing the sensitivity to a diffuse/isotropic flux, which is the primary interest of this analysis. The effective volume for a single ARIANNA test bed station is shown in Fig. 6.
3.4 Neutrino Signal Simulation
In order to model the sensitivity of the ARIANNA detector, it is first necessary to generate a population of simulated neutrino signals from Monte Carlo. For this purpose, one billion neutrino interactions were simulated in ShelfMC with a GZK energy spectrum from [55], using a detector configuration matching the currently deployed ARIANNA test bed stations in Moore’s Bay (see Table 1 for details). This produced a sample of approximately 1.3 million events which triggered the simulated station at a level above the thermal noise .
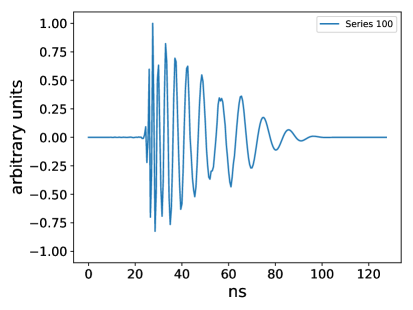
To produce the time domain signal for neutrino events, a template procedure is used. Neutrino templates are generated which incorporate the direction dependent response of the LPDA’s as well as the amplifier response, according to the procedure in [56]. Templates are spaced in increments in E-plane and H-plane angle of the antenna (see Fig. 1 of [56] for a definition of the E and H plane of the LPDA), and increments in viewing angle. Two versions of the ARIANNA amplifiers are in use in the pilot array (see Sec. 2.6), which have slight differences in their impulse response. To account for these differences, separate templates are constructed for each type of amplifier (see Fig. 7 for example templates), and the stations are analyzed separately. For each triggered ShelfMC event, the arrival direction and polarization relative to the antenna orientation, and the viewing angle relative to the Cherenkov cone are used to choose the most appropriate template. The template is then scaled according to the appropriate amplitude, and finite bandwidth random noise is added. This data is converted to the same format as typical ARIANNA data, and run through exactly the same analysis as the triggered events.

4 Analysis
A search for neutrino signal was carried out using all available data as described in Sec. 3. The methods and results from this analysis are discussed in detail in this section.
4.1 Definition of Analysis Variables
The main technique for the separation of signal and background in this analysis is a template matching procedure, similar to that which was carried out in [16]. The signal on each channel is compared to a specific reference template, shown in Fig. 7. The signal is shifted in time relative to the template until the absolute value of the Pearson correlation coefficient is maximized. This maximum value, , is a measure of similarity between the signal and reference template, with values ranging from 0 (no correlation) to 1 (identically similar). After calculating for each channel, we combine the results into a single parameter per event, , which is the greater of the two averages between co-polarized pairs of LPDA’s. High values of essentially imposes a condition that pairs of antennas see similar signals, which is expected, as the neutrino signal does not significantly change over the separation of the antennas.
By also considering the signal amplitude, it is possible to leverage the general behavior that a high signal-to-noise ratio (SNR) neutrino signal event is likely to have a larger value of . This greater discriminating power for large amplitude events raises the analysis efficiency. In this text the SNR of an event will be defined as , where is the peak-to-peak amplitude and is the root-mean-squared voltage of minimum bias noise events.
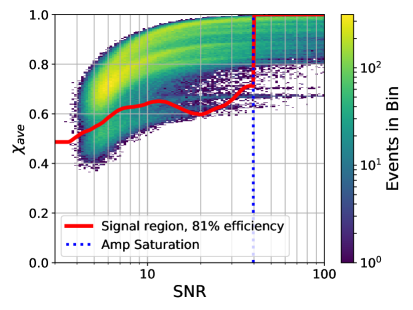
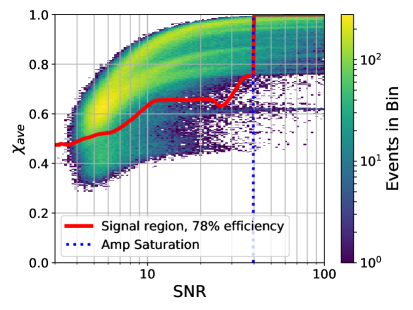
We create a 2D parameter space using and SNR in which we will define a signal region for this analysis. Analysis in a space of template correlation vs amplitude has previously been successfully used to identify cosmic-ray air showers in ARIANNA stations [41]. The distribution of the simulated neutrino signal in this space is shown in Fig. 8.
4.2 Defining the Signal Region
We present the ARIANNA test bed data (cf. Sec. 3) in the and SNR space in Fig. 9. The data itself is used to define a signal region that maximizes the analysis power, i.e., achieves a high neutrino signal efficiency while rejecting background events efficiently.
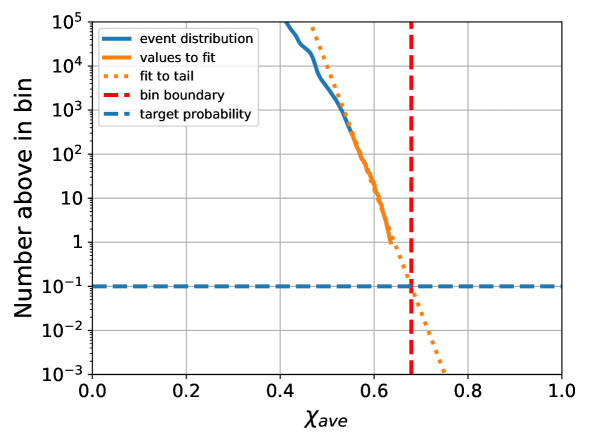
We can safely assume that the vast majority of all triggered events are background, and therefore use the data to estimate the background distribution in our 2D parameters space and SNR. We bin the data in SNR bins of . For each bin we calculate the cumulative histogram in , i.e., calculate how many events are present with greater than or equal to a certain value. For illustration purposes we show one of these distributions in Fig. 10. The tail of the cumulative distribution, except for the single highest value, is fit to a power law, and extrapolated to calculate the expected number of background events at higher thresholds, extending a technique employed in [16].
We calculate the thresholds for each SNR bin that result in an expectation of a total of 0.5 background events that pass the signal cut over the total livetime. We treated both amplifier types separately with the expected number of background events for each set weighted by the fraction of the total livetime contribution by that station type. We weighted each SNR bin by the fraction of expected neutrino events in the bin (from Fig. 8). The resulting curve is then smoothed by a second order Savitzky-Golay filter [57] and shown as red curve in Fig. 8 and 9. This procedure effectively produces a curve of constant signal to background ratio.
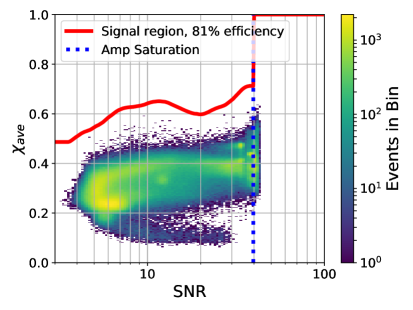
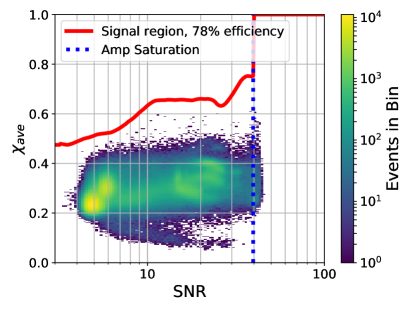
The signal region defined through this procedure contains no triggered events on any ARIANNA station during the complete run, so we conclude that no neutrinos were observed (Fig. 9). The analysis efficiency of the signal region, which is the fraction of weighted simulated neutrinos which fall above the cutoff is 81% for the 100 series stations and 78% for the 200 series.
4.3 Limits on the Diffuse UHE Neutrino Flux
In the absence of observed events in the signal region, a model independent 90% confidence upper limit on the diffuse neutrino flux is given by,
| (4.1) |
where is the energy of the neutrino, is the bin width (set to 1 decade), is the effective volume of a single ARIANNA station averaged over all flavors, is the water equivalent neutrino interaction length calculated using the cross section in [61], and and are, respectively, the total livetime and the analysis efficiency for each ARIANNA station i. for each station is given by the analysis efficiency for stations with that amplifier type, as calculated in Sec. 4.2. for each station is the useful livetime collected, according to the conditions outlined in Sec. 3.2. is the Feldman Cousins 90% confidence upper limit for 0 measured events and an expected background of 0 events in each decade-wide energy bin [62]. Though the expected background is estimated to be 0.5 events over the entire energy interval, or approximately 0.08 events per decade energy bin, we chose to set the expected number of background events per energy bin to 0. This procedure produces a slightly larger upper limit than a more accurate calculation that computes the expected background in each energy bin.
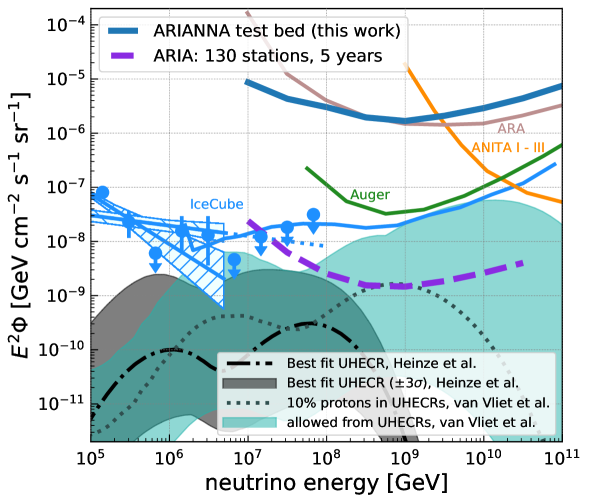
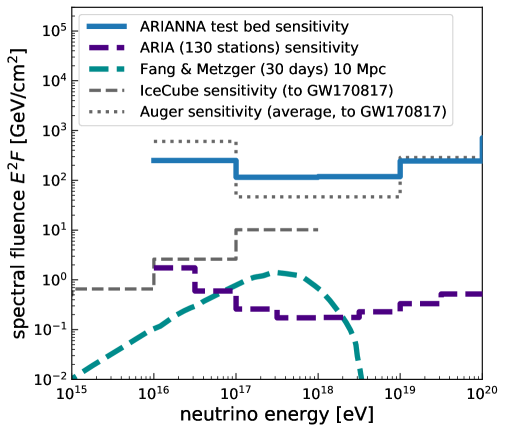
The results of this calculation for the seven stations of the ARIANNA test bed are shown in Fig. 11. For a decade wide logarithmic bin centered at a neutrino energy of eV, the 90% confidence upper limit is . While the diffuse flux limit from the test bed is not competitive with the current state of the art, it represents an order of magnitude improvement over the previous published limit from the ARIANNA collaboration [16] and demonstrates the long-term reliability of the ARIANNA hardware in-situ.
Also shown in Fig. 11 is a projected limit from an optimized array based on ARIANNA technologies (the ARIA proposal [17]). This optimized design achieves greater effective volume per station by lowering thresholds to (by a more advanced L1 trigger on the FPGA) and taking advantage of the colder ice at the South Pole. Assuming that such an array could operate at 100% uptime on a wired power grid or through a combination of solar and wind power, a 5 year run would be sensitive enough to limit the proton fraction of the highest energies to 10% or less [17].
4.4 Transient Event Sensitivity
As equation 4.1 shows, the flux sensitivity for diffuse sources depends on effective volume and time, which benefits from the steady accumulation of livetime over years of operation. However, the sensitivity to a specific transient point source depends solely on effective volume and whether the object is in the field-of-view.
The transient source sensitivity of the seven station ARIANNA test bed is fairly uniform over the entire upward sky (Figs. 5 and 1). It is comparable to the shown limit from the Auger collaboration in the direction of the neutron star merger GW170817 (Fig. 12). Already now, benefiting from the large sky coverage and realtime data transfer, ARIANNA provides useful information on transient events (see e.g. [65]). A future detector based on ARIANNA technologies [17] can deliver unparalleled sensitivity to transient sources within its field of view.
4.5 Impact of Site Location on Analysis
The deployment of the ARIANNA demonstrator station SP-1 approximately from the Amundsen-Scott Station at the South Pole (see Sec. 2.9 for more detail) creates the opportunity to assess the effect of the different RF backgrounds on analysis efficiency. For this purpose, data from runs where SP-1 (South Pole) and the cosmic-ray station at Site X (Moore’s Bay) were triggering on their downward facing antennas (i.e., searching for upward propagating radio signals from neutrinos) was selected. The data of both stations were analyzed by the same methods discussed above. These two stations were chosen for direct comparison because they are both constructed using an updated 8 channel version of the ARIANNA DAq board.
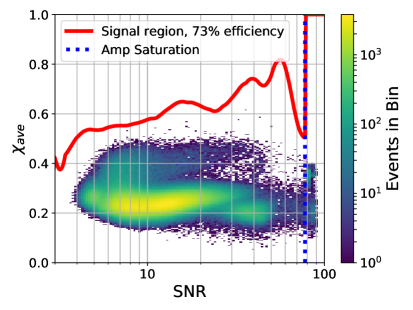
We present all triggered events in the 2D signal space ( vs. SNR) in Fig. 13. The signal region is calculated using the same procedure as described in Sec. 4.2, which we show as red curve in Fig. 13. We apply this signal cut to a dedicated simulation data set of SP-1 and find that SP-1 achieves a signal efficiency of 73% despite its close proximity to the Amundsen-Scott Station. A decommissioned ARA wind turbine also contributes to the background radio noise during wind gusts. These events were identified due to their consistent waveform properties and their arrival direction.
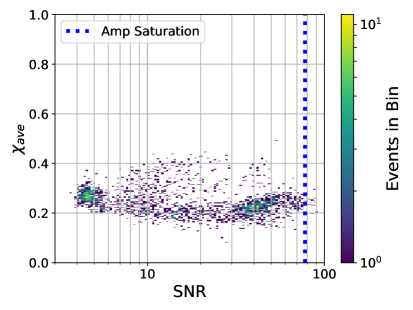
The same type of station at Site X in Moore’s Bay was operated for less that 40 days in neutrino trigger mode, so there are a limited number of triggered events to examine and compare. However, the distribution lacks any significant number of events with a value of and , so the expected analysis efficiency for a neutrino search would be significantly higher.
5 Conclusion
The operation of the ARIANNA test bed at Moore’s Bay, since its completion in November 2014, has provided a robust proof of concept for an in-situ, radio-based UHE neutrino detector. Iterative improvements in data acquisition and power systems since the first ARIANNA prototypes [15] and initial test bed stations [29] have improved reliability and livetime. We have presented the analysis of 4.5 years of data, leading to a 90% confidence upper limit on the diffuse neutrino flux of for a decade wide logarithmic bin centered at a neutrino energy of eV.
Since each ARIANNA station serves as an autonomous and self-contained detector, this platform can be deployed at sites in both the northern and southern hemisphere to attain full sky coverage. Near-surface detectors allow for the easy installation of high-gain antennas in any polarization, providing increased information for precise event reconstruction.
We have demonstrated that a simple template matching procedure is capable of rejecting all observed backgrounds over the operation of the test bed, while maintaining a combined signal efficiency of 79% at a trigger threshold in amplitude. Future detectors will make use of more advanced triggering and analysis techniques to push the sensitivity threshold lower, and increase the effective volume per station.
The near-surface design of ARIANNA station provides the essential tools to contribute to the multi-messenger revolution in high energy astrophysics: reliable operation, pointing, wide-field of view, energy and real-time identification of neutrino candidates. ARIANNA can fully participate in campaigns involving multi-wavelength (radio to gamma-ray), gravitational wave, and cosmic ray observations, with the goal of establishing both the sources of the most energetic particles known, and the mechanisms that are responsible for producing particles of extreme energy.
6 Acknowledgements
We are grateful to the U.S. National Science Foundation-Office of Polar Programs, the U.S. National Science Foundation-Physics Division (grant NSF-1607719) for granting the ARIANNA array at Moore’s Bay. Without the invaluable support of the people at McMurdo, the ARIANNA stations would have never been built.
We acknowledge funding from the German research foundation (DFG) under grants GL 914/1-1 (CG), NE 2031/1-1, and NE 2031/2-1 (DGF, ANe, IP, CW) and the Taiwan Ministry of Science and Technology (JN, SHW). HB acknowledges support from the Swedish Government strategic program Stand Up for Energy. EU acknowledges support from the Uppsala university Vice-Chancellor’s travel grant (sponsored by the Knut and Alice Wallenberg Foundation) and the C.F. Liljewalch travel scholarships. DB and ANo acknowledge support from the MEPhI Academic Excellence Project (Contract No. 02.a03.21.0005) and the Megagrant 2013 program of Russia, via agreement 14.12.31.0006 from 24.06.2013.
References
- [1] Francesco Fenu for the Pierre Auger collaboration, The cosmic ray energy spectrum measured using the Pierre Auger Observatory, in Proceedings of 35th International Cosmic Ray Conference — PoS(ICRC2017)486, 2017, DOI.
- [2] K. Greisen, End to the cosmic-ray spectrum?, Physical Review Letters 16 (1966) 748.
- [3] G. Zatsepin and V. Kuz’min, Upper limit of the spectrum of cosmic rays, JETP Letters 4 (1966) 78.
- [4] M. Ackermann et al., Astrophysics Uniquely Enabled by Observations of High-Energy Cosmic Neutrinos, Bull. Am. Astron. Soc. 51 (2019) 185.
- [5] F. W. Stecker, Ultrahigh Energy Photons, Electrons, and Neutrinos, the Microwave Background, and the Universal Cosmic-Ray Hypothesis, Astrophysics and Space Science 20 (1973) 47.
- [6] V. Beresinsky and G. Zatsepin, Cosmic rays at ultra high energies (neutrino?), Physics Letters B 28 (1969) 423.
- [7] IceCube collaboration, Differential limit on the extremely-high-energy cosmic neutrino flux in the presence of astrophysical background from nine years of IceCube data, Physical Review D 98 (2018) 062003.
- [8] ANITA collaboration, Constraints on the diffuse high-energy neutrino flux from the third flight of ANITA, Physical Review D 98 (2018) 022001.
- [9] RICE collaboration, Updated results from the RICE experiment and future prospects for ultra-high energy neutrino detection at the south pole, Physical Review D 85 (2012) .
- [10] C. Kopper for the IceCube collaboration, Observation of astrophysical neutrinos in six years of IceCube data, in Proceedings of 35th International Cosmic Ray Conference — PoS(ICRC2017)981, 2017, DOI.
- [11] C. Haack and C. Wiebusch for the IceCube collaboration, A measurement of the diffuse astrophysical muon neutrino flux using eight years of IceCube data., in Proceedings of 35th International Cosmic Ray Conference — PoS(ICRC2017)1005, 2017, DOI.
- [12] IceCube collaboration, Multimessenger observations of a flaring blazar coincident with high-energy neutrino IceCube-170922a, Science (2018) eaat1378.
- [13] IceCube collaboration, Neutrino emission from the direction of the blazar TXS 0506+056 prior to the IceCube-170922a alert, Science (2018) eaat2890.
- [14] M. Ahlers and F. Halzen, Opening a new window onto the universe with IceCube, Progress in Particle and Nuclear Physics 102 (2018) 73.
- [15] L. Gerhardt et al., A prototype station for ARIANNA: A detector for cosmic neutrinos, Nuclear Instruments and Methods in Physics Research Section A 624 (2010) 85 .
- [16] ARIANNA collaboration, A first search for cosmogenic neutrinos with the ARIANNA Hexagonal Radio Array, Astroparticle Physics 70 (2015) 12.
- [17] ARIANNA collaboration, Targeting ultra-high energy neutrinos with the ARIANNA experiment, Adv. Space Res. 64 (2019) 2595 [1903.01609].
- [18] ARIANNA collaboration, Neutrino vertex reconstruction with in-ice radio detectors using surface reflections and implications for the neutrino energy resolution, Journal of Cosmology and Astroparticle Physics 11 (2019) 030 [1909.02677].
- [19] C. Glaser for the ARIANNA collaboration, Neutrino direction and energy resolution of Askaryan detectors, in Proceedings of 36th International Cosmic Ray Conference — PoS(ICRC2019)899, 2019.
- [20] IceCube collaboration, Constraints on Ultrahigh-Energy Cosmic-Ray Sources from a Search for Neutrinos above 10 PeV with IceCube, Physical Review Letters 117 (2016) 241101.
- [21] ARA collaboration, Performance of two Askaryan Radio Array stations and first results in the search for ultrahigh energy neutrinos, Physical Review D 93 (2016) 082003.
- [22] GRAND collaboration, The giant radio array for neutrino detection (GRAND): Science and design, 1810.09994.
- [23] J. Nam for the ARIANNA and TAROGE collaborations, High-elevation synoptic radio array for detection of upward moving air-showers, deployed in the antarctic mountains, in Proceedings of 36th International Cosmic Ray Conference — PoS(ICRC2019)967, 2019.
- [24] S.Wissel et al., Concept Study for the Beamforming Elevated Array for Cosmic Neutrinos (BEACON), in Proceedings of the 36th International Cosmic Ray Conference (ICRC2019), 2019.
- [25] S.-H. Wang for the ARIANNA and TAROGE collaborations, Status, Calibration, and Cosmic Ray Detection of ARIANNA-HCR Station, in Proceedings of 36th International Cosmic Ray Conference — PoS(ICRC2019)462, 2019.
- [26] G. A. Askar’yan, Coherent Radio Emission from Cosmic Showers in Air and in Dense Media, Soviet Journal of Experimental and Theoretical Physics 21 (1965) 658.
- [27] ANITA collaboration, Observations of the Askaryan Effect in Ice, Physical Review Letters 99 (2007) 171101.
- [28] C. Persichilli, Performance and Simulation of the ARIANNA Pilot Array, with Implications for Future Ultra-high Energy Neutrino Astronomy, Ph.D. thesis, University of California, Irvine, 2018.
- [29] ARIANNA collaboration, Design and Performance of the ARIANNA HRA-3 Neutrino Detector Systems, IEEE Transactions on Nuclear Science 62 (2015) 2202.
- [30] J. C. Hanson et al., Radar absorption, basal reflection, thickness and polarization measurements from the Ross Ice Shelf, Antarctica, Journal of Glaciology 61 (2015) 438.
- [31] U. Katz, KM3NeT: Towards a km3 Mediterranean neutrino telescope, Nuclear Instruments and Methods in Physics Research Section A 567 (2006) 457 .
- [32] A. Avrorin et al., The prototyping/early construction phase of the BAIKAL-GVD project, Nuclear Instruments and Methods in Physics Research Section A 742 (2014) 82 .
- [33] “Google Maps.” [Online https://www.google.com/maps/@-78.3853509,163.1242104,196008m/data=!3m1!1e3; accessed 27-August-2018], 2018.
- [34] “Afar communications inc..” [Online http://afar.net/; accessed 25-July-2019].
- [35] “Create design corp..” [Online http://www.cd-corp.com/english/; accessed 25-July-2019].
- [36] T. Prakash, A Fully-Synchronous Multi-GHz Analog Waveform Recording And Triggering Circuit, Ph.D. thesis, University of California, Irvine, 2017.
- [37] E. Chiem, Multi-Gigahertz Synchronous Sampling and Triggering (SST) Circuit with Picosecond Timing Resolution, Ph.D. thesis, University of California, Irvine, 2017.
- [38] G. Gaswint for the ARIANNA collaboration, New results on angular reconstruction of deep pulser radio signals, in Proceedings of the 36th International Cosmic Ray Conference (ICRC2019), 2019.
- [39] C. Persichilli for the ARIANNA collaboration, Radio search for EHE neutrinos with the ARIANNA pilot array, and ARIANNA performance projections, in Proceedings of The 35th International Cosmic Ray Conference — PoS(ICRC2017)977, 2017.
- [40] A. Nelles for the ARIANNA collaboration, A wind-turbine for autonomous stations for radio detection of neutrinos, in Proceedings of 36th International Cosmic Ray Conference — PoS(ICRC2019)968, 2019.
- [41] ARIANNA collaboration, Radio detection of air showers with the ARIANNA experiment on the Ross Ice Shelf, Astroparticle Physics 90 (2017) 50.
- [42] A. Nelles for the ARIANNA collaboration, Cosmic-ray detection with and novel reconstruction algorithms for the ARIANNA experiment, in Proceedings of 36th International Cosmic Ray Conference — PoS(ICRC2019)366, 2019.
- [43] C. Welling, C. Glaser and A. Nelles, Reconstructing the cosmic-ray energy from the radio signal measured in one single station, JCAP 1910 (2019) 075 [1905.11185].
- [44] S. H. Wang for the ARIANNA collaboration, Calibration, Performance, and Cosmic Ray Detection of ARIANNA-HCR Prototype Station, in Proceedings of The 35th International Cosmic Ray Conference — PoS(ICRC2017)358, 2017.
- [45] ARA collaboration, Design and initial performance of the Askaryan Radio Array prototype EeV neutrino detector at the South Pole, Astroparticle Physics 35 (2012) 457.
- [46] ANITA collaboration, HiCal 2: An instrument designed for calibration of the ANITA experiment and for antarctic surface reflectivity measurements, Nuclear Instruments and Methods in Physics Research Section A 918 (2019) 60 .
- [47] ANITA collaboration, The Simulation of the Sensitivity of the Antarctic Impulsive Transient Antenna (ANITA) to Askaryan Radiation from Cosmogenic Neutrinos Interacting in the Antarctic Ice, JINST 14 (2019) P08011 [1903.11043].
- [48] J. Alvarez-Muñiz, R. A. Vázquez and E. Zas, Calculation methods for radio pulses from high energy showers, Physical Review D 62 (2000) .
- [49] E. Zas, F. Halzen and T. Stanev, Electromagnetic pulses from high-energy showers: Implications for neutrino detection, Physical Review D 45 (1992) 362.
- [50] F. Halzen and D. Saltzberg, Tau neutrino appearance with a 1000 megaparsec baseline, Physical Review Letters 81 (1998) 4305.
- [51] J. Alvarez-Muñiz and E. Zas, The LPM effect for EeV hadronic showers in ice: implications for radio detection of neutrinos, Physics Letters B 434 (1998) 396.
- [52] L. Gerhardt and S. R. Klein, Electron and photon interactions in the regime of strong Landau-Pomeranchuk-Migdal suppression, Physical Review D 82 (2010) 074017.
- [53] S. Barwick et al., Observation of classically “forbidden” electromagnetic wave propagation and implications for neutrino detection., Journal of Cosmology and Astroparticle Physics 2018 (2018) 055.
- [54] R. Lahmann for the ARIANNA collaboration, Investigations of ice and emitter properties from radio signals recorded with arianna, in Proceedings of the 36th International Cosmic Ray Conference (ICRC2019), 2019.
- [55] R. Engel, D. Seckel and T. Stanev, Neutrinos from propagation of ultrahigh energy protons, Physical Review D 64 (2001) .
- [56] ARIANNA collaboration, Time-domain response of the ARIANNA detector, Astroparticle Physics 62 (2015) 139.
- [57] A. Savitzky and M. J. E. Golay, Smoothing and differentiation of data by simplified least squares procedures., Analytical Chemistry 36 (1964) 1627.
- [58] Pierre Auger collaboration, Improved limit to the diffuse flux of ultrahigh energy neutrinos from the Pierre Auger Observatory, Physical Review D 91 (2015) 092008.
- [59] A. van Vliet, R. Alves Batista and J. R. Hörandel, Determining the fraction of cosmic-ray protons at ultrahigh energies with cosmogenic neutrinos, Phys. Rev. D100 (2019) 021302.
- [60] J. Heinze, A. Fedynitch, D. Boncioli and W. Winter, A New View on Auger Data and Cosmogenic Neutrinos in Light of Different Nuclear Disintegration and Air-shower Models, The Astrophysical Journal 873 (2019) 88.
- [61] A. Connolly et al., Calculation of high energy neutrino-nucleon cross sections and uncertainties using the Martin-Stirling-Thorne-Watt parton distribution functions and implications for future experiments, Physical Review D 83 (2011) 113009.
- [62] G. J. Feldman and R. D. Cousins, Unified approach to the classical statistical analysis of small signals, Physical Review D 57 (1998) 3873.
- [63] A. Albert et al., Search for High-energy Neutrinos from Binary Neutron Star Merger GW170817 with ANTARES, IceCube, and the Pierre Auger Observatory, The Astrophysical Journal 850 (2017) L35.
- [64] K. Fang and B. D. Metzger, High-energy Neutrinos from Millisecond Magnetars Formed from the Merger of Binary Neutron Stars, The Astrophysical Journal 849 (2017) 153.
- [65] C. Glaser, S. Barwick, G. Gaswint and C. Persichilli, GRB 190114C: Search for ultra-high-energy neutrinos with ARIANNA, The Astronomer’s Telegram 12475 (2019) 1.