Your Smart Home Can’t Keep a Secret:
Towards Automated Fingerprinting of IoT Traffic with Neural Networks
Abstract.
The IoT (Internet of Things) technology has been widely adopted in recent years and has profoundly changed the people’s daily lives. However, in the meantime, such a fast-growing technology has also introduced new privacy issues, which need to be better understood and measured.
In this work, we look into how private information can be leaked from network traffic generated in the smart home network. Although researchers have proposed techniques to infer IoT device types or user behaviors under clean experiment setup, the effectiveness of such approaches become questionable in the complex but realistic network environment, where common techniques like Network Address and Port Translation (NAPT) and Virtual Private Network (VPN) are enabled. Traffic analysis using traditional methods (e.g., through classical machine-learning models) is much less effective under those settings, as the features picked manually are not distinctive any more.
In this work, we propose a traffic analysis framework based on sequence-learning techniques like LSTM and leveraged the temporal relations between packets for the attack of device identification. We evaluated it under different environment settings (e.g., pure-IoT and noisy environment with multiple non-IoT devices). The results showed our framework was able to differentiate device types with a high accuracy. This result suggests IoT network communications pose prominent challenges to users’ privacy, even when they are protected by encryption and morphed by the network gateway. As such, new privacy protection methods on IoT traffic need to be developed towards mitigating this new issue.
1. Introduction
The Internet of Things (IoT) have been gaining popularity increasingly in recent years, and continue to expand in areas such as smart homes, smart cities, industrial systems, connected health products, and so on. According to reports from Forbes, the global IoT market will grow from 157 billion US dollars in 2016 to 457 billion US dollars by 2020, attaining a Compound Annual Growth Rate (CAGR) of 28.5% (url, 2019a).
Smart home is a prominent use case of IoT, where multiple IoT devices work together to facilitate all kinds of user activities by sensing surroundings, interpreting human commands and providing feedback. However, smart home can introduce new threats to residents’ privacy. Since network packets between IoT device and remote server can be eavesdropped, a motivated attacker can leverage such data to infer private information about the residents, like what IoT devices are installed and whether they are active. Leaking such information would cause grave consequences to the residents: e.g., a theft can break into the home when no one is inside by learning the status of the installed smart switch.
This paper aims to assess the privacy threat to smart home residents by evaluating different traffic-analysis approaches on datasets carrying real IoT traffic. Though a few recent works also investigated the privacy issues related to IoT network communications (Apthorpe et al., 2017a; Sivanathan et al., 2017; Acar et al., 2018), those works all assume a local adversary (only the traffic between IoT device and gateway can be sniffed) or relatively simple network environment (e.g., traffic from devices can be easily separated). Whether traffic analysis is effective under a remote adversary or more complex network is not yet assessed. In particular, we assume that the the gateway may enable configurations that are common but hamper traffic analysis, like Virtual Private Network (VPN) and Network Address and Port Translation (NAPT). Under those settings, traffic flows belonging to different IoT devices could be merged to a single flow and the valuable information from fields like destination ports could be erased. Still, our study shows by exploiting the temporal relations between packets of an individual device, the device can be reliably identified.
More specifically, we found such temporal relations can be modeled by sequence model LSTM-RNN when grouping consecutive packets into a traffic window. We carefully designed the structure of both models and evaluated on two datasets filled with traffic generated from off-the-shelf IoT devices and non-IoT devices. The evaluation results show our models can achieve better accuracy comparing to the models widely used by existing works, like Random Forest. To highlight a few, our bidirectional LSTM model can achieve an accuracy of 99.2% and 97.7% on IoT devices in NAPT and VPN configuration. Even when a large-amount of non-IoT traffic are generated at the same time, it can still achieve 92.1% and 81.0% accuracy in these two configurations.
Contributions. We summarize the technical contributions made by this work as below.
-
(1)
We present a traffic-analysis system, HomeMole, to automatically infer the IoT devices behind a smart home network even when traffic fusion like NAPT and VPN are enabled. We designed a basic LSTM model and a bidirectional LSTM model that are able to identify IoT devices based on the sniffed packets.
-
(2)
We evaluated our system under two network configurations (NAPT and VPN) and two scenarios (pure-IoT and noisy environment). The results indicate that our framework could achieve high accuracy under those settings. Our models outperform the baseline model, Random Forest, due to the ability of modeling the temporal relations between packets.
To facilitate the research in this domain, we will release our datasets, together with models we built. We believe by releasing datasets and models, we could help other researchers to investigate new traffic-analysis methods and IoT community to build better defense.
Paper organization. The paper is organized as follows: Section 2 presents the background about the relevant previous work, smart home network, our adversary model and neural networks used in our paper. Section 3 describes the insights into IoT traffic, and the design of our framework. Section 4 presents the experimental results of our framework in different scenarios. Section 5 discusses the limitations of this work. In the end, we conclude this study in Section 6.
2. Background
2.1. Related Work
Network traffic classification. Network traffic analysis has been shown reasonably effective when applied on anomaly detection (Huang et al., 2014; Yu et al., 2014), software identification (Panchenko et al., 2016; Rimmer et al., 2018; Aksoy et al., 2017), individual user fingerprinting (Vassio et al., 2017; Verde et al., 2014) and etc. At a high level, the techniques used in existing applications fall into the following two directions: deep packet inspection and side-channel inference.
Deep packet inspection(DPI) is effective for packet classification and intrusion detection when the network traffic is unencrypted. Bujlow et al. (Bujlow et al., 2015) conducted a comparison among 6 well-known DPI tools and found that the commercial DPI tool achieves very good performance in traffic classification. However, DPI-based approaches become ineffective when it applied on encrypted traffic. A lot of works have been proposed to analyze such traffic (Wright et al., 2009; Dyer et al., 2012; Sun et al., 2002; Bissias et al., 2005; Liberatore and Levine, 2006) by utilizing the side-channel information and metadata, like source and destination IP address, port and packet size. Apart from that, previous works like (Srinivasan et al., 2008) also show other side-channel information, such as wireless signal strength and timing, can be leveraged to infer user activities. Machine learning based techniques have shown many successes for traffic classifications. For example, Taylor et al. (Taylor et al., 2016) proposed an identification framework for smartphone apps called AppScanner, which extracts statistical features from network flows for classification tasks. Trained by different learning algorithms, AppScanner can reach a highest accuracy of 99.8% on 110 Apps. Chen et al. (Chen et al., 2017) proposed an online traffic classification framework which utilizes kernel methods and deep neural networks. They tested their tool on 5 different protocols and 5 mobile applications and achieved 99.84% and 88.43% correspondingly. However, those two approaches only works on relatively simple network environment where none of NAT or VPN is enabled.
Traffic classification in IoT domain. Following the rapid development of the IoT ecosystem, how to characterize and fingerprint of IoT devices has become a trending topic. There have been some works on IoT traffic analysis (Sivanathan et al., 2017; Apthorpe et al., 2017b; Siby et al., 2017; Martín et al., 2017; Apthorpe et al., 2017a; Miettinen et al., 2017) proposed in recent years. Siby et al. (Siby et al., 2017) captured radio signals emitted from IoT devices and created a system to store and visualize the traffic. Recently, Apthorpe et al. (Apthorpe et al., 2017a) performed case studies on four IoT devices, and show they exhibit distinctive traffic features, which could enable device identification and behavior inference. Marcus et al. (Miettinen et al., 2017) extracted 23 features from raw packets including network protocols from Link layer to Application layer, IP options, IP addresses and ports. However, part of their features are inaccessible in our settings due to the adversary capabilities and complex network configurations (NAPT, VPN). For example, ARP and LLC are only capturable in local area network environment, SSDP and MDNS protocols account for only small amount of traffic that cannot holistically describe the network status. Compared with them, our model only takes advantage of 10 features extracted from packet metadata which are illustrated elaborately in Section 3. Sivanathan et al. (Sivanathan et al., 2017) collected network traces of more than 20 IoT devices in a campus environment over 3 weeks and characterized the profiles of those IoT devices according to their traffic patterns. It also relies on an extensive feature engineering to select the salient features and some of them become vain when a complex network setting is applied, like NAPT and VPN.
2.2. Smart Home Network
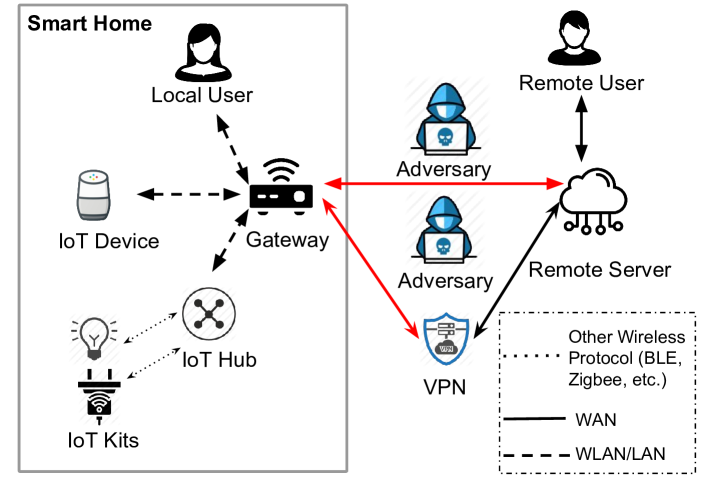
We assume the network communication within a smart home involves four parties: IoT device, service provider, gateway and the user. The communication schema is illustrated in Figure 1. Below we briefly overview their communication schema.
-
•
The first type of IoT device senses the surrounding environment and sends notifications to its associated listeners, either periodically or immediately when the event takes place. For example, Samsung ST Motion Sensor detects when a person approaches in proximity (url, 2019g) and notifies other IoT devices. Another type of IoT device is IoT hub, which acts as the “brain” (centroid controller) for other IoT devices (or IoT kits) in the close range. IoT hub is necessary in order to control IoT devices that use low-power protocols like BLE. Both regular IoT device and IoT hub can be controlled by user’s commands sent remotely or locally.
-
•
The IoT device interacts with the service provider operated by its manufacturer through Internet communications. The service provider is responsible for request handling and resource relaying. To reduce the operational cost, many device vendors have moved their services to the public cloud infrastructure and leverage the cloud analytics, like AWS IoT Core (url, 2019b), to process massive amount of IoT data.
-
•
A gateway is a bridge between in-home IoT devices and the remote service provider. A typical gateway (e.g., router) supplies two types of interfaces for in-home devices, WLAN and LAN. The communication with service provider is through WAN interface.
-
•
A user takes control of all smart devices in his/her home. There are usually two ways to interact with IoT devices, through mobile applications or human interactions (e.g., walking, talking, and touching).
Device identifier. IoT devices within the smart home network can be distinguished by device identifiers determined by specific network protocols. Each Wi-Fi device has a unique source IP address and MAC address. Though IoT kits might not get IP addresses in smart home if they are not using WiFi, they can still obtain identifiers from IoT hub through other protocols (e.g., NwkAddr for Zigbee devices and Resolvable Private Address for BLE devices).
2.3. NAPT and VPN
When the network traffic is observed between the gateway and the service provider, the original device identifiers may be obscured. Firstly, the gateway could strip off the source MAC address from the packets (mac, 2019). Even the port information can be changed under NAPT (Network Address and Port Translation) or VPN (Virtual Private Network). Below, we describe how changes are made by NAPT and VPN.
NAPT. To conserve the limited global IPv4 space, NAPT is developed to enable the sharing of one IP address among different devices. In particular, NAPT modifies the network-layer and transport-layer identifiers like destination IP address and destination port numbers of inbound packets(Srisuresh and Holdrege, 1999). For outbound packets, the source IP address and the source port are translated. In both cases, the IP address of a local device is replaced with the gateway’s IP address. The gateway using NAPT holds a translation table which records the mapping of addresses and ports so that packets will be routed to the right destination.
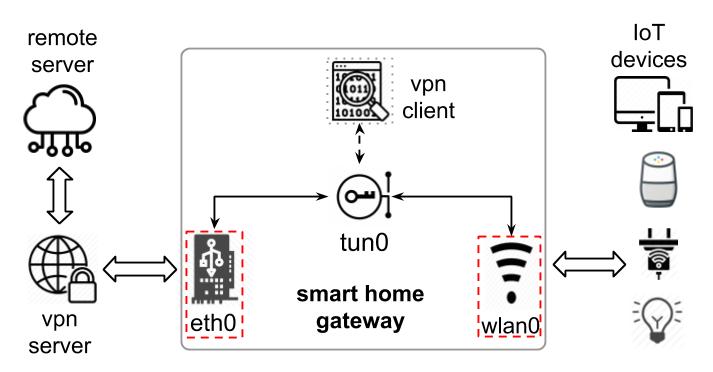
VPN. VPNs are often used to interconnect different networks to form a new network with a larger capacity (Gleeson et al., 2000). Based on the IP tunneling mechanism, hosts in different subnets can communicate with each other and the delivered information can be kept secret with authentication and encryption. Figure 2 shows the network structure after deploying a VPN-enabled gateway. Different from normal routers, a VPN-enabled gateway owns three network interfaces – wlan0, eth0 and tun0. Among them, wlan0 works as the entrance of LAN, collecting and delivering packets from local devices. The Ethernet interface eth0 holds the connection between the gateway and WAN. tun0 is created by VPN client process. For every packet from wlan0 to eth0, the VPN client first encrypts the original packet into a payload and constructs a new packet. The new packet is then delivered to a VPN server and gets decrypted. The VPN server then forwards restored packets to their original destinations. From the viewpoint of destination remote server, the original metadata like source IP and source port are completely hidden, which protects user’s privacy against on-path eavesdroppers.
2.4. Adversary Model
The goal of our adversary is to identify the active IoT devices in the targeted smart home. Such inference can leak sensitive information in a smart home. For example, an ISP can infer the device information and sell them to advertisers who like to do targeted advertising. Or a theft can pick the time when the user is not at home by sniffing the outbound traffic and inferring the status of the installed surveillance camera. To this end, in this paper we consider passive eavesdroppers who can observe the encrypted network traffic flowing between the gateway and the remote service. More importantly, there are two realistic settings that are not considered by prior works. On one hand, we assume that NAPTs or VPNs are enabled in the gateway so that the original device identifiers are replaced by the gateway’s and the traffic belonging to different devices are merged, even the contacted remote server becomes opaque to the adversary. On the other hand, we assume multiple devices (including IoT devices and non-IoT devices such as mobile phones and tablets) may work simultaneously such that their packets are interleaving. As shown in (Sivanathan et al., 2017), non-IoT devices usually have a higher rate in generating packets and their volume is larger than that of IoT devices, which means the existence of non-IoT devices can significantly distort the original statistical features learned on IoT devices.
Previous works (Apthorpe et al., 2017b; Acar et al., 2018; Taylor et al., 2016) assumed that the adversary can sniff traffic within the smart home network (i.e., local adversary) or traffic fusion is not performed by the gateway. In their scenarios, the flows from different devices are clearly separated based on device identifiers. Unlike previous works, the remote adversary in our study is more realistic and the traffic analysis is much more challenging to perform.
2.5. LSTM-RNN
Recently, deep neural network (DNN) has been gaining traction in the security domain and shown many promising results, given its capability of feature representation learning. For example, the research of Rimmer et al. demonstrated that websites visited by Tor users can be fingerprinted automatically with DNN (Rimmer et al., 2018).
Recurrent Neural Network (RNN) is one type of DNN that is good at handling temporal-related sequences. With multiple recurrent cells connected, the output of a previous cell can be passed to the current one. In this way, historical information is kept and forwarded. Among different implementations of RNN, LSTM(Long Short-Term Memory)-RNN has become a popular choice as it is able to address weakness of other RNNs like exploding and vanishing gradient. It provides a novel memory cell consisting of three different gates: input gate, forget gate and output gate. These gates are used to process the data transferred from previous memory cell and manipulate the current cell state. LSTM-RNN has achieved many successes in different areas, such as speech recognition (Graves et al., 2013), medical diagnose (Lipton et al., 2016) and system log analysis (Du et al., 2017). Figure 3 shows the structure of a basic LSTM-RNN.
Inspired by the recent research, we find our problem is a natural fit for LSTM-RNN models. Similar to system logs, traffic generated by IoT devices can be organized in chronological order. There exists contextual dependency between packets based on the running states of the device and such dependency can be modeled by LSTM-RMM models. In Section 3, we describe our LSTM-RNN models in details.

2.6. Adversary Model
The goal of our adversary is to identify the active IoT devices in the targeted smart home. Such inference can leak sensitive information in a smart home. For example, an ISP can infer the device information and sell them to advertisers who like to do targeted advertising. Or a theft can pick the time when the user is not at home by sniffing the outbound traffic and inferring the status of the installed surveillance camera. To this end, in this paper we consider passive eavesdroppers who can observe the encrypted network traffic flowing between the gateway and the remote service. More importantly, there are two realistic settings that are not considered by prior works. On one hand, we assume that NAPTs or VPNs are enabled in the gateway so that the original device identifiers are replaced by the gateway’s and the traffic belonging to different devices are merged, even the contacted remote server becomes opaque to the adversary. On the other hand, we assume multiple devices (including IoT devices and non-IoT devices such as mobile phones and tablets) may work simultaneously such that their packets are interleaving. As shown in (Sivanathan et al., 2017), non-IoT devices usually have a higher rate in generating packets and their volume is larger than that of IoT devices, which means the existence of non-IoT devices can significantly distort the original statistical features learned on IoT devices.
Previous works (Apthorpe et al., 2017b; Acar et al., 2018; Taylor et al., 2016) assumed that the adversary can sniff traffic within the smart home network (i.e., local adversary) or traffic fusion is not performed by the gateway. In their scenarios, the flows from different devices are clearly separated based on device identifiers. Unlike previous works, the remote adversary in our study is more realistic and the traffic analysis is much more challenging to perform.
3. System Design
In this section, we elaborate the design and implementation of our system, named HomeMole, for fingerprinting IoT traffic. The goal is to identify the active IoT devices in a smart-home environment based on their network traffic. Different from those doing fingerprinting at flow level(Taylor et al., 2016; Chen et al., 2017), HomeMole works at packet level, which means all the packets will be given a label after processed by our models. As such, HomeMole is able to work in online mode and give prompt results. In addition to device identification, HomeMole can also be used for other scenarios like QoS (Quantity of Service) and IDS (Intrusion Detection System), as shown in (Fraleigh et al., 2003; Mirsky et al., 2018).
Below, we first describe our insights into IoT traffic analysis in Section 3.1. Next, we elaborate how we set up the environment to collect data in Section 3.2. After that, we explain how we prepare datasets from raw collected packets in Section 3.3. Finally, we show the detailed structure of our models and why they are adequate for smart-home environment in Section 3.4.
3.1. Insights into IoT traffic
We carried out exploratory analysis on the realworld IoT devices and public dataset to characterize their network communication patterns. We identify several insights which highlight the uniqueness of IoT traffic comparing to the desktop and mobile traffic.
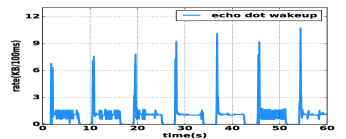
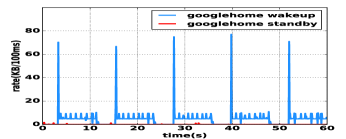
1) The devices belong to the same category have similar traffic patterns. As one example, we show the traffic patterns of Amazon Echo Dot and Google Voice Assistant (both are voice assistants) when they are waken up (see Figure 12 and Figure 12 in Appendix A). As can be seen, when the voice command is recognized, both of them generate a traffic burst, followed by a period of continuous communication with the remote server.
2) Heartbeat communication is prevalent. The service provider relies on the heartbeat messages sent by the IoT device to acquire liveness of the device. The heartbeat packets usually have constant size and interval, and different devices tend to use different modes for heartbeat. For example, Amazon Echo Dot sends a 95-byte heartbeat packet in TLSv1.2 format every 30 seconds, and Google Home sends two consecutive heartbeat packets in TLSv1.2 format every 60 seconds with the size of 135 bytes and 104 bytes. In addition, heartbeat communications are rarely disturbed by other activities happening on the devices. As such, they are good indicators to distinguish the categories or even manufacturers.
3) Protocol choices are diverse. The communication between devices and remote services must follow certain convention, which is reflected in the chosen protocols. In Table 1 we show such diversified choices in terms of packets ratio under different network protocols. Note that we only measure protocols at network layer, transmission layer and application layer, discarding those from lower layers. According to our statistics, most traffic captured by an attacker is IPv4-based. For devices with large volumes of traffic, like network camera, UDP is usually adopted. Compared with non-IoT devices, IoT devices generate much less HTTP traffic for communication. Though DNS is usually used by previous works for device identification (Apthorpe et al., 2017a; Sivanathan et al., 2017; Apthorpe et al., 2017b), our results show that its ratio is quite low compared to other protocols. As such, simply relying on DNS does not guarantee device identification especially when the traffic observed comes from an incomplete session.
| Device (%) | IPv4 | UDP | TCP | TLS | HTTP | DNS | O | ||
| Google Home | 100.0 | 1.5 | 98.1 | 26.6 | 0 | 0.6 | 0.4 | ||
| Echo Dot | 100.0 | 0 | 100.0 | 14.6 | 0 | 0 | 0 | ||
| Tmall Assist | 99.6 | 0 | 99.6 | 21.0 | 5.5 | 0 | 0.4 | ||
|
99.7 | 78.6 | 21.1 | 0.4 | 0 | 0 | 0.4 | ||
|
100.0 | 99.9 | 0.1 | 0 | 0 | 0 | 0 | ||
| Orvibo | 99.6 | 0.2 | 99.4 | 0 | 0 | 0 | 0.4 | ||
| Broadlink | 99.7 | 99.7 | 0 | 0 | 0 | 0 | 0.3 | ||
| Tplink | 99.4 | 0.1 | 99.3 | 50.9 | 0 | 0 | 0.6 | ||
| Xiaomi Hub | 99.5 | 99.5 | 0 | 0 | 0 | 0 | 0.5 | ||
| Noise - mobile | 87.6 | 5.5 | 80.1 | 4.5 | 1.7 | 2.2 | 12.4 | ||
| Noise - tablet | 87.0 | 0.5 | 86.4 | 0.6 | 0.1 | 0.1 | 13.0 |
In short, the above observations suggest fingerprinting IoT devices is feasible, even under complex network environment like NAPT and VPN. On the other hand, a comprehensive model instead of matching individual feature is necessary for our task.
3.2. Data Collection
While some prior works on IoT network analsyis have published their datasets (Sivanathan et al., 2017). We found they cannot be used in our study, as we focus on more complex settings with NAPT and VPN enabled in the gateway. As such, we set up our own smart home environment and collected the traffic by ourselves. The dataset will be published at a public repository.
We set up the environment in a campus laboratory with 15 devices, including 10 IoT and 4 non-IoT devices. Table 2 shows the details of our devices. Our devices can be divided into six categories: voice assistant, IoT hub, IoT kits(smart plug), network camera, interactive machine and non-IoT deivces. Devices used in our paper have different interaction modes and traffic patterns, which can be helpful to depict the overall picture of IoT device traffic.
We use a Raspberry Pi (url, 2019f) as the gateway. A typical Raspberry Pi provides two network interface cards – eth0 and wlan0. To simulate NAPT, we connect eth0 to the Internet and then enable the linux service hostapd to create an access point with wlan0 network card of Raspberry Pi. Next, we create rules for iptables so that packets can be forwarded from wlan0 to eth0 and vice versa. For VPN, we establish a virtual machine with DigitalOcean Droplets service (url, 2019c) and use it as our VPN server, we then setup openvpn client on our Raspberry Pi to enable VPN tunneling.
| device | MAC | type | |
| echo dot | 88:71:e5:ed:be:c7 | voice assistant | |
|
f4:f5:d8:db:61:84 | voice assistant | |
|
18:bc:5a:19:eb:7d | voice assistant | |
|
78:11:dc:e1:f0:6b | hub | |
|
b0:59:47:34:16:ff | network camera | |
|
78:11:dc:cf:c8:f1 | network camera | |
|
30:20:10:fb:7c:05 | smart plug | |
|
b4:e6:2d:08:63:0c | smart plug | |
|
78:0f:77:1b:00:8c | smart plug | |
|
28:6c:07:87:54:b0 | interactive | |
|
a4:50:46:06:80:43 | non-IoT | |
|
20:a6:0c:5a:42:10 | non-IoT | |
|
28:3f:69:05:2d:b0 | non-IoT | |
|
44:80:eb:21:cb:95 | non-IoT |
We collect network traffic under three different settings:
-
•
Single-device environment. We assume only one device is active and we connect one IoT device to the gateway at a time.
-
•
Multi-device and noisy environment. In this case, all IoT and non-IoT devices are connected to the gateway which has NAPT enabled. Several devices may work simultaneously at time, leading to traffic fusion.
-
•
VPN environment. In addition to the above settings, we assume VPN is enabled. Traffic before and after VPN are both collected from wlan0 and eth0 at the same time.
To generate traffic, we adopt two strategies: automatic triggering and manual triggering. Automation can relieve the burden of tedious repeating experimenters and manual triggering can simulate human-machine interaction in real environments.
Automatic triggering. For devices like smart plug and network that can be controlled by mobile apps, we use MonkeyRunner (url, 2019d) to interact with the UI of mobile apps and trigger different functions of IoT devices. For devices like voice assistants directly controlled by human’s input, we replay the commands near them. For example, Google Home plays songs when it hears the command “sing a song”. We record a list of different commands and play them in a loop with a proper interval. As smart devices may have different responses even facing the same command, though the total amount of recorded commands is fixed, traffic we collect may vary.
Manual triggering. The Manual triggering is used in collecting traffic from multi-device scenario. In this setting, devices are set up in a shared room (laboratory), people coming in and out this room can interact with the devices as they want. The functions triggered in this scenario and their time intervals are irregular and comply with what may happen in a real environment. Compared with the automatic triggering approach, manual triggering introduces more randomness to the dataset, which is helpful to the generalization of our models.
We adopt the popular network analysis tool tshark to monitor wlan0 and eth0 simultaneously. The traffic collected is dumped into files with extension “.pcapng” and is then pre-processed before classification.
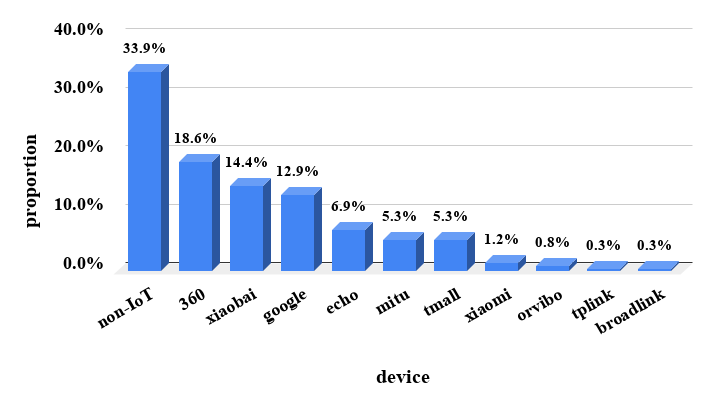
The collection lasts for 49.4 hours. In a total, we collected 4.05 GB traffic with 7,223,282 available packets (those cannot be obtained by our adversary model are excluded, like packets only being transmitted inside the LAN). The distribution of packets is shown in Fig 4. Note that, due to the internal functionalities of devices vary and users’ different habits, the collected traffic does not comply with a uniform distribution.
3.3. Traffic Pre-processing
We utilize a multi-platform packet parsing framework called PcapPlus Plus to pre-process the traffic. The goal is to extract low-level but useful features from the packet and compose a numerical vector that can be processed by our models.
Feature selection. Due to the encryption enforced by the communication, we extract features from the metadata of packet headers. We select features from different layers – frame length and epoch time from physical layer, and destination port number from transport layer. In addition, we use a binary sequence to represent the protocols in packet transmission. We select 6 most common protocol types including IP, TCP, UDP, TLS/SSL, HTTP and DNS, according to our measurement (see Table 1). If a packet involves one of the protocols, the corresponding bit will be set to 1, otherwise 0. We set the last position of the ‘binary string’ to be others for the protocols beyond the previous 6 protocols. For example, a UDP-based DNS request is represented as <1010010> and a NTP packet is represented as <1010001>. The only feature we consider beyond metadata is the direction of packet. We use 0 and 1 for inbound and outbound packets respectively.
Note that we do not use the domain name in DNS response like previous works (Apthorpe et al., 2017a; Apthorpe et al., 2017b) because DNS can be encrypted as well (Hoffman and McManus, 2018; Hu et al., 2016). The destination IP is not used because it is periodically changed when the IoT vendors run the remote server on public cloud, which has become a popular choice (url, 2019b).
In the end, we concatenate all the selected features and compose a one-dimensional vector as the representation of a packet (<dport, protocol, direction, frame length, time interval>), as shown in Figure 5. Note that we compute time interval from the epoch time between two adjacent packets and use it as feature to model the temporal relations between packets.
Packet labeling. One key challenge in traffic pre-processing is packet labeling, especially under VPN environment. As section 2.3 shows, packets collected outside of smart home (or between eth0 and VPN server) are all merged into a single flow (packets with the same destination IP and port (Taylor et al., 2016)), without any original identifier of sender/receiver. To identify the VPN packets and label those with their corresponding devices, we develop a mapping technique based on three observations obtained through our empirical analysis: (1) The size of a packet increases after being processed by VPN; (2) Multiple packets with different sizes can have the same size after the encryption performed by VPN; (3) There is a delay of packet transmission caused by VPN, which is usually shorter than 0.02 second.
Observation (1) and (2) can be reasoned through the cryptography algorithms used by openvpn server. It provides three symmetric encryption algorithms – BF-CBC, AES-128-CBC and DES-EDE3-CBC. All of them are block ciphers through which encryption increases the size of packets. Observation (3) helps us reduce the scope for linking packets before and after VPN. As a result, for each VPN-processed packet with timestamp , we first check its direction. If it is inbound, we search its counterpart with smaller packet size in the time window . If it is outbound, the time window becomes . We measure the effectiveness of our algorithm by counting the rate of successfully pairing and the overall accuracy is 98.8%.

3.4. Models
In this section, we first describe the baseline model we use for comparison and then describe our customized LSTM-RNN model.
3.4.1. Baseline Model
We consider random forest as our baseline model as it has been widely-used in previous works on device fingerprinting (Taylor et al., 2016; Sivanathan et al., 2017; Acar et al., 2018). A typical random forest is comprised of multiple single decision trees. During the training phase, inner decision trees are trained with different parts of the dataset and a final result is given based on the voting of those separate trees. In our work, we train a random forest model with the labeled packet vectors and the model predicts the device associated with each packet of testing dataset.
Among all the 5 features, dport needs to be processed before being used by the baseline model, since it is a discrete value with wide range (065536) that cannot be directly learned by a machine-learning model. We first encode dport value into a one-hot binary string. Since most of the ports are rarely used, we use principal component analysis (PCA) to select 50 principal components from the string. The total variance of them is around 98.9% according to our statistics, which means the 50 components keep most of information involved in ports.
For the hyper-parameters of Random Forest, we set the number of individual trees to 100 to balance training speed and performance.
3.4.2. LSTM-RNN Model
In Section 2.5, we overview the LSTM-RNN and describe its advantage when being used to solve our problem. Below we describe the construction of our LSTM-based models, including a basic version and a bidirectional version.
Traffic window. After pre-processing, each packet is transformed into a feature vector. We then group consecutive vectors to form a traffic window. Figure 5 shows an example of a traffic window. With traffic windows, we are able to model the temporal relations of adjacent packets. We show the impact of window size on evaluation result in Section 4.2.2.
Basic LSTM. A basic version contains multiple blocks and each block contains 4 layers:
|
|
|
|
||||||||
| 30 | 64 | 1 | 0.5 | ||||||||
|
|
Optimizer |
|
||||||||
| 0.001 | ReLU | Adam | 15 |
-Embedding layer. Embedding has been widely-used in the domain of Natural Language Processing(NLP) (Mikolov et al., 2013; Sutskever et al., 2014) which transforms discrete values into continuous vectors. In our LSTM models, we transform dport information into embeddings instead of the one-hot encoding like baseline model, mainly because this embedding layer can be seamless connetcted to other layers. In addition, it is a dynamic “mini” neural network gradually updating during the training phase. Therefore, our training data can optimize this representation.
-LSTM layer. After the processing of embedding layer, the input will be fed into the LSTM layer. At each step, a packet is assigned to a LSTM cell. The output of LSTM cells can be stacked into a matrix as input of the next layer.
-Fully-connected layer. We put a hidden fully-connected layer between LSTM layer and softmax layer with the size equal to the number of total categories.
-Softmax layer. The hidden dense layer output is then fed into the softmax layer for normalization. The output of softmax layer is the probability distribution indicating how likely a sample belongs to a category, which sums to one. For our task of multi-class classification, we select the category with the highest probability as the final output.
Bidirectional LSTM. The basic LSTM model only looks into the “past” of a packet when learning contextual information. Bidirectional LSTM (BLSTM) is an extension to the basic LSTM, which utilizes the information from “future”, by combining another LSTM layer moving from the end of a sequence to its beginning (Goodfellow et al., 2016). In areas like phoneme classification (Graves and Schmidhuber, 2005) and sequence tagging (Huang et al., 2015), BLSTM significantly improves the performance compared to a traditional one. Since our model works on a traffic window which consists of multiple adjacent packets, we can utilize the information of the packets transmitted after the current packet to classify it. The main change we apply on the LSTM layer is to concatenate cell states of backward and forward LSTM layers and feed them to the dense layer. Figure 6 shows the structure of the bidirectional LSTM used in our work.

4. Evaluation
In the evaluation, we want to understand how our models perform under different network scenarios. In this section, we first introduce the datasets we used for evaluation and our evaluation metrics. Then we describe our three scenes and the corresponding results. Finally we show several case studies.
As a quick overview of our results, we found LSTM-RNN models can well handle packet identification tasks with an overall accuracy over 92.0% in NAPT and VPN configurations on IoT traffic. Compared to basic LSTM, bidirectional LSTM performs better, suggesting the packet dependency indeed reveals the patterns unique to each individual IoT device.
4.1. Experiment Settings
Scenarios. We evaluate HomeMole in two scenarios – pure-IoT (only one active IoT device) and noisy (multiple active IoT and non-IoT devices). In each scenario, we evaluate HomeMole with two different gateway configurations – NAPT and VPN.
Datasets. We constructed two datasets for the two scenarios. Each dataset has an NAPT version and a VPN version. We split each dataset with the training and testing ratio of 8:2 and conduct 5-fold cross-validation on it. Below are the details of each dataset.
-
(1)
Dataset-Ind. This dataset contains traffic representations from 10 individual IoT devices. To facilitate the training process of LSTM-RNN models, the dataset is organized into collections of traffic windows, each traffic window only contains packets from one certain device. To make the dataset more balanced, we set a number threshold 5,000 for each device. All IoT devices own 5,000 randomly-selected samples except Xiaomi hub, tplink plug, orvibo plug and broadlink plug, due to that they generate much fewer packets than others. In total, Dataset-Ind contains 32,760 traffic windows.
-
(2)
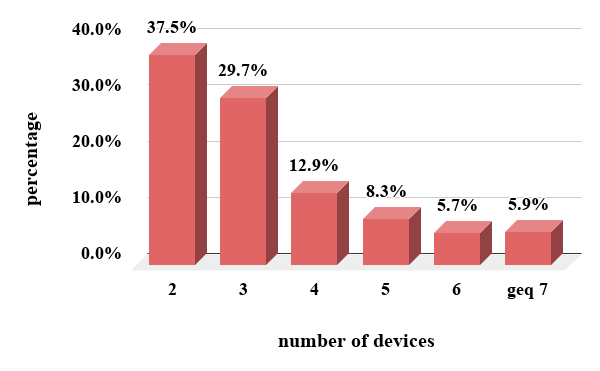
Dataset-Noise. This dataset is collected by keeping multiple devices active in the same time period. As a result, the traffic windows in this dataset are composed of packets from more than one devices. In total, Dataset-Noise includes 114,989 traffic windows. Figure 7 shows the distribution of device combinations. From it we can see, 2-device and 3-device combinations are most common.
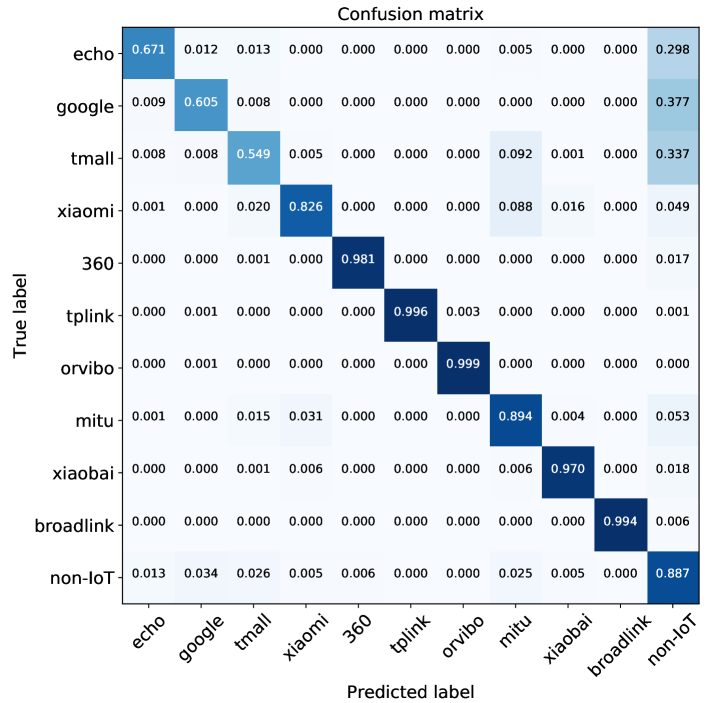
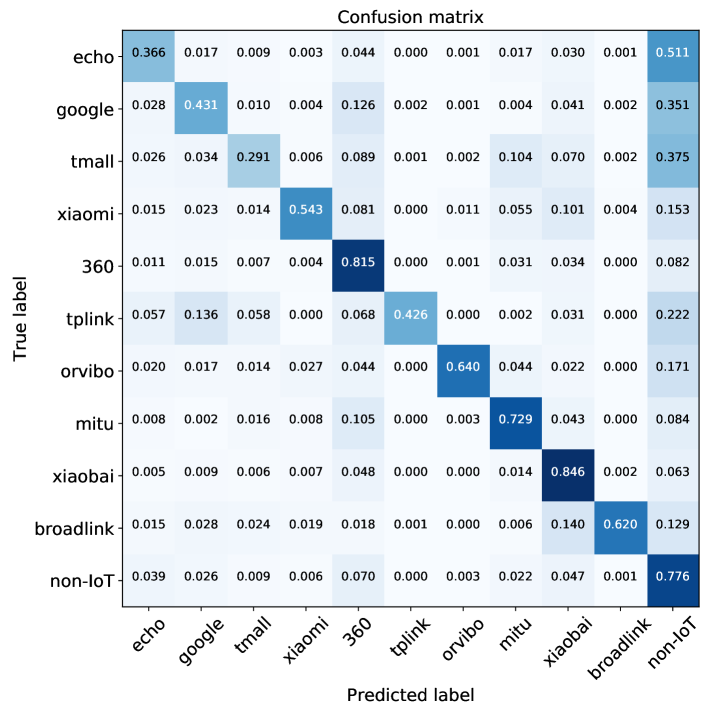
Metrics. Since HomeMole is able to classify individual packets, we measure the effectiveness of HomeMole based on the probability that the device is correctly identified per packet. We use overall accuracy (similar to (Sirinam et al., 2018)) and category accuracy for our case. For overall accuracy, we count as all the packets and as the total number of correctly classified packets, and compute . For category accuracy, we assess how HomeMole performs on each device. For device , we count as all packets belonging to and as ’s packets correctly classified under . The category accuracy for is . As an example, the diagonal cells on the confusion matrix shown in Figure 14 describe the category accuracy.
4.2. Pure-IoT Scenario
In this setting, there is only one active IoT device working during a period of time. Therefore, we assess how HomeMole performs when traffic is not merged. In practice, such scenario happens when the rest IoT devices enter hibernation mode.
4.2.1. Baseline Model
| config | model | average |
|
|
|
|
|
|
|
|
|
|
||||||||||||||||||||
| NAPT | RF | 92.2 | 89.0 | 85.9 | 86.9 | 89.6 | 99.0 | 99.9 | 99.9 | 93.3 | 98.5 | 99.3 | ||||||||||||||||||||
| LSTM | 97.3 | 98.5 | 91.6 | 93.9 | 98.6 | 99.9 | 99.9 | 99.9 | 98.7 | 99.9 | 99.9 | |||||||||||||||||||||
| BLSTM | 99.2 | 97.0 | 99.2 | 99.8 | 99.9 | 99.9 | 99.9 | 99.9 | 99.3 | 99.9 | 99.9 | |||||||||||||||||||||
| VPN | RF | 83.2 | 76.1 | 81.2 | 74.7 | 94.0 | 83.2 | 89.1 | 93.1 | 87.5 | 90.5 | 99.0 | ||||||||||||||||||||
| LSTM | 92.4 | 89.7 | 89.7 | 75.4 | 96.1 | 95.9 | 92.2 | 95.5 | 96.8 | 94.7 | 95.7 | |||||||||||||||||||||
| BLSTM | 97.7 | 96.6 | 96.8 | 94.7 | 99.4 | 98.5 | 98.0 | 99.5 | 98.9 | 99.7 | 96.7 |
(RF, LSTM and BLSTM stand for random forest, basic LSTM and bidirectional LSTM respectively).
We first evaluate the performance of our baseline model, Random Forest. In this scenario, The purposes are two-fold: (1) To explore the feasibility of classifying individual packet without context; (2) To evaluate the effectiveness of features we selected from packet’s metadata.
Experimental results. Table 4 shows the accuracy of random forest in NAPT and VPN configuration. As can be seen, with NAPT configuration, the random forest can reach a high identification accuracy on most IoT devices. Among them, smart plugs and network cameras have the highest accuracy while voice assistants have a lower accuracy . Compared with NAPT, random forest performs worse in VPN configuration with a 9.0% decline in overall accuracy. Accuracy on voice assistant is affected most.
Result analysis. We first use the built-in API provided by scikit- learn library to obtain feature importance. The results show that in NAPT, dport, frame length, time interval and protocol hold an importance factor of 55.5%, 22.8%, 12.8% and 8.0% separately. In VPN, frame length and time interval take up around 54.9% and 43.0% separately.
Compared with NAPT configuration, the obvious decline in VPN mainly comes from the change of dport and protocol (dport and protocol information is not preserved in the packet between gateway and VPN server) and partial loss of frame length due to padding by VPN client.
4.2.2. LSTM-RNN Models
We conjecture that the dependency of packets can be used for device identification, and we model it through LSTM-RNN models. Below we evaluate the two proposed LSTM-RNN models on Dataset-Ind.
Experimental results. Table 4 also shows performance of basic LSTM and bidirectional LSTM when the input traffic window contains 100 consecutive packets. We can see that compared to the baseline, both of the models have seen increase of accuracy on most devices. The result also shows LSTM-RNN models can well handle IoT devices producing large volume of traffic like voice assistant.
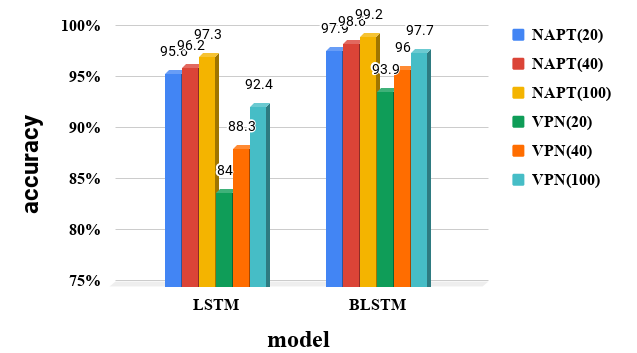
Impact of traffic window size. We compare the accuracy of LSTM-RNN models with different window sizes: 20, 40 and 100. The result is shown in Figure 8. From it we can see for both NAPT and VPN configurations, LSTM-RNN models perform better when the traffic window size grows. This result indicates the relation between packets with long timing gap can still provide useful information for our models. In the following sections, we take 100 as the default size of our traffic window.
4.3. Noisy Scenario
In this section, we evaluate the impact of non-IoT device traffic on our task.
4.3.1. Baseline Model
We first tested Random Forest using Dataset- Noise to understand the impact of non-IoT traffic and traffic fusion. Given the different traffic volume among devices, the packets we collect are imbalanced, as Figure 4 shows.
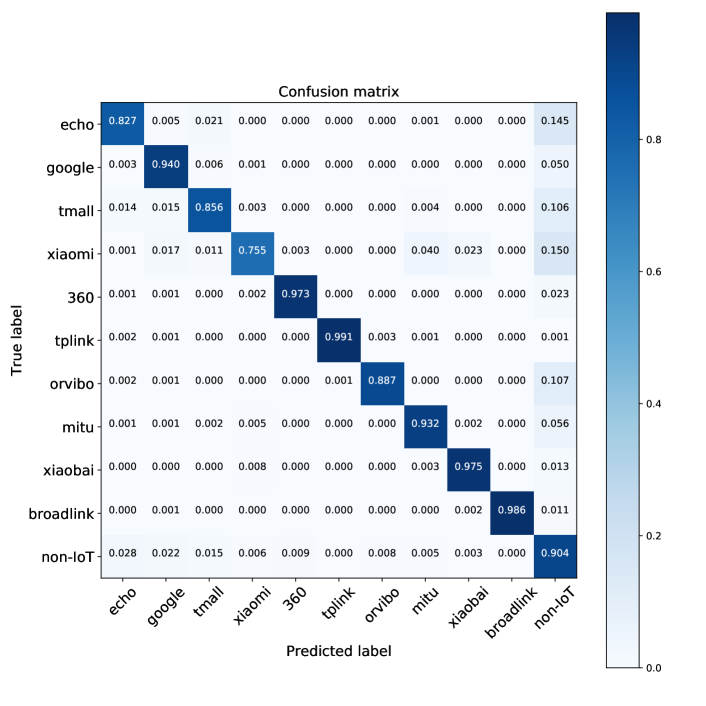
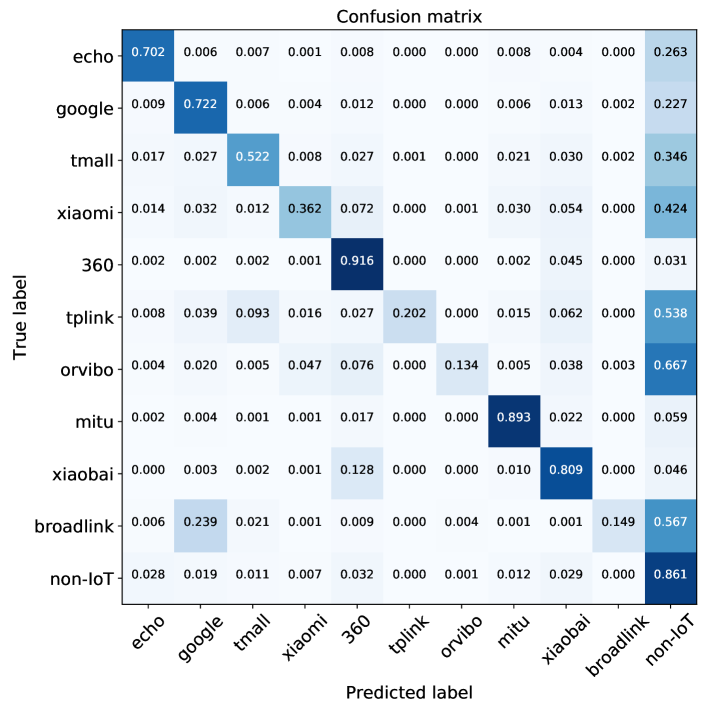
Experimental results. Compared with pure-IoT scenario, Random Forest has a prominent decline in the overall accuracy, reaching 84.5% in NAPT and 67.6% in VPN. We also use confusion matrix across devices to show the classification results by category with non-IoT traffic in NAPT and VPN configuration (see Figure 14 and Figure 14 in Appendix B). From them we can see, voice assistants, like Echo Dot, Google Home and Tmall Assistant, see larger performance drop compared to other IoTs, with a decline in NAPT and a decline in VPN configurations.
Result analysis. We manually check the mis-classified packets and find that most of them are transmitted through ports 443 and 80. The primary reason is that those ports are likely to be used by different IoT and non-Iot at the same time, so our model is more likely to be confused.
4.3.2. LSTM-RNN Models
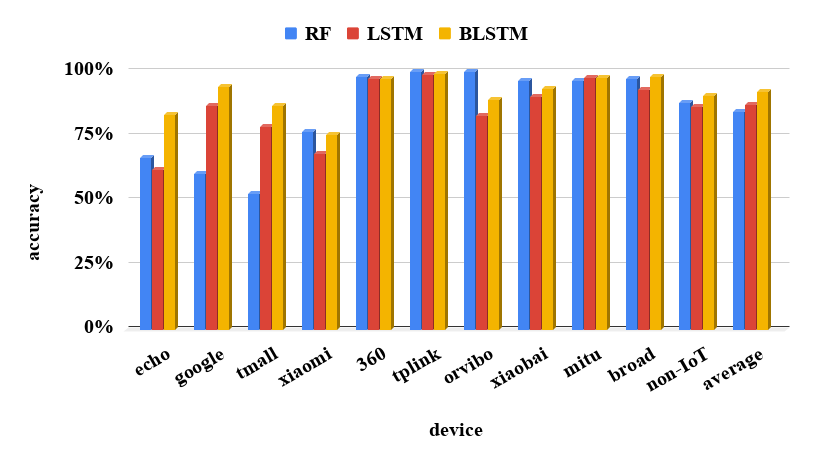
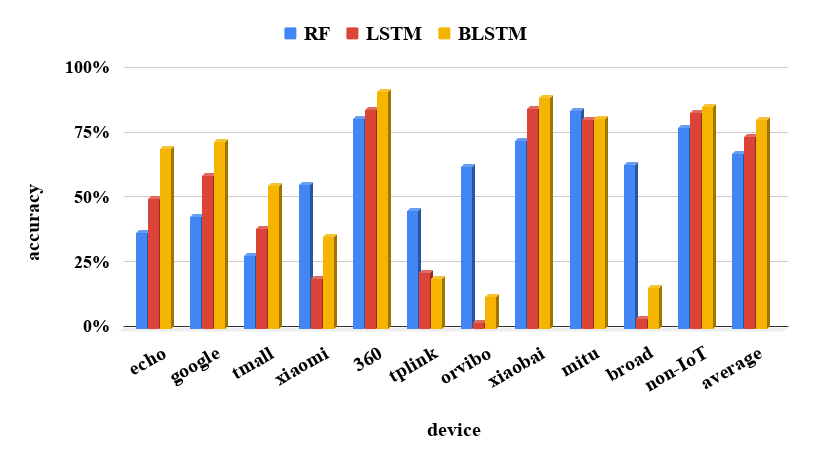
Experimental results. Figure 9 and Figure 10 give the comparison results between three models in NAPT and VPN configurations. The last group of columns (“average”) shows the overall accuracy. Bidirectional LSTM achieves the highest accuracy of 92.1% in NAPT and 81.0% in VPN. Basic LSTM reaches 87.1% and 74.1%. Figure 16 and Figure 16 of Appendix A show the concrete classification results of bidirectional LSTM by device categories in two configurations. From them we know: (1) LSTM-RNN models are good at recognizing traffic in NAPT configuration; (2) LSTM-RNN performs much worse in VPN configuration, especially on IoT devices like smart plugs (BLSTM: 12.6% for Orvibo, 20.4% for Tplink and 15.9% for Broadlink in 5 cross validations).
Result analysis. From the above results we can see LSTM-RNN models fail to classify traffic generated by smart plugs in VPN configuration. We find this observation can be ascribed to the sparse traffic generated by the devices. Due to the relative long time intervals between packets and the low packet amount, the traffic generated by smart plugs can be easily “overwhelmed” by traffic from others, leading to the original relation between packets being impaired. In extreme cases, packets generated by smart plugs can be “diluted” to less than 3% in a traffic window (3 in 100 packets). The situation becomes worse when distinctive features like dport and frame length are more likely to be confused. In Section 4.4 we show a case of orvibo plug.
4.4. Case Studies
Scarce traffic. Several IoT devices have a low traffic volume, such as orvibo plug and tplink plug. Therefore, the packets generated by them may be “overwhelmed” by other devices in the same traffic window. Take orvibo plug as an example. It has a three-TCP-packet sequence appearing multiple times. Their frame lengths are 224, 54, 240 bytes in two seconds correspondingly. But those numbers are not unique. According to our analysis, packets with the same sizes are generated by other devices so our classification models could be confused. In particular, 360 camera produces UDP packet of 224 bytes very frequently. xiaomi hub and xiaomi tablet generate TCP packets of 54 bytes consistently at high speed (15 packets in 0.1 second). As such, the three consecutive packets of orvibo plug are likely to be separated by those packets from other devices, leading to wrong classification results, especially in VPN configuration when protocol information is missing. This could explain why LSTM-RNN models perform worse in identifying IoT devices of small traffic volume in VPN environment.
Effectiveness of bidirectional LSTM. Section 4 shows the accuracy of bidir LSTM model is better than the basic LSTM model in most cases. Below we use one example to explain this performance difference. Through our manual check of traffic from different devices, we find packets of the size 66 bytes are commonly sent to the server in a sequence by Echo Dot and Google Home. However, the responses from the server are different between two devices. For Echo Dot, most of the responses are of a size 1388 bytes while for Google Home, most of them are TLS packets with the size of 108 bytes and 105 bytes. Compared to a basic LSTM, a bidirectional LSTM can utilize the later packet (1388-byte or 105-byte) to help classify the previous packets (66-byte). As such, adding the information from “future” could improve the chance of correctly classifying packets.
5. Discussion and limitation
Packet-level identification. Different from previous work that identifies devices based on network flows or traffic windows, we assign the device label to every packet generated within a period. The motivation for doing packet-level classification is that the running status of IoT devices can be more accurately identified and the device information can be obtained more promptly. For example, if packets are observed sparsely, the device might be in sleeping or standby mode. Otherwise, a dense packet sequence indicates the device is busy running a task. This is critical in some cases like camera monitoring, if a thief knows when a network camera is transmitting bulk data, he can infer whether the host is monitoring the house and decide the best time to sneak into the house. Additionally, we can combine the predicted labels of all packets in a time window to make better inference of IoT devices.
VPN connections. During the experiment, we only establish our VPN connection using UDP protocols. Another option – TCP(TLS) is not tested. The main reason is that UDP is the default protocol adopted by the openVPN service and is the most-widely protocol used by VPN providers due to its low latency (url, 2019e) compared with TCP. VPN using TCP requires modification of our packet labeling algorithm in Section 3.3 and we decide to leave it as our future work.
Behavior identification.We focused on device identification during evaluation, while previous works also explored user behavior identification (Acar et al., 2018). We did not experiment with behavior identification because the labeling cost is high given that we have large datasets with millions of IoT packets. On the other hand, we believe our models can be applied to this scenario if we have enough training samples. We will explore approaches that can generate labeled behavioral datasets efficiently.
6. Conclusion
In this paper, we systematically evaluated the effectiveness of traffic analysis in a smart home environment, even when traffic fusion like NAPT and VPN are enabled and non-IoT and IoT devices are both active. By exploiting the dependency between packets through DNN models like LSTM-RNN, we show it is possible to achieve high accuracy in device identification, even under the complex network environment as described above.
Our result suggests the network communications of IoT devices do have serious privacy implications, even under encryption and traffic fusion. We believe more research should be done to better understand the privacy issues in smart home network and mitigate such issues. To facilitate the research in this domain, we will release the data and our models.
References
- (1)
- url (2019a) Accessed: March 2019a. 2017 Roundup Of Internet Of Things Forecasts. https://www.forbes.com/sites/louiscolumbus/2017/12/10/2017-roundup-of-internet-of-things-forecasts/.
- url (2019b) Accessed: March 2019b. AWS IoT Core. https://aws.amazon.com/cn/iot-core/.
- mac (2019) Accessed: March 2019. Can a MAC address be traced? https://askleo.com/can_a_mac_address_be_traced/.
- url (2019c) Accessed: March 2019c. Digital Ocean Droplets. https://www.digitalocean.com/products/droplets.
- url (2019d) Accessed: March 2019d. Monkeyrunner. https://developer.android.com/studio/test/monkeyrunner.
- url (2019e) Accessed: March 2019e. OpenVPN over TCP vs. UDP: Which should I choose? https://www.bestvpn.com/guides/openvpn-tcp-vs-udp-difference-choose/.
- url (2019f) Accessed: March 2019f. Raspberry Pi. https://www.raspberrypi.org/documentation/.
- url (2019g) Accessed: March 2019g. SmartThings Motion Sensor (2015 model). https://support.smartthings.com/hc/en-us/articles/205957580-SmartThings-Motion-Sensor-2015-model-.
- Acar et al. (2018) Abbas Acar, Hossein Fereidooni, Tigist Abera, Amit Kumar Sikder, Markus Miettinen, Hidayet Aksu, Mauro Conti, Ahmad-Reza Sadeghi, and A. Selcuk Uluagac. 2018. Peek-a-Boo: I see your smart home activities, even encrypted! CoRR abs/1808.02741 (2018).
- Aksoy et al. (2017) Ahmet Aksoy, Sushil J. Louis, and Mehmet Hadi Gunes. 2017. Operating system fingerprinting via automated network traffic analysis. In 2017 IEEE Congress on Evolutionary Computation, CEC 2017, Donostia, San Sebastián, Spain, June 5-8, 2017. 2502–2509. https://doi.org/10.1109/CEC.2017.7969609
- Apthorpe et al. (2017a) Noah Apthorpe, Dillon Reisman, and Nick Feamster. 2017a. A Smart Home is No Castle: Privacy Vulnerabilities of Encrypted IoT Traffic. CoRR abs/1705.06805 (2017). arXiv:1705.06805 http://arxiv.org/abs/1705.06805
- Apthorpe et al. (2017b) Noah Apthorpe, Dillon Reisman, Srikanth Sundaresan, Arvind Narayanan, and Nick Feamster. 2017b. Spying on the Smart Home: Privacy Attacks and Defenses on Encrypted IoT Traffic. CoRR abs/1708.05044 (2017). arXiv:1708.05044 http://arxiv.org/abs/1708.05044
- Bissias et al. (2005) George Dean Bissias, Marc Liberatore, David D. Jensen, and Brian Neil Levine. 2005. Privacy Vulnerabilities in Encrypted HTTP Streams. In Privacy Enhancing Technologies, 5th International Workshop, PET 2005, Cavtat, Croatia, May 30-June 1, 2005, Revised Selected Papers. 1–11. https://doi.org/10.1007/11767831_1
- Bujlow et al. (2015) Tomasz Bujlow, Valentín Carela-Español, and Pere Barlet-Ros. 2015. Independent comparison of popular DPI tools for traffic classification. Computer Networks 76 (2015), 75–89. https://doi.org/10.1016/j.comnet.2014.11.001
- Chen et al. (2017) Zhitang Chen, Ke He, Jian Li, and Yanhui Geng. 2017. Seq2Img: A sequence-to-image based approach towards IP traffic classification using convolutional neural networks. In 2017 IEEE International Conference on Big Data, BigData 2017, Boston, MA, USA, December 11-14, 2017. 1271–1276. https://doi.org/10.1109/BigData.2017.8258054
- Du et al. (2017) Min Du, Feifei Li, Guineng Zheng, and Vivek Srikumar. 2017. DeepLog: Anomaly Detection and Diagnosis from System Logs through Deep Learning. In Proceedings of the 2017 ACM SIGSAC Conference on Computer and Communications Security, CCS 2017, Dallas, TX, USA, October 30 - November 03, 2017. 1285–1298. https://doi.org/10.1145/3133956.3134015
- Dyer et al. (2012) Kevin P. Dyer, Scott E. Coull, Thomas Ristenpart, and Thomas Shrimpton. 2012. Peek-a-Boo, I Still See You: Why Efficient Traffic Analysis Countermeasures Fail. In IEEE Symposium on Security and Privacy, SP 2012, 21-23 May 2012, San Francisco, California, USA. 332–346. https://doi.org/10.1109/SP.2012.28
- Fraleigh et al. (2003) Chuck Fraleigh, Sue Moon, Bryan Lyles, Chase Cotton, Mujahid Khan, Deb Moll, Rob Rockell, Ted Seely, and S Christophe Diot. 2003. Packet-level traffic measurements from the Sprint IP backbone. IEEE network 17, 6 (2003), 6–16.
- Gleeson et al. (2000) Bryan Gleeson, Arthur Lin, Juha Heinänen, Grenville Armitage, and Andrew G. Malis. 2000. A Framework for IP Based Virtual Private Networks. RFC 2764 (2000), 1–62. https://doi.org/10.17487/RFC2764
- Goodfellow et al. (2016) Ian Goodfellow, Yoshua Bengio, and Aaron Courville. 2016. Deep Learning. MIT Press. http://www.deeplearningbook.org.
- Graves et al. (2013) Alex Graves, Navdeep Jaitly, and Abdel rahman Mohamed. 2013. Hybrid speech recognition with Deep Bidirectional LSTM. 2013 IEEE Workshop on Automatic Speech Recognition and Understanding (2013), 273–278.
- Graves and Schmidhuber (2005) Alex Graves and Jürgen Schmidhuber. 2005. Framewise phoneme classification with bidirectional LSTM and other neural network architectures. Neural networks : the official journal of the International Neural Network Society 18 5-6 (2005), 602–10.
- Hoffman and McManus (2018) Paul E. Hoffman and Patrick McManus. 2018. DNS Queries over HTTPS (DoH). RFC 8484 (2018), 1–21. https://doi.org/10.17487/RFC8484
- Hu et al. (2016) Zi Hu, Liang Zhu, John S. Heidemann, Allison Mankin, Duane Wessels, and Paul E. Hoffman. 2016. Specification for DNS over Transport Layer Security (TLS). RFC 7858 (2016), 1–19.
- Huang et al. (2014) Hong Huang, Hussein Al-Azzawi, and Hajar Brani. 2014. Network Traffic Anomaly Detection. CoRR abs/1402.0856 (2014). arXiv:1402.0856 http://arxiv.org/abs/1402.0856
- Huang et al. (2015) Zhiheng Huang, Wei Xu, and Kai Yu. 2015. Bidirectional LSTM-CRF Models for Sequence Tagging. CoRR abs/1508.01991 (2015).
- Liberatore and Levine (2006) Marc Liberatore and Brian Neil Levine. 2006. Inferring the source of encrypted HTTP connections. In Proceedings of the 13th ACM Conference on Computer and Communications Security, CCS 2006, Alexandria, VA, USA, Ioctober 30 - November 3, 2006. 255–263. https://doi.org/10.1145/1180405.1180437
- Lipton et al. (2016) Zachary Chase Lipton, David C. Kale, Charles Elkan, and Randall C. Wetzel. 2016. Learning to Diagnose with LSTM Recurrent Neural Networks. CoRR abs/1511.03677 (2016).
- Martín et al. (2017) Manuel López Martín, Belén Carro, Antonio Sánchez-Esguevillas, and Jaime Lloret. 2017. Network Traffic Classifier With Convolutional and Recurrent Neural Networks for Internet of Things. IEEE Access 5 (2017), 18042–18050. https://doi.org/10.1109/ACCESS.2017.2747560
- Miettinen et al. (2017) Markus Miettinen, Samuel Marchal, Ibbad Hafeez, N Asokan, Ahmad-Reza Sadeghi, and Sasu Tarkoma. 2017. IoT Sentinel: Automated device-type identification for security enforcement in IoT. In Distributed Computing Systems (ICDCS), 2017 IEEE 37th International Conference on. IEEE, 2177–2184.
- Mikolov et al. (2013) Tomas Mikolov, Kai Chen, Greg Corrado, and Jeffrey Dean. 2013. Efficient estimation of word representations in vector space. arXiv preprint arXiv:1301.3781 (2013).
- Mirsky et al. (2018) Yisroel Mirsky, Tomer Doitshman, Yuval Elovici, and Asaf Shabtai. 2018. Kitsune: An Ensemble of Autoencoders for Online Network Intrusion Detection. In 25th Annual Network and Distributed System Security Symposium, NDSS 2018, San Diego, California, USA, February 18-21, 2018. http://wp.internetsociety.org/ndss/wp-content/uploads/sites/25/2018/02/ndss2018_03A-3_Mirsky_paper.pdf
- Panchenko et al. (2016) Andriy Panchenko, Fabian Lanze, Jan Pennekamp, Thomas Engel, Andreas Zinnen, Martin Henze, and Klaus Wehrle. 2016. Website Fingerprinting at Internet Scale. In 23rd Annual Network and Distributed System Security Symposium, NDSS 2016, San Diego, California, USA, February 21-24, 2016. http://wp.internetsociety.org/ndss/wp-content/uploads/sites/25/2017/09/website-fingerprinting-internet-scale.pdf
- Rimmer et al. (2018) Vera Rimmer, Davy Preuveneers, Marc Juarez, Tom van Goethem, and Wouter Joosen. 2018. Automated Website Fingerprinting through Deep Learning. In 25th Annual Network and Distributed System Security Symposium, NDSS 2018, San Diego, California, USA, February 18-21, 2018. https://arxiv.org/abs/1708.06376
- Siby et al. (2017) Sandra Siby, Rajib Ranjan Maiti, and Nils Ole Tippenhauer. 2017. IoTScanner: Detecting and Classifying Privacy Threats in IoT Neighborhoods. CoRR abs/1701.05007 (2017). arXiv:1701.05007 http://arxiv.org/abs/1701.05007
- Sirinam et al. (2018) Payap Sirinam, Mohsen Imani, Marc Juárez, and Matthew Wright. 2018. Deep Fingerprinting: Undermining Website Fingerprinting Defenses with Deep Learning. In Proceedings of the 2018 ACM SIGSAC Conference on Computer and Communications Security, CCS 2018, Toronto, ON, Canada, October 15-19, 2018. 1928–1943. https://doi.org/10.1145/3243734.3243768
- Sivanathan et al. (2017) Arunan Sivanathan, Daniel Sherratt, Hassan Habibi Gharakheili, Adam Radford, Chamith Wijenayake, Arun Vishwanath, and Vijay Sivaraman. 2017. Characterizing and classifying IoT traffic in smart cities and campuses. In 2017 IEEE Conference on Computer Communications Workshops, INFOCOM Workshops, Atlanta, GA, USA, May 1-4, 2017. 559–564. https://doi.org/10.1109/INFCOMW.2017.8116438
- Srinivasan et al. (2008) Vijay Srinivasan, John A. Stankovic, and Kamin Whitehouse. 2008. Protecting your daily in-home activity information from a wireless snooping attack. In UbiComp 2008: Ubiquitous Computing, 10th International Conference, UbiComp 2008, Seoul, Korea, September 21-24, 2008, Proceedings. 202–211. https://doi.org/10.1145/1409635.1409663
- Srisuresh and Holdrege (1999) Pyda Srisuresh and Matt Holdrege. 1999. IP Network Address Translator (NAT) Terminology and Considerations. RFC 2663 (1999), 1–30. https://doi.org/10.17487/RFC2663
- Sun et al. (2002) Qixiang Sun, Daniel R. Simon, Yi-Min Wang, Wilf Russell, Venkata N. Padmanabhan, and Lili Qiu. 2002. Statistical Identification of Encrypted Web Browsing Traffic. In 2002 IEEE Symposium on Security and Privacy, Berkeley, California, USA, May 12-15, 2002. 19–30. https://doi.org/10.1109/SECPRI.2002.1004359
- Sutskever et al. (2014) Ilya Sutskever, Oriol Vinyals, and Quoc V Le. 2014. Sequence to sequence learning with neural networks. In Advances in neural information processing systems. 3104–3112.
- Taylor et al. (2016) Vincent F. Taylor, Riccardo Spolaor, Mauro Conti, and Ivan Martinovic. 2016. AppScanner: Automatic Fingerprinting of Smartphone Apps from Encrypted Network Traffic. In IEEE European Symposium on Security and Privacy, EuroS&P 2016, Saarbrücken, Germany, March 21-24, 2016. 439–454. https://doi.org/10.1109/EuroSP.2016.40
- Vassio et al. (2017) Luca Vassio, Danilo Giordano, Martino Trevisan, Marco Mellia, and Ana Paula Couto da Silva. 2017. Users’ Fingerprinting Techniques from TCP Traffic. In Proceedings of the Workshop on Big Data Analytics and Machine Learning for Data Communication Networks, Big-DAMA@SIGCOMM 2017, Los Angeles, CA, USA, August 21, 2017. 49–54. https://doi.org/10.1145/3098593.3098602
- Verde et al. (2014) Nino Vincenzo Verde, Giuseppe Ateniese, Emanuele Gabrielli, Luigi Vincenzo Mancini, and Angelo Spognardi. 2014. No NAT’d User Left Behind: Fingerprinting Users behind NAT from NetFlow Records Alone. In IEEE 34th International Conference on Distributed Computing Systems, ICDCS 2014, Madrid, Spain, June 30 - July 3, 2014. 218–227. https://doi.org/10.1109/ICDCS.2014.30
- Wright et al. (2009) Charles V. Wright, Scott E. Coull, and Fabian Monrose. 2009. Traffic Morphing: An Efficient Defense Against Statistical Traffic Analysis. In Proceedings of the Network and Distributed System Security Symposium, NDSS 2009, San Diego, California, USA, 8th February - 11th February 2009. http://www.isoc.org/isoc/conferences/ndss/09/pdf/14.pdf
- Yu et al. (2014) Jishen Yu, Feng Liu, Wenli Zhou, and Hua Yu. 2014. Hadoop-based network traffic anomaly detection in backbone. In IEEE 3rd International Conference on Cloud Computing and Intelligence Systems, CCIS 2014, Shenzhen, China, November 27-29, 2014. 140–145. https://doi.org/10.1109/CCIS.2014.7175718
Appendix A Traffic Patterns of IoT Devices
Appendix B Performance in Noisy Environment
Figure 14 and Figure 14 show the performance of random forest in NAPT and VPN configurations in noisy environment. Figure 16 and Figure 16 show the performance of bidirectional LSTM in NAPT and VPN configurations within noisy environment.