Properties of the Circumgalactic Medium in Cosmic Ray-Dominated Galaxy Halos
Abstract
We investigate the impact of cosmic rays (CRs) on the circumgalactic medium (CGM) in FIRE-2 simulations, for ultra-faint dwarf through Milky Way (MW)-mass halos hosting star-forming (SF) galaxies. Our CR treatment includes injection by supernovae, anisotropic streaming and diffusion along magnetic field lines, collisional and streaming losses, with constant parallel diffusivity chosen to match -ray observations. With this, CRs become more important at larger halo masses and lower redshifts, and dominate the pressure in the CGM in MW-mass halos at . The gas in these “CR-dominated” halos differs significantly from runs without CRs: the gas is primarily cool (a few K), and the cool phase is volume-filling and has a thermal pressure below that needed for virial or local thermal pressure balance. Ionization of the “low” and “mid” ions in this diffuse cool gas is dominated by photo-ionization, with O vi columns at distances . CR and thermal gas pressure are locally anti-correlated, maintaining total pressure balance, and the CGM gas density profile is determined by the balance of CR pressure gradients and gravity. Neglecting CRs, the same halos are primarily warm/hot (K) with thermal pressure balancing gravity, collisional ionization dominates, O vi columns are lower and Ne viii higher, and the cool phase is confined to dense filaments in local thermal pressure equilibrium with the hot phase.
keywords:
galaxies: formation — galaxies: evolution — galaxies: active — stars: formation — cosmology: theory1 Introduction
Galaxies are not isolated systems; instead, they are embedded in extended dark matter and gaseous halos. Early models assumed that massive halos were filled with uniform, “hot” () virialized gas, predicted by hydrostatic equilibrium arguments (Bahcall & Spitzer Jr, 1969; White & Rees, 1978), and the existence of such gas in massive gaseous halos has been supported by observations of X-ray emission (Li et al., 2008; Fang et al., 2012), O vii line absorption (Wang et al., 2005) and the Sunyaev-Zel’dovich (SZ) effect (Planck Collaboration et al., 2013; Anderson et al., 2015). While at high redshift cold filamentary gas is expected to survive even in relatively massive halos (e.g., Kereš et al. 2005; Dekel & Birnboim 2006), at low redshift, colder filaments are expected to be heated up in halos hosting galaxies. However, the combined mass of the hot halo gas and the galaxy disks in MW-mass and smaller halos falls below the expected Universal baryon fraction predicted in simple structure formation models (McGaugh et al., 2009; Miller & Bregman, 2013). This discrepancy is partially relieved by the recent discoveries of cooler component in the halo gas detected via quasar absorption lines at low redshifts (Stocke et al., 2013a; Werk et al., 2014; Prochaska et al., 2017b), and via Ly emission at high redshifts (Cantalupo et al., 2014; Hennawi et al., 2015; Cai et al., 2017). The co-existence of both cool and hot phases has led to a new picture in which galaxies are surrounded by multiphase CGM gas extending from the disk (kpc) to the virial radius (kpc), which serves as a reservoir containing most of the baryons and potentially playing a critical role in “feedback” processes critical to galaxy formation (Tumlinson et al., 2017; Zhang, 2018).
These and other observations raise many unsolved questions. For example, cool photo-ionized gas at a few traced by “low” ions111Throughout, we follow convention and refer to ions with ionization energy () as “low” ions, ( as “mid” ions, and () as “high” ions (Tumlinson et al., 2017). has been found to have an electron density at least an order-of-magnitude lower than that expected if it were in thermal pressure equilibrium with the hot phase – it appears to be “under-pressured” (Werk et al., 2014; McQuinn & Werk, 2018). How the cool phase embedded in a hot medium could form and survive disruption via fluid-mixing instabilities remains unclear. In O vi (a “mid” ion), large columns are observed to distances from star-forming galaxies (Tumlinson et al., 2011; Werk et al., 2016). The nature and origin of the O vi is still debated: it could be collisionally-ionized warm gas at , originating in turbulent mixing (Begelman & Fabian, 1990; Kwak & Shelton, 2010; Voit, 2018) or thermal conduction (Gnat et al., 2010) layers (as it is thermally unstable), or it could trace the cool low-density photo-ionized gas (Stern et al., 2018). The observed O vi characteristic distance of has also posed a challenge for recent theoretical CGM models (e.g., Mathews & Prochaska 2017; Faerman et al. 2017; Stern et al. 2018, 2019). In numerical simulations, the column densities of the low and mid ions in CGM are usually under-predicted (e.g., Hummels et al. 2013; Cen 2013; Oppenheimer et al. 2016; Liang et al. 2016; Fielding et al. 2016), even in recent simulations which “zoom in” on the CGM to dramatically improve numerical resolution (Peeples et al., 2018; Hummels et al., 2018; van de Voort et al., 2018).
These discrepancies could indicate an essential piece is missing from many models of the CGM, in the form of non-thermal components such as magnetic fields and/or cosmic rays (CRs). In the CGM, magnetic fields can facilitate cool gas formation by enhancing thermal instability (Ji et al., 2018), protect the cool gas against hydrodynamic instabilities via magnetic tension (Dursi & Pfrommer, 2008; McCourt et al., 2015), and regulate anisotropic thermal conduction (Su et al., 2017a, 2019), but most studies have concluded that these effects are relatively weak and do not qualitatively change the phase balance of the CGM (see e.g. Komarov et al., 2014; Su et al., 2017a; Hopkins et al., 2019; Su et al., 2019). On the other hand, CR pressure could be responsible for supporting the diffuse cool CGM (Salem et al., 2016; Butsky & Quinn, 2018), driving galactic outflows (Ruszkowski et al., 2017; Wiener et al., 2017; Chan et al., 2019), or heating the CGM via excitation of short-wavelength Alfvén waves (Wiener et al., 2013), and its non-linear effects on CGM structure in a fully cosmological setting remain largely unexplored. Especially, Salem et al. (2016) found that CRs can provide significant pressure support for CGM, while they did not include non-adiabatic CR energy loss terms which are very important in regimes of low CR diffusion coefficients or high gas densities (e.g., in central galaxies).
To explore the impact of the non-thermal components on the CGM in a more self-consistent manner, we utilize a new series of high-resolution, fully-cosmological simulations from the Feedback in Realistic Environments (FIRE)222FIRE project website: http://fire.northwestern.edu project (Hopkins et al., 2014), including magnetic fields, physical conduction and viscosity, and explicit CR transport and CR-gas interactions including collisional (hadronic+Coulomb) and streaming losses of CR energy (Chan et al., 2019; Su et al., 2019; Hopkins et al., 2019). Previous FIRE simulations, ignoring explicit CR transport, have been used to explore and predict CGM properties such as high-redshift HI covering factors (Faucher-Giguère et al., 2015, 2016), the nature of the cosmic baryon cycle and outflow recycling (Muratov et al., 2015; Anglés-Alcázar et al., 2017; Hafen et al., 2018), statistics of low-redshift Lyman limit systems (Hafen et al., 2017), galaxy outflow properties and the metal budget of the CGM (Ma et al., 2015; Muratov et al., 2017), the SZ effect and halo baryon fractions (van de Voort et al., 2016), and temperature/density/entropy profiles of massive halos and clusters (Su et al., 2019). We therefore extend these by considering the role of CRs.
In §2, we briefly review the simulations and numerical methods. §3 presents and analyzes CGM properties, focusing on the effects of CRs where they significantly influence our predictions, including the CGM phase structure and direct comparisons with observed low/medium/high ion column density measurements. In §4, we provide a simple theoretical models for our simulation results, and in §5 we summarize and discuss caveats of this work.
2 Methods
[
caption=Zoom-in simulations studied here (see Hopkins
et al. 2019 for details). All units are physical.,center,star]lccccccr
\tnote[ ]Properties listed refer only to the “target” halo around which the high-resolution volume is centered,
(1) Simulation Name: Designation used throughout this paper.
(2) Final Redshift: Redshift to which the simulations are run.
(3) : Virial mass (following Bryan &
Norman, 1998) of the “target” halo.
(4) : Central galaxy stellar mass, in our non-CR, but otherwise full-physics “MHD+” run.
(5) : Stellar mass, in our default CR+ () run.
(6) : Baryonic (gas or star) particle mass, in units of . The DM particle mass is larger by the universal ratio.
(7) : Gravitational force softening (Plummer-equivalent) at the mean density of star formation (gas softenings are adaptive to match hydrodynamic resolution).
(8) Additional notes.
All properties are measured at , except for halo m12z2, where all properties are measured at (after it reaches MW masses).
Simulation Notes
Name
m10q 0 8.0e9 2e6 2e6 0.25 0.8 isolated dwarf in an early-forming halo
m11b 0 4.3e10 8e7 8e7 2.1 1.6 disky (rapidly-rotating) dwarf
m11f 0 5.2e11 3e10 1e10 12 2.6 early-forming, intermediate-mass halo
m12i 0 1.2e12 7e10 3e10 7.0 2.0 late-forming, MW-mass with massive disk
m12m 0 1.5e12 1e11 3e10 7.0 2.3 earlier-forming halo, features strong bar
m12z2 2 1.5e12 2e11 2e11 56 2.3 massive halo at high-: properties at
The specific simulations studied here are the same as those presented and studied in Hopkins
et al. (2019), where the details of the numerical methods are described. We therefore only briefly summarize here. The simulations were run with GIZMO333A public version of GIZMO is available at http://www.tapir.caltech.edu/~phopkins/Site/GIZMO.html (Hopkins, 2015), in its meshless finite-mass MFM mode (a mesh-free finite-volume Lagrangian Godunov method). The simulations solve the equations of ideal magneto-hydrodynamics (MHD) as described and tested in (Hopkins &
Raives, 2016; Hopkins, 2016), with anisotropic Spitzer-Braginskii conduction and viscosity as described in Hopkins (2017); Su et al. (2017a) and Hopkins
et al. (2019). Gravity is solved with adaptive Lagrangian force softening (so hydrodynamic and force resolutions are matched). The simulations are fully-cosmological “zoom-in” runs with a high-resolution region (of size ranging from to a few Mpc on a side) surrounding a “primary” halo of interest (Oñorbe
et al., 2014);444For the MUSIC (Hahn &
Abel, 2011) files necessary to generate all ICs here, see:
http://www.tapir.caltech.edu/~phopkins/publicICs the properties of these primary halos (our main focus here, as these are the best-resolved in each box) are given in Table 2.
All our simulations include the physics of cooling, star formation, and stellar feedback from the FIRE-2 code, described in detail in Hopkins (2018b). Gas cooling is followed from K (including a variety of process, e.g. metal-line, molecular, fine-structure, photo-electric, photo-ionization, and more, accounting for self-shielding and both local radiation sources and the meta-galactic background; see Hopkins 2018b), and the Faucher-Giguere et al. (2009) UV background (hereafter FG09) is adopted. We follow 11 distinct abundances accounting for turbulent diffusion of metals and passive scalars as in Colbrook et al. (2017); Escala et al. (2018). Gas is converted to stars using a sink-particle prescription if and only if it is locally self-gravitating at the resolution scale (Hopkins et al., 2013), self-shielded/molecular (Krumholz & Gnedin, 2011), Jeans-unstable, and denser than . Each star particle is then evolved as a single stellar population with IMF-averaged feedback properties calculated following (Leitherer et al., 1999) for a Kroupa (2001) IMF and its age and abundances. We explicitly treat mechanical feedback from SNe (Ia & II) and stellar mass loss (from O/B and AGB stars) as discussed in Hopkins et al. (2018), and radiative feedback including photo-electric and photo-ionization heating and UV/optical/IR radiation pressure with a five-band radiation-hydrodynamics scheme as discussed in Hopkins (2018a).
Magnetic fields, anisotropic Spitzer-Braginskii conduction and viscosity are included in our simulations as well. Conduction adds the parallel heat flux , while viscosity adds the anisotropic stress tensor to the gas momentum and energy equations. The parallel transport coefficients and follow the usual Spitzer & Härm (1953); Braginskii (1965) form, accounting for saturation following Cowie & McKee (1977), and accounting for plasma instabilities (e.g. Whistler, mirror, and firehose) limiting the heat flux and anisotropic stress at high plasma- following Komarov et al. (2018); Squire et al. (2017a, c); Squire et al. (2017b).
Our “CRs” or “CR+” simulations include all of the above, and add our “full physics” treatment of CRs as described in detail in Chan et al. (2019) and Hopkins et al. (2019). We evolve a “single bin” ( GeV) or constant spectral distribution of CRs as an ultra-relativistic () fluid, accounting for injection in SNe shocks (with a fixed fraction of the initial SNe ejecta kinetic energy in each time-resolved explosion injected into CRs), collisional (hadronic and Coulomb) losses from the CRs (with a fraction of this loss thermalizing and heating gas) following Guo & Oh (2008), advection and adiabatic work (in the local “strong coupling” approximation, so the CR pressure contributes to the total pressure in the Riemann problem for the gas equations-of-motion), and CR transport including anisotropic diffusion and streaming (McKenzie & Voelk, 1982). We solve the transport equations using a two-moment approximation to the full collisionless Boltzmann equation (similar to the schemes in Jiang & Oh 2018; Thomas & Pfrommer 2019), with a constant parallel diffusivity (perpendicular ); streaming velocity with , the local Alfvén speed (Skilling, 1971; Holman et al., 1979; Kulsrud, 2005; Yan & Lazarian, 2008); and the “streaming loss” term thermalized (representing losses to plasma instabilities at the gyro scale; Wentzel 1968; Kulsrud & Pearce 1969).
Our “baseline” or “no CRs” simulations include all the physics above except CRs: these are the “MHD+” simulations in Hopkins et al. (2019). Note there we also compared a set without magnetic fields, conduction, or viscosity (the “Hydro+” runs); but as shown therein and in Su et al. (2017a) the differences in these runs are largely negligible, and we confirm this here. Our default “CR” simulations adopt , , and , along with the full CR transport physics including anisotropic streaming, diffusion, collisional losses, etc.: these are the “CR+()” simulations in Hopkins et al. (2019). Although we considered variations to all of these CR physics and, in particular, the diffusivity (which is not known to an order of magnitude, e.g., Zweibel 2013; Grenier et al. 2015), in Hopkins et al. (2019); Chan et al. (2019), we showed that the observational constraints from e.g. spallation and more detailed measurements in the MW and -ray emission in local galaxies were all consistent with the default () model here, and ruled out models (within the context of the approximations here) with much lower/higher (or ).555See Chan et al. (2019) for detailed discussions regarding the constrain of the CR diffusion coefficient. It is also worth noting that some studies (e.g., Girichidis et al. 2018) quote a lower diffusion coefficient (); however that value is (1) for the isotropic diffusion coefficient, a factor smaller than the parallel diffusivity, and (2) in Girichidis et al. (2018) the CR halo scale height adopted is smaller than the results of our cosmological simulations here, which in turn leads to a lower required to reproduce the observations.
It is worth noting that the diffusion coefficient is assumed to be constant in our simulations for simplicity, while in reality microphysical models indicate that diffusivity could be a highly complicated, nonlinear function of local plasma properties. Unfortunately, there does not yet exist a commonly accepted CR transport model. Recently, Hopkins et al. (2020) explored varying CR transport coefficients in FIRE-2 cosmological zoom-in simulations, where the variations were motivated by different transport models available in the literature. Hopkins et al. (2020) found that in different CR transport models that are allowed by observational constraints, the impact of CRs on CGM properties are qualitatively similar, but with quantitative differences in the strength of the CR effects.
3 Results
3.1 CRs and CGM Pressure Support
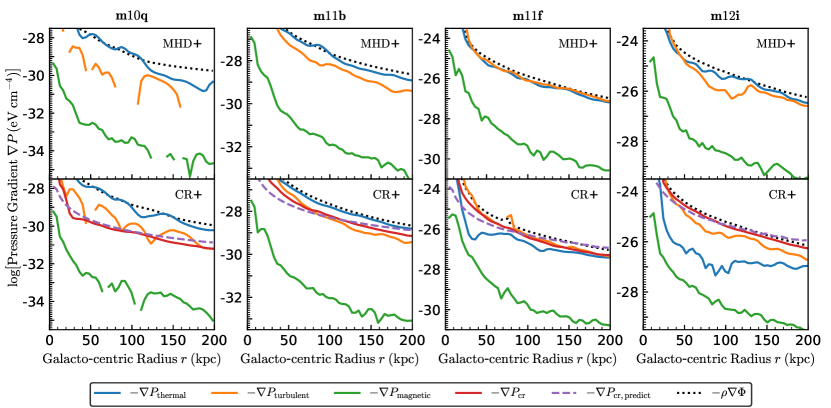
Fig. 1 shows profiles of the gas (thermal) pressure and CR pressure gradients, for various representative halos at in our simulations, comparing our MHD+ and CR+ runs. The magnetic and turbulent pressure (defined as and respectively) are also shown, but as discussed in more detail in (Hopkins et al., 2019) they are negligible in the CGM (where turbulence is weak and the plasma always) – this is why we see (as Hopkins et al. 2019) only very small differences between our MHD+ runs and runs neglecting magnetic fields entirely (the “Hydro+” runs in Hopkins et al. 2019). We therefore will focus on the dominant pressure terms: thermal and CR. We compare these to the gravitational force per unit volume.
Fig. 1 shows that for lower-mass dwarfs (e.g. m10q and m11b), in both MHD+ and CR+ runs, thermal gas pressure is the leading term in balancing the gravitational force, and in m10q and in m11b, with thermal pressure progressively more dominant at lower masses. Not surprisingly, in these cases we find CRs have relatively weak effects in the CGM, as Hopkins et al. (2019) also found for ISM and galaxy properties. This is true across the large ensemble of dwarf halos simulated in Hopkins et al. (2019), so for brevity we simply focus on these representative cases. However, a qualitative change occurs for the CR+ run with intermediate-mass halos of m11f through the MW-mass m12i and m12m: the CR pressure becomes dominant over thermal (and magnetic) pressure in the CGM, and balances gravity. Turbulent pressure can be comparable to CR pressure in m11f, and slightly subdominant to, but still of the same order of magnitude to CR pressure in m12i, suggesting it is not negligible, but is also not able to single-handedly provide the full pressure support needed in the CGM. Again, this is shown for a larger sample in Hopkins et al. (2019) – here we focus on the representative cases shown, but also (by showing the pressure gradients instead of total pressure) demonstrate explicitly that the CR pressure gradient almost exactly balances gravity in the MW-mass systems (see §A for radial pressure profiles of a larger sample of MW-mass halos).
3.2 CRs and CGM Magnetic Fields
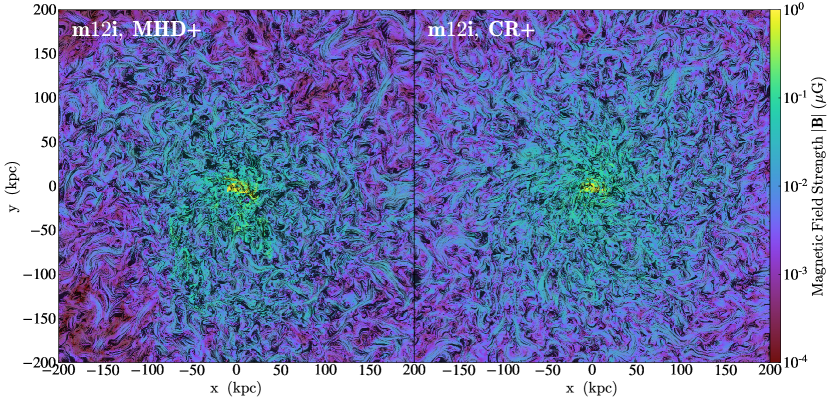
Fig. 2 compares magnetic field structure and strength in the CGM for run m12i. As shown in a more detailed study in Su et al. (2017b), the fields are primarily amplified in the CGM by a combination of flux-frozen compression during collapse, stirring and transport of galactic fields via galactic winds, and the turbulent dynamo, giving rise to to an approximate scaling with , which we also find (on average) here. We also clearly see that turbulence in the CGM has led to highly tangled fields, which explains why e.g. Chan et al. (2019) and Hopkins et al. (2019) found that adopting isotropic diffusion or streaming with isotropically-averaged coefficient gave similar results to the default fully-anisotropic transport here. The fields are also weak, consistent with our previous studies (Su et al., 2017a, 2019; Hopkins et al., 2019) and general expectations in the CGM, with at kpc. Most important, Figs. 1-2 show that field strengths and morphologies are similar in MHD+ and CR+ runs even in m12i (differences are even smaller in the dwarf runs): so CRs do not appear to strongly modify CGM magnetic fields.
3.3 CRs and CGM Heating
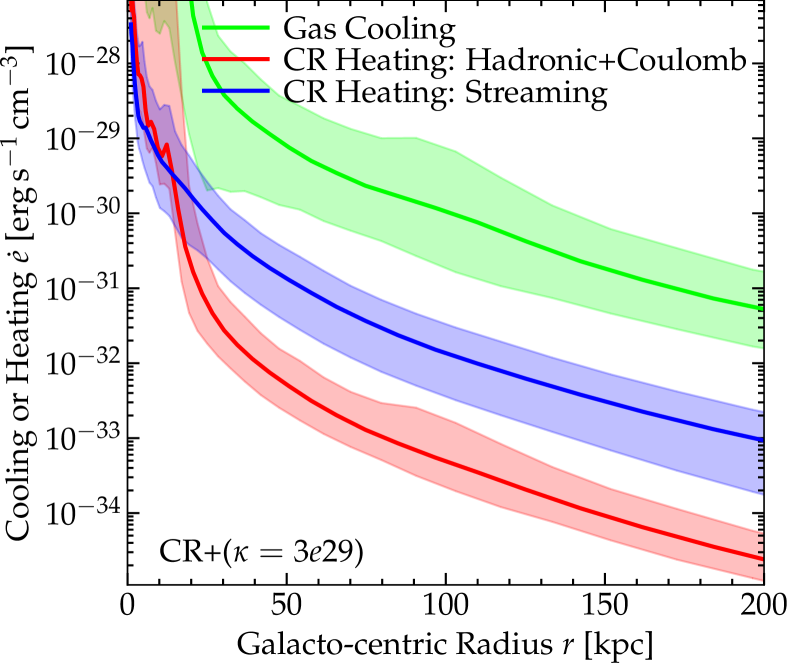
CRs can in principle alter the CGM via their pressure support, or via heating the gas though either collisions (hadronic and Coulomb encounters which thermalize a fraction of the CR energy in each collision) or “streaming losses” (excitation of extremely high-frequency Alfvén waves as CRs stream via the gyro-resonant instability, which damp and thermalize their energy rapidly). Both of these are included in our CR treatment, so Fig. 3 shows the profiles of thermal heating of the gas owing to each term, compared to the total gas cooling rate. Even in m12i where the ratio of CR to thermal pressure is maximized, the CR heating is just a few percent of the total cooling rate; for less-massive halos the effect is even weaker (see Hopkins et al., 2019). In MW and lower-mass halos, cooling is simply too efficient, with at the range of temperatures of interest. Thus, consistent with Hopkins et al. (2019), we find CR heating is negligible for dwarf-through-MW mass halos at any radius.
3.4 CGM Gas Phases
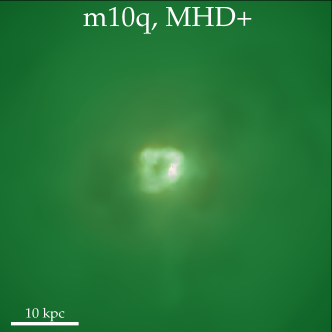

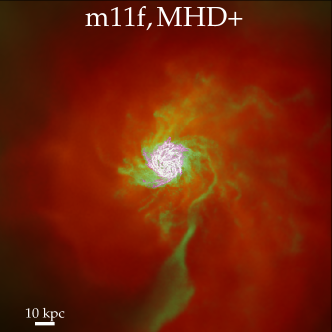
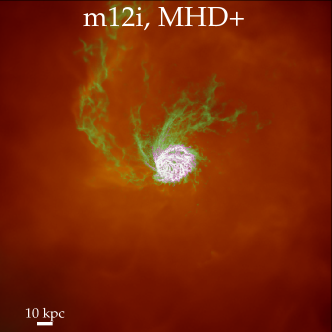
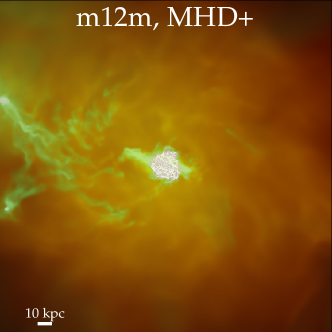
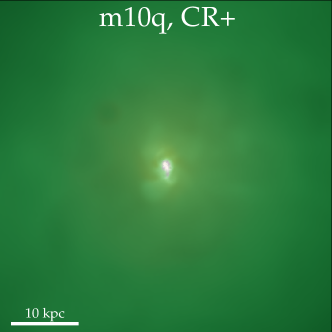
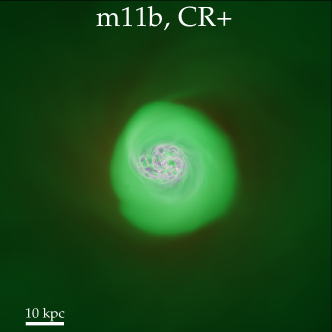
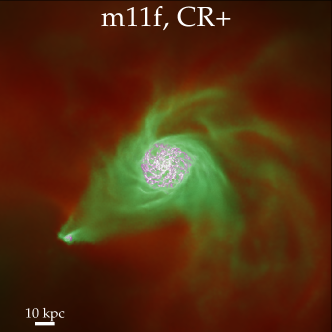
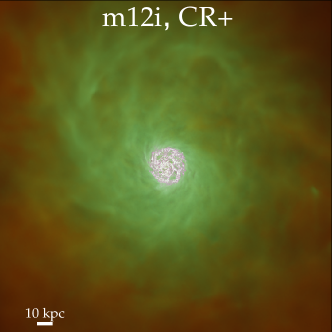


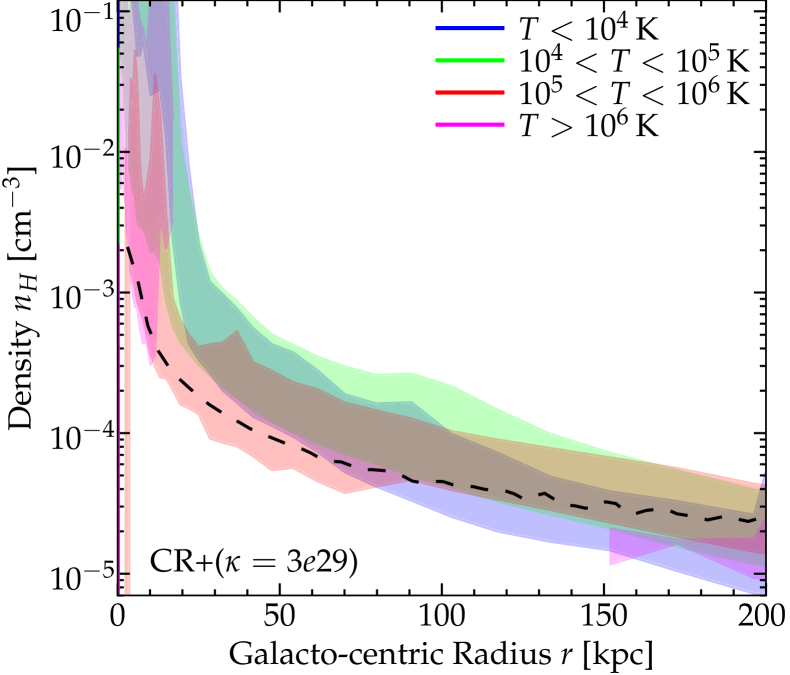
Fig. 4 shows a volume render of the CGM gas, highlighting different gas phases. At low (dwarf) halo masses m10b and m11b, there is no systematic difference between MHD+ and CR+ runs – the same is seen in similar volume-renders within the galaxies in Hopkins et al. (2019). However, as halos approach MW mass (, i.e. m11f and m12i), where we saw CR pressure dominate in the CGM in Fig. 1, we see a significant increase in the prominence and volume-filling-factor of cool and warm gas in the CR+ runs. In contrast, the MHD+ runs are dominated by hot gas, with warm/cool gas in the CGM restricted to filamentary structures with small volume-filling factor. Fig. 5 shows this quantitatively, plotting the gas density and temperature as a function of galacto-centric radii. The gas density profiles are similar between CR+ and MHD+ runs at all halo masses, but the temperature profiles differ dramatically in the CR+ runs of MW-mass halos. In e.g. m12i, the median temperature in the MHD+ run peaks at at kpc then slowly decays to at , while in the CR+ run it rises (outside the disk at kpc) from K at kpc to K at kpc. Halo m11f, being intermediate-mass, shows the same effect of CRs, but less dramatically. It is worth noting that although the total gas density profiles in Fig. 5, i.e. the total masses at any given radii, are similar between the MHD+ and CR+ runs, the detailed gas density and temperature distributions are significantly different. We discuss these phase structure differences in more detail in the following sections.
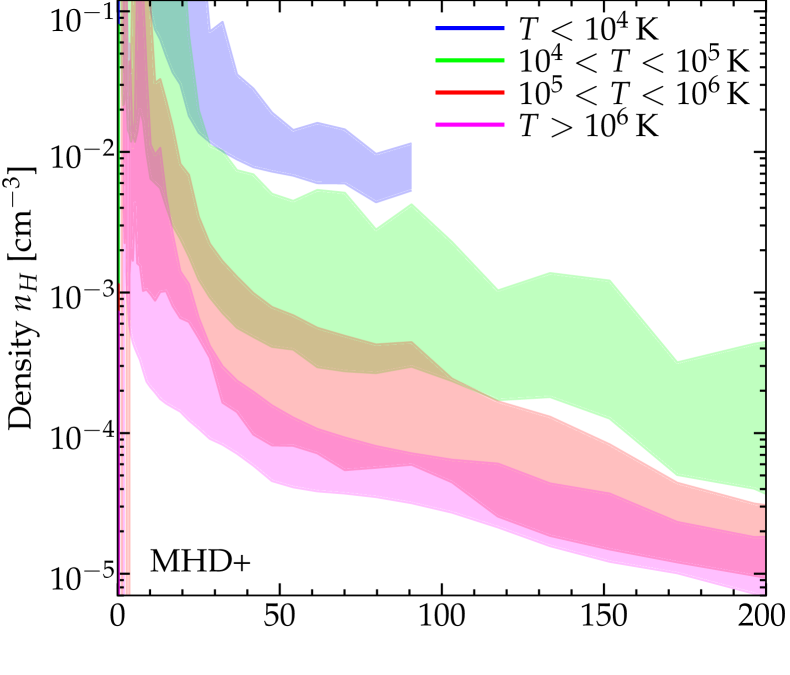
Figs. 6-7 examine the gas phases in more detail, in run m12i where the impact of CRs is most apparent. Fig. 6 shows the distribution of local densities for gas at different specific temperatures and radii : this allows us to directly compare the typical thermal pressure of different phases as at each . In the MHD+ runs, we see roughly at each , i.e. is constant independent of , so the gas phases are in local thermal pressure equilibrium with each other, in addition to “global” thermal pressure equilibrium with gravity (seen in Fig. 1). But in the CR+ run, the different phases all reside at approximately the same density (at a given ), independent of , so at a given , meaning that the cold(er) phases are “under-pressurized” relative to hot phases at the same radius, in addition to the total thermal pressure being globally below that needed for virial equilibrium (Fig. 1).
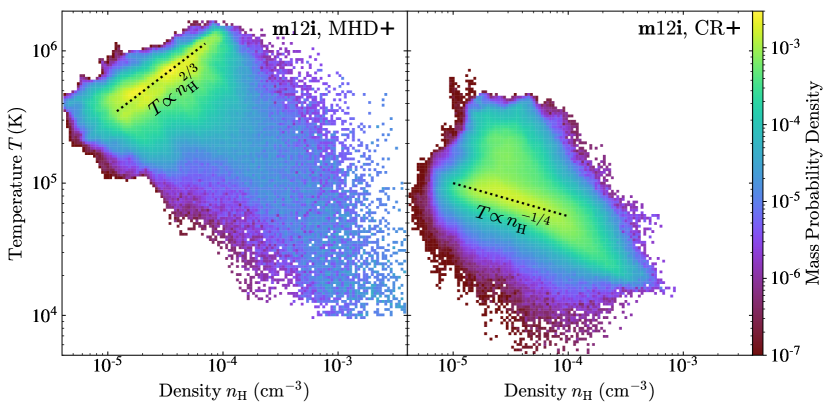
Fig. 7 shows the complementary diagram over a broad range of in the CGM. For the MHD+ run, most of the gas is in the hot phase above . There is a “ridge” of high probability density which directly corresponds to the median and radial trend in Fig. 5, i.e. position along the ridge is a progression in , along a simple adiabat with . In the CR+ run, the temperatures are cooler, and there is an analogous ridgeline tracing the radial profile, but here temperature anti-correlates with density, approximately following as expected for diffuse gas in photo-ionization equilibrium with the UV background at (see e.g., Stern et al. 2018).
Our findings that CRs can provide significant non-thermal pressure support in the CGM are qualitatively similar to the conclusions of Salem et al. (2016). However, we find in this work that the CR effects can be stronger. In particular, for our fiducial assumptions, we find that the CR pressure can dominate the thermal pressure by more than one order of magnitude in the entire CGM. On the other hand, in Salem et al. (2016) the volumes primarily supported by thermal pressure vs. CR pressure are comparable, with the CR pressure-supported cool gas limited to swath-like regions. As a result, there is more cool gas in the CGM of our Milky Way-mass simulations. This difference could be primarily due to our treatment of anisotropic CR diffusion and streaming with non-adiabatic CR energy losses, and a higher CR diffusion coefficient adopted in our simulations. With this CR treatment, the -ray emission of the whole galaxies matches observations very well over a wide range of galaxy masses (Chan et al., 2019). Salem et al. (2016) instead assumes isotropic diffusion with a lower CR diffusion coefficient, neglecting CR streaming and hadronic losses. They only considered the -ray emission in the CGM, but did not calculate or compare the -ray emission of the whole galaxies with observations.
3.5 Column Densities of Different Ions in the CGM
Given the difference in gas phases, it is natural to expect differences in observed column densities of different temperature-sensitive ions in the CGM. We post-process the simulations with Trident (Hummels et al., 2017) to calculate ion-number densities, using the simulation density, temperature, and metal abundances for each species, accounting for collisional and photo-ionization (with self-shielding included, where the ionization depth equals the local Jeans length with a maximum depth of when the self-shielding ion table is generated) from the UV background, and then integrate these alone sightlines with an ensemble of random viewing angles at each impact parameter and sampling each simulation snapshot with spacing of Myr over the redshift range of interest. We then measure the median and distribution of column densities for each ion over the ensemble of sightlines. A detailed description of this methodology, as well as the dependence of predicted column densities on e.g. numerical resolution, numerical methods for e.g. hydrodynamics and metal diffusion, halo mass, redshift, and other (non-CR) physics will be the subject of a companion paper (Hummels et al., in prep) – our focus here is exclusively on the systematic effect of CRs on the predicted columns.
The choice of UV background model is important for photoionization modeling. As shown in, for example, Faucher-Giguère (2020) the Faucher-Giguere et al. (2009) (FG09) UV background more accurately reproduces observations of the low-redshift () Ly forest compared to Haardt & Madau (2012) (HM12), which under-predicts observationally-inferred H i photo-ionization rates by a factor . However, FG09 did not include a detailed treatment of the contribution of obscured and non-obscured AGN to the UV background. As a result, the FG09 background likely under-estimates the low-redshift UV at energies higher than 4 Ry.666The newer Faucher-Giguère (2020) UV background model does include an improved treatment of obscured and non-obscured AGN, but Trident photoionization tables for this new model are not yet available. We therefore use a combination of the FG09 and HM12 background models for our ionic predictions. Specifically, we use FG09 for H i , Mg ii , Si iv and HM12 for N v , O vi , Ne viii . We show the effects of different UV background assumptions in Appendix B.
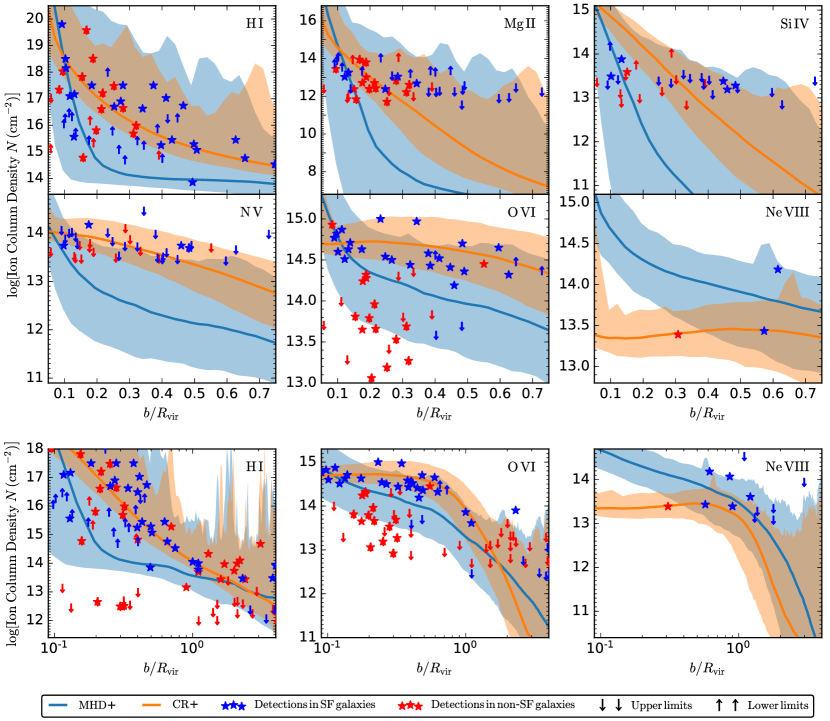
Fig. 8 compares the predicted ion column densities to observations. In the top two rows, predicted column density profiles are plotted as a function of impact parameter (normalized to virial radius which is for m12i) up to (corresponding to in m12i halo), with observations of H i from Prochaska et al. (2017b, a) and Mg ii , Si iv , N v , O vi from Werk et al. (2013) at ; and Ne viii from Burchett et al. (2018) at . On the bottom row, detections and upper limits of H i , O vi and Ne viii are plotted on a logarithmic scale up to a longer distance of ( in m12i halo), with H i and O vi observations at large radii from Johnson et al. (2015) included. We discuss each in turn:
3.5.1 Low Ions
Median H i columns in our CR+ run at are higher than those in the MHD+ run by factors . For MHD+, the median value of H i sharply declines and reached at , while in CR+ median declines gently and reaches the same column at .
Note that the maximum H i columns at any radius are similar or even higher in MHD+; in fact, the entire range of columns in the CR+ run lies within the range seen in MHD+, which also extends to much lower minimum H i columns. Also, the total H i mass in the CGM is similar for both MHD+ and CR+ runs. The difference in median and minimum columns can be explained by the morphology of the cool phase: in CR+ the cool-phase is volume-filling, while it is confined to dense filaments with small volume-filling-factor in MHD+. Thus, the median H i column across random sightlines is much higher in the CR+ run, and the dispersion or sightline-to-sightline variance is much smaller. The observed H i lower limits () at and median detections at suggest typical H i columns significantly larger than the median in the MHD run, and comparable to the predictions of the CR+ run, especially if we restrict to observations around star-forming galaxies (which m12i is).
Qualitatively similar behavior is evident in Mg ii , but given that most observations at are upper limits (and both CR+ and MHD+ runs produce similar maximal columns covering the range observed), the observations do not yet strongly favor one model or the other.
3.5.2 Mid Ions
Si iv columns show similar behavior to Mg ii and H i , with a slower drop in CR+ runs (higher median and minimum columns at large ). Interestingly, neither MHD+ nor CR+ well match observational constrains: the detections and upper limits seem to suggest a flatter Si iv profile, compared with which the CR+ predicted column density is too high in the inner halo () while the MHD+ predicted is too low in the outer halo ().
For N v and O vi at higher energy levels, we again see columns of N v and O vi fall more rapidly with in MHD+ runs compared to CR+ runs. In N v , the median columns are systematically higher in the CR+ run by one order of magnitude at all . The CR+ run better overlaps with the detections and upper limits, though if these upper limits reveal much lower columns it would favor the MHD+ run. For O vi , columns are enhanced by a factor at in CR+ compared to MHD+, and the profiles are relatively flat, with characteristic columns at which corresponds to in m12i. The O vi profile in CR+ at a larger scale, as shown in the mid-bottom panel, remains flat with a significantly higher normalization at , and features a sharper cutoff at than that in MHD+, which is more consistent with the detections and limits.
Indeed, the predicted difference in O vi between CR+ and MHD+ runs, falling within one order of magnitude, is less dramatic if compared to a difference of orders of magnitude in H i , in terms of the absolute numbers. However, we emphasize that the enhancement of O vi in CR+ runs is a qualitative change, since it could potentially solve the open problem of O vi as discussed in a substantial amount of recent papers (e.g., Faerman et al. 2017; Oppenheimer et al. 2017; Mathews & Prochaska 2017; Stern et al. 2018, 2019). Although can be reached with the assumption of a cooling quasi-static halo, many previous attempts struggle to get , by assuming either (1) some very strong heating mechanism which might overheat the low ions, (2) an extended O vi halo beyond which is inconsistent with the observed sharp cutoff, or (3) the O vi is photo-ionized and thus has such a low thermal pressure that some other form of pressure support is required. In our CR+ runs, as discussed later, it is the last case, where the low-pressure, photo-ionized O vi gas is supported by the CR pressure.
3.5.3 High Ions
Columns in Ne viii , on the other hand, are reduced in CR+ runs relative to MHD+ runs, consistent with an overall cooler CGM. The differences are relatively small beyond , but while the median Ne viii profile in CR+ remains flat with columns , in MHD+ it rises monotonically towards smaller as the medium CGM temperature also increases (Fig. 5), to at . With the FG09 UV background, Ne viii columns in CR+ runs are lower by another factor . Observationally, two detections appear more consistent with our MHD+ runs, while the other two favor the CR+ runs. This suggest more hot gas might be needed in halos around star-forming galaxies, but low number of detections makes drawing a strong conclusion difficult.
3.6 Collisional vs. Photo-Ionization
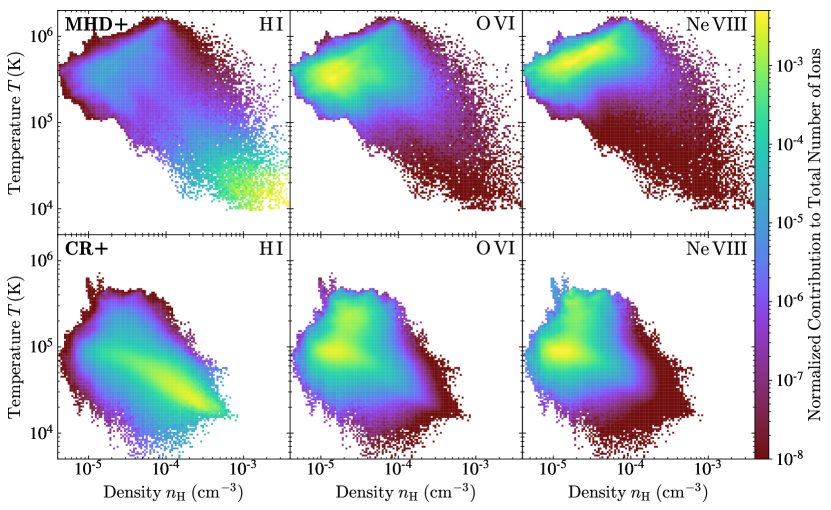
Fig. 9 shows the density-temperature diagram of CGM gas (as Fig. 7), weighted by the number of ions in H i , O vi , and Ne viii , for m12i at . In MHD+, most H i comes from the “tail” (containing little mass) of the population with K and , corresponding to the coolest and most dense filaments in the CGM, which are resistant to both collisional ionization (due to their low temperature) or photo-ionization (due to their high density). But in the CR+ run, H i is mainly contributed by the diffuse and volume-filling gas at a temperature range from . In spite of the low (but non-zero) neutral fraction in this temperature range, the total amount of gas falling in this range is much larger than that at higher densities and lower temperatures, so it dominates the H i columns.
For MHD+, the O vi is distributed along two “strips” on the plot: one is horizontal at , which is the temperature at which the O vi ion fraction peaks due to collisional ionization; the other follows a positive slope along which the decrease of the O vi ion fraction due to higher is compensated by larger amounts of gas along the “ridgeline” where most of the gas resides in Fig. 7. In either case, most O vi is contributed by collisional ionization from the warm halo gas with temperature . For CR+, there is far less gas at high temperatures, so we see some of the O vi coming from collisional ionization with K, while a comparable but somewhat larger fraction comes from photo-ionized gas with K and . We note that this is where the choice of UV background makes some difference: the same qualitative differences appear with the FG09 background, but the photo-ionization of gas with K and is somewhat less efficient, giving rise to overall less O vi and moving the balance between collisional and photo-ionization somewhat more in favor of collisional ionization.
For Ne viii , the same qualitative effect is even more pronounced: almost all the Ne viii in MHD+ comes from the “ridgeline” of hot gas from Fig. 7 with K where it can be collisionally ionized, while in CR+ there is so little gas at these high temperatures that photo-ionization of gas with K, dominates Ne viii . Photo-ionization is less efficient at ionizing the higher-energy Ne viii , so this produces overall less Ne viii column compared to MHD+ case, as seen in Fig. 7.
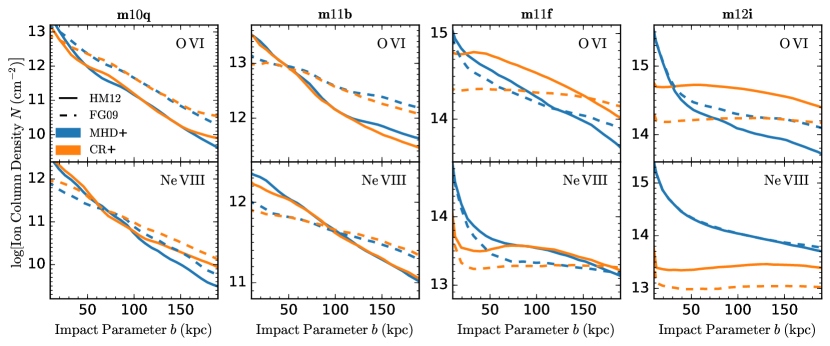
3.7 Dependence on Halo Mass and Redshift

Fig. 10 extends our comparison from Fig. 8 to halos of different mass, focusing on H i , O vi , and Ne viii as representative ions. As expected from Figs. 1-5, for dwarfs (m10q, m11b), there is no significant difference between MHD+ and CR+ runs. For the other MW-mass halo m12m, despite having a very different halo and star formation history and substantially different galaxy structure (see Hopkins, 2018b), the effects of CRs are very similar to m12i but the magnitude of difference is less pronounced.. For the intermediate-mass m11f, the differences in H i and O vi between CR+ and MHD+ runs are qualitatively similar (but smaller in magnitude) to m12i. However, as a lower-mass halo m11f has a virial temperature too low to collisionally ionize Ne viii , so in both MHD+ and CR+ runs it is photo-ionization dominated, and so the CR+ run produces an enhancement (rather than a decrease) in Ne viii columns at larger radii kpc akin to the enhancement in O vi (owing to the cool gas being more diffuse and hence more easily-ionized).777While the choice of FG09 or HM12 UV backgrounds make relatively little difference for the Ne viii in m12i and m12m, as it is collisionally-ionized, in m09, m10q, and m11f the Ne viii is photo-ionized in the MHD+ and CR+ runs, so the HM12 background predicts a factor higher Ne viii column in each case.
The dependence on redshift is also investigated by contrasting CR+ with MHD+ runs in m12z2, a halo that reaches MW-mass already at . Despite the fact that these are exactly the masses where we saw the most dramatic effects in m12i and m12m, we see very little effect of CRs on the columns at . This is consistent with the analysis in Hopkins et al. (2019), which showed that galaxy properties, star formation histories, and all other properties analyzed therein for these simulations were influenced by CRs only at ; they also explicitly showed that MW-mass halos at have CR pressure insufficient to balance gravity. As discussed below, from simple analytic arguments we expect this, as a consequence of the much higher CGM densities, accretion, and cooling rates at high-.
4 Interpretation and Implications
4.1 Equilibrium Scalings
We showed above that effects of CRs are maximized at MW masses () at low redshifts (), where halo gas is supported by CR pressure instead of thermal pressure. A simple physical explanation for this is given in Hopkins et al. (2019): if we assume CRs originate from a point-source galaxy (small compared to the CGM), transport with isotropically-averaged bulk transport speed (where and represent the CR streaming speed and diffusion, respectively, as we model them), have negligible losses, and are in steady-state with an injection rate (where in our simulations and ), then the CR pressure is . This analytic estimation produces resonable CR pressure gradient profiles which are consistent with our simulation results, as shown in Fig. 1. For a CGM in an isothermal sphere obeying the usual virial scalings for dark matter, Hopkins et al. (2019) further showed that the corresponding ratio of the radial CR pressure gradient to gravitational force in a star-forming galaxy is:
| (1) |
where , is the mass ratio of gas to total matter in the halo, is the universal baryon fraction, and is a dimensionless specific star formation rate. Hopkins et al. (2019) shows this provides a reasonable approximation to as a function of and .
This shows that the importance of CRs in the CGM scales with the stellar-to-halo mass ratio , which drops precipitously in dwarf galaxies: CRs are injected at too-low a rate (given lower and hence and ), they escape too effectively, and (in addition) there is no real hot, quasi hydro-static gaseous halo present for them to “work upon.” We also see the term , which originates from the fact that the CGM is more dense at high redshifts (, determined by the fast increase of the characteristic density of the CGM with redshift that is only partially compensated by a slower increase of the input rates of the CRs at a given halo mass with redshift), and shows that CRs should decrease in importance at high redshifts.
Now consider a massive, low- halo where CR pressure balances gravity as shown in Fig. 1, so , giving . Gas with will sink, while that with will float, until it reaches the radius where , independent of gas temperature. This estimate of matches the density profiles of CR+ simulations quite well, as shown in Fig. 5. In contrast, in MHD+ runs where thermal pressure dominates, virial balance specifically implies a characteristic temperature , with small-scale fluctuations in local thermal pressure equilibrium ().
4.2 Multiphase Structure

In CR-dominated halos, note that the equilibrium density defined above (§ 4.1) does not depend on gas temperature, which implies gas at at a given may well be at different temperatures. This is seen in Fig. 6, where gas at orders-of-magnitude different temperatures co-exists at similar densities at the same radius . In CR+ runs, the cool phase can therefore remain out of thermal pressure equilibrium with the hot medium: it prefers at , as compared to MHD+ cases where thermal pressure dominates so cool phase gas must be in local thermal pressure equilibrium (so ). Thus the CR+ runs can support (via CR pressure) a smoothly-distributed and volume-filling cool phase, consistent with the gas morphology plot in Fig. 4, and the column density profiles in Fig. 8. Some qualitatively similar effects have been seen in idealized simulations of galactic outflows, as well (see e.g. Girichidis et al., 2018).
In greater detail, Fig. 11 considers local pressure fluctuations instead of the global pressure gradient, specifically comparing gas thermal, CR, and total pressure of gas in a narrow shell at a specific kpc, in the CR+ run. The pressure fluctuations are largely confined to the “shell surface” (i.e. directions tangential to , not along ), so they do not alter the global radial force balance between CRs and gravity. The thermal pressure is largely below , corresponding to cool phase gas at a few , though there are some regions where thermal pressure exceeds in the warm phase with K. The CR pressure is generally larger than thermal by a factor , but in warm regions where thermal pressure peaks, CR pressures drop to a minimum value comparable to or even less than the local thermal pressure. Fig. 11 implies that although the cool and hot phases are out of thermal pressure equilibrium, they are indeed in total pressure equilibrium with CR pressure taken into account, i.e. constant at a given . Quantitatively speaking, in Fig. 11, the standard deviation of the thermal pressure is , while that of the total pressure is only . As these fluctuations evolve, hot phase-gas carrying high thermal pressure rapidly flows into and becomes embedded in the “troughs” of CR pressure fluctuations, while cool phases (at ) are weakly “squeezed” by this hot gas while being smoothed by bulk CR pressure.
It is also useful to present some numbers regarding the total mass of cool gas, for the m12i CR+ run as a representative MW-mass halo. The total cool () gas masses in m12i at are respectively (), (), () and (). A significant amount of the halo baryon budget in this model resides at large scale, consistent with the observational claim that the inner halo of galaxies is baryon deficient (Bregman et al., 2018), and similar to observational estimates of a total gas mass within the virial radius (e.g., Stocke et al. 2013b; Werk et al. 2014; Stern et al. 2016; Prochaska et al. 2017b; Keeney et al. 2017). The m12m run, which has a similar halo mass with m12i, produces relatively less cool gas than m12i, with a difference of for up to for . This indicates that although the qualitative properties of the CGM are similar in halos of the same mass at , different accretion histories can introduce some variations. A detailed quantification of how the accretion history affects CGM properties is beyond the scope of this work.
4.3 Photoionized O vi & Characteristic Columns
We can write the O vi number density as , where is the ionization correction (fraction of O in O vi ); , , and are the oxygen mass fraction per unit metal mass, metallicity, and dimensionless mean molecular weight of O (so is the number of O nuclei per nucleon), and is the nucleon number density. For the MW-mass, CR+ runs, the median gas density and temperature run from at kpc to at kpc roughly following (Fig. 5) and it is this gas which contributes most of the O vi (Fig. 9). Along this temperature-density range, for the UV background at , the value of given by photo-ionization is approximately constant at (see e.g. Fig. 3 of Stern et al. 2018). If we assume solar abundance ratios () and (representative of the outer halo with kpc), and integrate888We integrate between radii where , i.e. , as outside this range the photo-ionized fraction drops rapidly. to obtain the column density along a median sightline at impact parameter , we obtain a characteristic column . Both the typical value, and fairly flat profile (falling by just a factor from kpc) is broadly consistent with our O vi column density profile in Fig. 8.
Scaling this to other halos, assuming the gas lives along the value given by equilibrium with CR pressure, predicts a relatively weak dependence of the on halo mass, until (at dwarf masses) the density falls below the minimum density at all radii, at which point and fall rapidly. This occurs for our m11b and m10q runs (compare Figs. 5, 10).
The characteristic density and distances/path-lengths kpc of the O vi gas therefore naturally result in the CR+ runs from primarily photo-ionized gas (as argued by Stern et al. 2018 based on the observed H i associated with the observed O vi ), supported by CR pressure. It is worth noting that “maintaining” the O vi observed is energetically demanding if it is collisionally ionized (see Lehner et al., 2014; Oppenheimer et al., 2017; McQuinn & Werk, 2018; Stern et al., 2018, 2019; Ji et al., 2019), as it must be kept near the peak of the cooling curve.
The CR-dominated scenario may also explain the observed differences in O vi between star-forming and non-star-forming galaxies: in steady state, the CR pressure is proportional to the CR injection, hence star formation rate, so the CR pressure becomes subdominant around galaxies in which star formation is quenched. Therefore, in order to maintain a high thermal pressure, the halo gas must be either hot and diffuse, or cold and dense. In either case, the gas may not be able to produce sufficient O vi column densities via either photoionization or collisional ionization. However, we caution that if quenching owes to AGN producing CRs (Su et al., 2019), the above considerations may not apply.
Some previous studies have argued against a photo-ionization origin for O vi , but in fact our CR+ simulations here naturally explain the supposedly problematic observations. For example, Werk et al. (2016) argue that reproducing the N v /O vi ratios requires path-lengths kpc, which they assumed were unphysically large. But our CR+ simulations do reproduce the observed N v /O vi ratios (Fig. 8), and indeed do have path lengths reaching kpc, so these are clearly not unphysical. There are several factors of (owing to e.g. slightly different metallicity, temperature structure, and UV background shape, compared to that assumed in Werk et al. 2016) which reduce the required path lengths for O vi in our simulations. But the most important distinction is that Werk et al. (2016) implicitly assumed O vi would be in local thermal pressure equilibrium, requiring it be confined to much smaller, denser structures (as in our MHD+ runs), while in our CR+ runs the fact that it is not in thermal pressure equilibrium means it can be diffuse and volume-filling over a kpc radius (Fig. 6). Moreover, the diffuse, volume-filling nature of the O vi gas on scales kpc naturally explains the “broad” linewidths of seen in the high-column O vi absorbers: these are tracing the bulk motions of the gas (inflow/outflow/mergers/sloshing/rotation/etc.), just like the usual assumption for models of volume-filling collisionally ionized gas – the O vi is not coming from dense clouds or filaments. A more detailed study of the absorber kinematics will be the subject of future work.
5 Discussion & Conclusions
We have investigated the impact of cosmic rays on the CGM in FIRE-2 simulations, comparing fully-cosmological magnetohydrodynamic (“MHD+”) simulations including anisotropic conduction and viscosity and detailed models for for the ISM, cooling, star formation, and stellar feedback, to models including these physics as well as explicit CR transport and gas coupling (including anisotropic streaming and diffusion, collisional and streaming losses, and injection in SNe). In this study, we analyze six representative halos from the FIRE-2 suite, with halo masses ranging from to . We have in previous work ensured that the simulations with CRs (“CR+”) reproduce observational constraints on CR populations in both the MW and nearby galaxies. Here, we explore the physical state of the CGM, with and without CRs, in halos from ultra-faint dwarf through MW masses. We construct mock observations of absorption-line profiles to compare directly with observed column density distributions of various ions as a function of impact parameter from galaxies.
5.1 Conclusions
Our main conclusions are as follows.
-
1.
CR pressure can dominate the CGM pressure at radii kpc, supporting the gas. For MW-mass halos, the CR pressure gradient in our CR+ runs is larger than the thermal pressure gradient by more than one order of magnitude in the CGM, and dominates the support of the gas against gravity. The effect of CRs shows a strong halo mass dependence: CRs are negligible in the CGM of dwarfs (), but become important in intermediate-mass halos (a few ), and dominant in the MW-mass halos ().
-
2.
In CR pressure-dominated halos, CRs can change the phase and morphology of the halo gas dramatically. In MW-mass halos, the dominant gas temperature decreases from (in our MHD+ runs) to a few (in our CR+ runs). In the CR+ runs, the hot () gas in the halo nearly disappears, and the cool ( a few ) gas becomes volume-filling (as compared to tightly-confined in dense clumps or filaments, in the MHD+ runs).
-
3.
An equilibrium gas density is implied by balancing CR pressure support and gravity in CR pressure-dominated halos. This equilibrium density is independent of the gas temperature, and indeed we show that halo gas with orders-of-magnitude different temperatures can co-exist at similar densities (at a given galacto-centric radius) in our CR+ runs. As a consequence (because the CRs provide most of the pressure), the cool phase appears “under-pressured” – i.e. out of local thermal pressure equilibrium with the warm/hot phases (, although we show it is in approximate total pressure equilibrium). This also means that the density structure of the CGM is “smoother” in CR+ runs, since cool gas can be volume-filling as opposed to confined (as noted above).
-
4.
In CR+ runs, the CR pressure and gas pressure are locally anti-correlated, with the total pressure roughly constant in spherical shells in the CGM at a given galacto-centric radius. Thus halo gas is in both local total pressure balance as well as global (virial) pressure balance in the halo, but only when CR pressure is included. CR pressure is therefore dominant in cool-phase gas (making up for its low thermal pressure), but becomes increasingly sub-dominant in warm/hot phases.
-
5.
In CR pressure-dominated, MW-mass halos, all ions (H i –Ne viii ) observed by COS are primarily photo-ionized, including O vi and Ne viii which are predominantly collisionally-ionized in the MHD runs. As a consequence of this and the overall shift in the phase/temperature of the gas, CRs effectively enhance the column densities of the low and mid ions contributed by the photo-ionized cool gas, and reduce the column densities of the high ions owing to the decrease of collisionally-ionized hot gas. The CR+ runs yield O vi , H i and N v columns qualitatively consistent with observational detections and limits, in contrast with the MHD runs which under-predict O vi and H i . The CR+ runs however over-predict the observed Si iv columns at . In addition, in CR+ runs, the sightline-to-sightline scatter in the low/mid ion column densities becomes much smaller, owing to the change in phase structure (with cool gas more volume-filling and at closer to uniform densities , as opposed to concentrated in much denser clumps with low volume-filling factors).
-
6.
For MW-mass halos, O vi comes primarily from collisional ionization of warm gas around in our MHD+ runs, but from photo-ionization of cool gas around and below in our CR+ runs. When CR pressure is dominant, given the UV background model adopted here, typical O vi column densities are at impact parameters out to , consistent with observations of low redshift SF galaxies, as the gas number density remains near and above at which the photo-ionized O vi fraction peaks. We caution that the absolute value of the O vi and Ne viii columns is sensitive to the shape of the UV background assumed, when photo-ionization dominates the observed ions, but our qualitative conclusions about the effects of CRs remain robust to the exact choice of UV background.
5.2 Caveats
This work is subject to a number of caveats due to both observational and theoretical uncertainties.
-
1.
CR transport physics: The major theoretical uncertainty here comes from assuming a spatially and temporally-constant effective CR diffusion coefficient (with streaming at ) in our simulations. Hopkins et al. (2019) showed that much lower , for example, can produce much weaker effects of CRs in galaxies. While the value of adopted here is calibrated to reproduce CR population modeling in the MW and -ray observations in nearby galaxies (Chan et al., 2019; Hopkins et al., 2019), these observations only really constrain the value of in the ISM and “inner CGM” (kpc) at . It is plausible that the CR diffusivity increases rapidly as CRs propagate into the CGM (with lower gas densities and magnetic fields), allowing CRs to freely escape instead of being confined inside halos as they are in our CR+ runs. The median diffusivity may also evolve in time: at high redshifts merger and inflow/outflow activity could enhance turbulence and modify CR diffusion (Beresnyak et al., 2011). Better observational and theoretical constrains on CR propagation are under active investigation and will definitely benefit future work.
-
2.
Resolution and other small-scale physics: Our simulations might not fully capture some interesting small-scale processes. For example, CRs may modify un-resolved hydrodynamic instabilities (Suzuki et al., 2014) and thermal instabilities, and the propagation of CRs can be altered by the micro-scale structure and damping of MHD turbulence (Lazarian, 2016; Xu et al., 2016). Even in hydrodynamic cases, various authors have argued that higher resolution allows better resolution of thermal instabilities and can therefore be especially important for resolution of cool ions (McCourt et al., 2017; Peeples et al., 2018; Hummels et al., 2018; van de Voort et al., 2018). A detailed study of the effects of resolution on our CGM predictions will be presented in future work (Hummels et al., in prep.); however we have compared our MW-mass halos with and without CRs at mass resolution levels and find that while there is some resolution dependence to our predictions, the systematic effect of CRs, and essentially all of our predictions here, are similar at all resolution levels. And for our dwarfs we have compared simulations at resolution , over which range we see negligible resolution dependence in either MHD+ or CR+ runs. Both of these conclusions are also consistent with the comparison of resolution effects on galaxy properties in the MHD+ and CR+ runs presented in Chan et al. (2019) and Hopkins et al. (2019).
-
3.
Hot components and other CGM observables: In our CR-dominated MW-mass halos, the hot phase with (and Ne viii ) is strongly suppressed at radii , while some X-ray observations suggest the existence of such a hot phase at in the MW halo (e.g, Fang et al. 2012). But it is also possible that the MW X-rays might come from small scales (see Bregman et al. 2018; Stern et al. 2019), or be generated by diffuse gas with very little mass (hence, un-resolved in our fixed mass-resolution simulations) in hybrid CR/thermal winds (Everett et al., 2008). A quantitative comparison to X-ray observations and other CGM observables (including e.g. the SZ effect, absorber kinematics, emission, and more) is clearly needed.
-
4.
AGN: We have neglected AGN in our study here, since the main focus of this paper is the galaxy halos with halo mass . In massive () halos, AGN jets or “bubbles” can contain large CR energies (orders-of-magnitude larger than those produced by SNe) and AGN feedback may well dominate the dynamics of the CGM: we are exploring this in parallel work (see e.g. Su et al., 2018; Su et al., 2019). One important conclusion from this work and Hopkins et al. (2019) is that CRs from SNe alone become less significant in halos with masses much larger than MW-like, owing to the larger CGM pressure and higher temperatures, and their lower SFR (hence SNe) rates. For simple energetic reasons (given the observed BH-host galaxy scaling relations; see Kormendy & Ho 2013), it is generally believed that in the lower-mass halos studied here, AGN feedback is sub-dominant, but this remains to be tested.
Therefore, we can not assert that the CRs must necessarily exert a major influence on the CGM – it is perfectly plausible that reality lies “in between” our MHD+ and CR+ runs. Instead, we argue that CRs could be essential to the physics of the CGM, and propose a model of the CGM which is dominated by CR pressure which makes a number of distinct predictions.
Acknowledgments
We thank the anonymous referee for a constructive and insightful report which improved our paper. SJ is supported by a Sherman Fairchild Fellowship from Caltech. SJ thanks Joe Burchett, Zheng Cai, Taotao Fang, Peng Oh, J. Xavier Prochaska, Gwen Rudie, Mateusz Ruszkowski, Britton Smith, Daniel Wang and Jessica Werk for many helpful comments and discussions, and the Aspen Center for Physics supported by NSF PHY-1607611 for its hospitality where part of this work was completed. Support for PFH and co-authors was provided by an Alfred P. Sloan Research Fellowship, NSF Collaborative Research Grant #1715847 and CAREER grant #1455342, and NASA grants NNX15AT06G, JPL 1589742, 17-ATP17-0214. DK was supported by NSF grant AST-1715101 and the Cottrell Scholar Award from the Research Corporation for Science Advancement. CAFG was supported by NSF through grants AST-1517491, AST-1715216, and CAREER award AST-1652522, by NASA through grant 17-ATP17-0067, by STScI through grants HST-GO-14681.011, HST-GO-14268.022-A, and HST-AR-14293.001-A, and by a Cottrell Scholar Award from the Research Corporation for Science Advancement. Numerical calculations were run on the Caltech compute cluster “Wheeler”, allocations from XSEDE TG-AST120025, TG-AST130039 and PRAC NSF.1713353 supported by the NSF, and NASA HEC SMD-16-7592. We have made use of NASA’s Astrophysics Data System. Data analysis and visualization are made with Python 3, and its packages including NumPy (Van
Der Walt et al., 2011), SciPy (Oliphant, 2007), Matplotlib (Hunter, 2007), Healpy (Górski
et al., 2005; Zonca et al., 2019), the yt astrophysics analysis software suite (Turk et al., 2010) and the absorption spectra tool Trident (Hummels
et al., 2017), as well as the spectral simulation code CLOUDY (Ferland
et al., 2017).
Data Availability
The data supporting the plots within this article are available on reasonable request to the corresponding author. A public version of the GIZMO code is available at http://www.tapir.caltech.edu/~phopkins/Site/GIZMO.html.
Additional data including simulation snapshots, initial conditions, and derived data products are available at http://fire.northwestern.edu.
References
- Anderson et al. (2015) Anderson M. E., Churazov E., Bregman J. N., 2015, MNRAS, 452, 3905
- Anglés-Alcázar et al. (2017) Anglés-Alcázar D., Faucher-Giguère C.-A., Kereš D., Hopkins P. F., Quataert E., Murray N., 2017, Monthly Notices of the Royal Astronomical Society, 470, 4698
- Bahcall & Spitzer Jr (1969) Bahcall J. N., Spitzer Jr L., 1969, The Astrophysical Journal, 156, L63
- Begelman & Fabian (1990) Begelman M. C., Fabian A., 1990, Monthly Notices of the Royal Astronomical Society, 244, 26P
- Beresnyak et al. (2011) Beresnyak A., Yan H., Lazarian A., 2011, The Astrophysical Journal, 728, 60
- Braginskii (1965) Braginskii S. I., 1965, Reviews of Plasma Physics, 1, 205
- Bregman et al. (2018) Bregman J. N., Anderson M. E., Miller M. J., Hodges-Kluck E., Dai X., Li J.-T., Li Y., Qu Z., 2018, The Astrophysical Journal, 862, 3
- Bryan & Norman (1998) Bryan G. L., Norman M. L., 1998, ApJ, 495, 80
- Burchett et al. (2018) Burchett J. N., et al., 2018, arXiv preprint arXiv:1810.06560
- Butsky & Quinn (2018) Butsky I. S., Quinn T. R., 2018, The Astrophysical Journal, 868, 108
- Cai et al. (2017) Cai Z., et al., 2017, ApJ, 839, 131
- Cantalupo et al. (2014) Cantalupo S., Arrigoni-Battaia F., Prochaska J. X., Hennawi J. F., Madau P., 2014, Nature, 506, 63
- Cen (2013) Cen R., 2013, The Astrophysical Journal, 770, 139
- Chan et al. (2019) Chan T., Kereš D., Hopkins P., Quataert E., Su K., Hayward C., Faucher-Giguère C., 2019, Monthly Notices of the Royal Astronomical Society, 488, 3716
- Colbrook et al. (2017) Colbrook M. J., Ma X., Hopkins P. F., Squire J., 2017, MNRAS, 467, 2421
- Cowie & McKee (1977) Cowie L. L., McKee C. F., 1977, ApJ, 211, 135
- Dekel & Birnboim (2006) Dekel A., Birnboim Y., 2006, Monthly notices of the royal astronomical society, 368, 2
- Dursi & Pfrommer (2008) Dursi L., Pfrommer C., 2008, The Astrophysical Journal, 677, 993
- Escala et al. (2018) Escala I., et al., 2018, MNRAS, 474, 2194
- Everett et al. (2008) Everett J. E., Zweibel E. G., Benjamin R. A., McCammon D., Rocks L., Gallagher III J. S., 2008, The Astrophysical Journal, 674, 258
- Faerman et al. (2017) Faerman Y., Sternberg A., McKee C. F., 2017, The Astrophysical Journal, 835, 52
- Fang et al. (2012) Fang T., Bullock J., Boylan-Kolchin M., 2012, The Astrophysical Journal, 762, 20
- Faucher-Giguère (2020) Faucher-Giguère C.-A., 2020, Monthly Notices of the Royal Astronomical Society, 493, 1614
- Faucher-Giguere et al. (2009) Faucher-Giguere C.-A., Lidz A., Zaldarriaga M., Hernquist L., 2009, The Astrophysical Journal, 703, 1416
- Faucher-Giguère et al. (2015) Faucher-Giguère C.-A., Hopkins P. F., Kereš D., Muratov A. L., Quataert E., Murray N., 2015, Monthly Notices of the Royal Astronomical Society, 449, 987
- Faucher-Giguère et al. (2016) Faucher-Giguère C.-A., Feldmann R., Quataert E., Kereš D., Hopkins P. F., Murray N., 2016, Monthly Notices of the Royal Astronomical Society: Letters, 461, L32
- Ferland et al. (2017) Ferland G., et al., 2017, arXiv preprint arXiv:1705.10877
- Fielding et al. (2016) Fielding D., Quataert E., McCourt M., Thompson T. A., 2016, Monthly Notices of the Royal Astronomical Society, 466, 3810
- Girichidis et al. (2018) Girichidis P., Naab T., Hanasz M., Walch S., 2018, Monthly Notices of the Royal Astronomical Society, 479, 3042
- Gnat et al. (2010) Gnat O., Sternberg A., McKee C. F., 2010, The Astrophysical Journal, 718, 1315
- Górski et al. (2005) Górski K. M., Hivon E., Banday A. J., Wandelt B. D., Hansen F. K., Reinecke M., Bartelmann M., 2005, ApJ, 622, 759
- Grenier et al. (2015) Grenier I. A., Black J. H., Strong A. W., 2015, Annual Review of Astronomy and Astrophysics, 53, 199
- Guo & Oh (2008) Guo F., Oh S. P., 2008, MNRAS, 384, 251
- Haardt & Madau (2012) Haardt F., Madau P., 2012, The Astrophysical Journal, 746, 125
- Hafen et al. (2017) Hafen Z., et al., 2017, Monthly Notices of the Royal Astronomical Society, 469, 2292
- Hafen et al. (2018) Hafen Z., et al., 2018, arXiv preprint arXiv:1811.11753
- Hahn & Abel (2011) Hahn O., Abel T., 2011, MNRAS, 415, 2101
- Hennawi et al. (2015) Hennawi J. F., Prochaska J. X., Cantalupo S., Arrigoni-Battaia F., 2015, Science, 348, 779
- Holman et al. (1979) Holman G. D., Ionson J. A., Scott J. S., 1979, ApJ, 228, 576
- Hopkins (2015) Hopkins P. F., 2015, MNRAS, 450, 53
- Hopkins (2016) Hopkins P. F., 2016, MNRAS, 462, 576
- Hopkins (2017) Hopkins P. F., 2017, MNRAS, 466, 3387
- Hopkins (2018a) Hopkins P. F. e. a., 2018a, MNRAS, in preparation
- Hopkins (2018b) Hopkins P. F. e. a., 2018b, MNRAS, 480, 800
- Hopkins & Raives (2016) Hopkins P. F., Raives M. J., 2016, MNRAS, 455, 51
- Hopkins et al. (2013) Hopkins P. F., Narayanan D., Murray N., 2013, MNRAS, 432, 2647
- Hopkins et al. (2014) Hopkins P. F., Kereš D., Oñorbe J., Faucher-Giguère C.-A., Quataert E., Murray N., Bullock J. S., 2014, Monthly Notices of the Royal Astronomical Society, 445, 581
- Hopkins et al. (2018) Hopkins P. F., et al., 2018, MNRAS, 477, 1578
- Hopkins et al. (2019) Hopkins P. F., et al., 2019, arXiv preprint arXiv:1905.04321
- Hopkins et al. (2020) Hopkins P. F., Squire J., Chan T., Quataert E., Ji S., Keres D., Faucher-Giguère C.-A., 2020, arXiv preprint arXiv:2002.06211
- Hummels et al. (2013) Hummels C. B., Bryan G. L., Smith B. D., Turk M. J., 2013, Monthly Notices of the Royal Astronomical Society, 430, 1548
- Hummels et al. (2017) Hummels C. B., Smith B. D., Silvia D. W., 2017, The Astrophysical Journal, 847, 59
- Hummels et al. (2018) Hummels C. B., et al., 2018, arXiv preprint arXiv:1811.12410
- Hunter (2007) Hunter J. D., 2007, Computing in science & engineering, 9, 90
- Ji et al. (2018) Ji S., Oh S. P., McCourt M., 2018, Monthly Notices of the Royal Astronomical Society, 476, 852
- Ji et al. (2019) Ji S., Oh S. P., Masterson P., 2019, Monthly Notices of the Royal Astronomical Society, 487, 737
- Jiang & Oh (2018) Jiang Y.-F., Oh S. P., 2018, ApJ, 854, 5
- Johnson et al. (2015) Johnson S. D., Chen H.-W., Mulchaey J. S., 2015, Monthly Notices of the Royal Astronomical Society, 449, 3263
- Keeney et al. (2017) Keeney B. A., et al., 2017, The Astrophysical Journal Supplement Series, 230, 6
- Kereš et al. (2005) Kereš D., Katz N., Weinberg D. H., Davé R., 2005, Monthly Notices of the Royal Astronomical Society, 363, 2
- Komarov et al. (2014) Komarov S., Churazov E., Schekochihin A., ZuHone J., 2014, Monthly Notices of the Royal Astronomical Society, 440, 1153
- Komarov et al. (2018) Komarov S., Schekochihin A. A., Churazov E., Spitkovsky A., 2018, Journal of Plasma Physics, 84, 905840305
- Kormendy & Ho (2013) Kormendy J., Ho L. C., 2013, ARA&A, in press, arXiv:1304.7762,
- Kroupa (2001) Kroupa P., 2001, MNRAS, 322, 231
- Krumholz & Gnedin (2011) Krumholz M. R., Gnedin N. Y., 2011, ApJ, 729, 36
- Kulsrud (2005) Kulsrud R. M., 2005, Plasma physics for astrophysics. Princeton, N.J. : Princeton University Press
- Kulsrud & Pearce (1969) Kulsrud R., Pearce W. P., 1969, ApJ, 156, 445
- Kwak & Shelton (2010) Kwak K., Shelton R. L., 2010, The Astrophysical Journal, 719, 523
- Lazarian (2016) Lazarian A., 2016, The Astrophysical Journal, 833, 131
- Lehner et al. (2014) Lehner N., O’Meara J. M., Fox A. J., Howk J. C., Prochaska J. X., Burns V., Armstrong A. A., 2014, The Astrophysical Journal, 788, 119
- Leitherer et al. (1999) Leitherer C., et al., 1999, ApJS, 123, 3
- Li et al. (2008) Li J.-T., Li Z., Wang Q. D., Irwin J. A., Rossa J., 2008, Monthly Notices of the Royal Astronomical Society, 390, 59
- Liang et al. (2016) Liang C. J., Kravtsov A. V., Agertz O., 2016, Monthly Notices of the Royal Astronomical Society, 458, 1164
- Ma et al. (2015) Ma X., Hopkins P. F., Faucher-Giguère C.-A., Zolman N., Muratov A. L., Kereš D., Quataert E., 2015, Monthly Notices of the Royal Astronomical Society, 456, 2140
- Mathews & Prochaska (2017) Mathews W. G., Prochaska J. X., 2017, The Astrophysical Journal Letters, 846, L24
- McCourt et al. (2015) McCourt M., O’Leary R. M., Madigan A.-M., Quataert E., 2015, Monthly Notices of the Royal Astronomical Society, 449, 2
- McCourt et al. (2017) McCourt M., Oh S. P., O’Leary R., Madigan A.-M., 2017, Monthly Notices of the Royal Astronomical Society, 473, 5407
- McGaugh et al. (2009) McGaugh S. S., Schombert J. M., De Blok W., Zagursky M. J., 2009, The Astrophysical Journal Letters, 708, L14
- McKenzie & Voelk (1982) McKenzie J. F., Voelk H. J., 1982, A&A, 116, 191
- McQuinn & Werk (2018) McQuinn M., Werk J. K., 2018, The Astrophysical Journal, 852, 33
- Miller & Bregman (2013) Miller M. J., Bregman J. N., 2013, The Astrophysical Journal, 770, 118
- Muratov et al. (2015) Muratov A. L., Kereš D., Faucher-Giguère C.-A., Hopkins P. F., Quataert E., Murray N., 2015, Monthly Notices of the Royal Astronomical Society, 454, 2691
- Muratov et al. (2017) Muratov A. L., et al., 2017, Monthly Notices of the Royal Astronomical Society, 468, 4170
- Oñorbe et al. (2014) Oñorbe J., Garrison-Kimmel S., Maller A. H., Bullock J. S., Rocha M., Hahn O., 2014, MNRAS, 437, 1894
- Oliphant (2007) Oliphant T. E., 2007, Computing in Science & Engineering, 9, 10
- Oppenheimer et al. (2016) Oppenheimer B. D., et al., 2016, Monthly Notices of the Royal Astronomical Society, 460, 2157
- Oppenheimer et al. (2017) Oppenheimer B. D., Segers M., Schaye J., Richings A. J., Crain R. A., 2017, Monthly Notices of the Royal Astronomical Society, 474, 4740
- Peeples et al. (2018) Peeples M. S., et al., 2018, arXiv preprint arXiv:1810.06566
- Planck Collaboration et al. (2013) Planck Collaboration et al., 2013, A&A, 557, A52
- Prochaska et al. (2017a) Prochaska J. X., et al., 2017a, pyigm/pyigm: Initial release for publications, doi:10.5281/zenodo.1045480, https://doi.org/10.5281/zenodo.1045480
- Prochaska et al. (2017b) Prochaska J. X., et al., 2017b, The Astrophysical Journal, 837, 169
- Ruszkowski et al. (2017) Ruszkowski M., Yang H.-Y. K., Zweibel E., 2017, The Astrophysical Journal, 834, 208
- Salem et al. (2016) Salem M., Bryan G. L., Corlies L., 2016, Monthly Notices of the Royal Astronomical Society, 456, 582
- Skilling (1971) Skilling J., 1971, ApJ, 170, 265
- Spitzer & Härm (1953) Spitzer L., Härm R., 1953, Phys. Rev., 89, 977
- Squire et al. (2017a) Squire J., Schekochihin A. A., Quataert E., 2017a, New Journal of Physics, 19, 055005
- Squire et al. (2017b) Squire J., Quataert E., Kunz M. W., 2017b, Journal of Plasma Physics, 83, 905830613
- Squire et al. (2017c) Squire J., Kunz M. W., Quataert E., Schekochihin A. A., 2017c, Physical Review Letters, 119, 155101
- Stern et al. (2016) Stern J., Hennawi J. F., Prochaska J. X., Werk J. K., 2016, The Astrophysical Journal, 830, 87
- Stern et al. (2018) Stern J., Faucher-Giguère C.-A., Hennawi J. F., Hafen Z., Johnson S. D., Fielding D., 2018, The Astrophysical Journal, 865, 91
- Stern et al. (2019) Stern J., Fielding D., Faucher-Giguère C.-A., Quataert E., 2019, arXiv preprint arXiv:1906.07737
- Stocke et al. (2013a) Stocke J. T., Keeney B. A., Danforth C. W., Shull J. M., Froning C. S., Green J. C., Penton S. V., Savage B. D., 2013a, ApJ, 763, 148
- Stocke et al. (2013b) Stocke J. T., Keeney B. A., Danforth C. W., Shull J. M., Froning C. S., Green J. C., Penton S. V., Savage B. D., 2013b, The Astrophysical Journal, 763, 148
- Su et al. (2017a) Su K.-Y., Hopkins P. F., Hayward C. C., Faucher-Giguère C.-A., Kereš D., Ma X., Robles V. H., 2017a, Monthly Notices of the Royal Astronomical Society, 471, 144
- Su et al. (2017b) Su K.-Y., Hayward C. C., Hopkins P. F., Quataert E., Faucher-Giguère C.-A., Kereš D., 2017b, Monthly Notices of the Royal Astronomical Society: Letters, 473, L111
- Su et al. (2018) Su K.-Y., et al., 2018, MNRAS, submitted, arXiv:1812.03997, p. arXiv:1812.03997
- Su et al. (2019) Su K.-Y., et al., 2019, Monthly Notices of the Royal Astronomical Society, 487, 4393
- Suzuki et al. (2014) Suzuki A., Takahashi H. R., Kudoh T., 2014, The Astrophysical Journal, 787, 169
- Thomas & Pfrommer (2019) Thomas T., Pfrommer C., 2019, Monthly Notices of the Royal Astronomical Society
- Tumlinson et al. (2011) Tumlinson J., et al., 2011, Science, 334, 948
- Tumlinson et al. (2017) Tumlinson J., Peeples M. S., Werk J. K., 2017, Annual Review of Astronomy and Astrophysics, 55, 389
- Turk et al. (2010) Turk M. J., Smith B. D., Oishi J. S., Skory S., Skillman S. W., Abel T., Norman M. L., 2010, The Astrophysical Journal Supplement Series, 192, 9
- Van Der Walt et al. (2011) Van Der Walt S., Colbert S. C., Varoquaux G., 2011, Computing in Science & Engineering, 13, 22
- Voit (2018) Voit G. M., 2018, arXiv preprint arXiv:1811.04976
- Wang et al. (2005) Wang Q. D., et al., 2005, The Astrophysical Journal, 635, 386
- Wentzel (1968) Wentzel D. G., 1968, ApJ, 152, 987
- Werk et al. (2013) Werk J. K., Prochaska J. X., Thom C., Tumlinson J., Tripp T. M., O’Meara J. M., Peeples M. S., 2013, The Astrophysical Journal Supplement Series, 204, 17
- Werk et al. (2014) Werk J. K., et al., 2014, The Astrophysical Journal, 792, 8
- Werk et al. (2016) Werk J. K., et al., 2016, The Astrophysical Journal, 833, 54
- White & Rees (1978) White S. D., Rees M. J., 1978, Monthly Notices of the Royal Astronomical Society, 183, 341
- Wiener et al. (2013) Wiener J., Peng Oh S., Zweibel E. G., 2013, Astrophysical Journal, 767
- Wiener et al. (2017) Wiener J., Oh S. P., Zweibel E. G., 2017, Monthly Notices of the Royal Astronomical Society, 467, 646
- Xu et al. (2016) Xu S., Yan H., Lazarian A., 2016, The Astrophysical Journal, 826, 166
- Yan & Lazarian (2008) Yan H., Lazarian A., 2008, ApJ, 673, 942
- Zahedy et al. (2019) Zahedy F. S., Chen H.-W., Johnson S. D., Pierce R. M., Rauch M., Huang Y.-H., Weiner B. J., Gauthier J.-R., 2019, Monthly Notices of the Royal Astronomical Society, 484, 2257
- Zhang (2018) Zhang D., 2018, Galaxies, 6, 114
- Zonca et al. (2019) Zonca A., Singer L., Lenz D., Reinecke M., Rosset C., Hivon E., Gorski K., 2019, Journal of Open Source Software, 4, 1298
- Zweibel (2013) Zweibel E. G., 2013, Physics of Plasmas, 20, 055501
- van de Voort et al. (2016) van de Voort F., Quataert E., Hopkins P. F., Faucher-Giguère C.-A., Feldmann R., Kereš D., Chan T., Hafen Z., 2016, Monthly Notices of the Royal Astronomical Society, 463, 4533
- van de Voort et al. (2018) van de Voort F., Springel V., Mandelker N., van den Bosch F. C., Pakmor R., 2018, Monthly Notices of the Royal Astronomical Society: Letters, 482, L85
Appendix A CGM Pressure Support in Additional MW-mass Systems
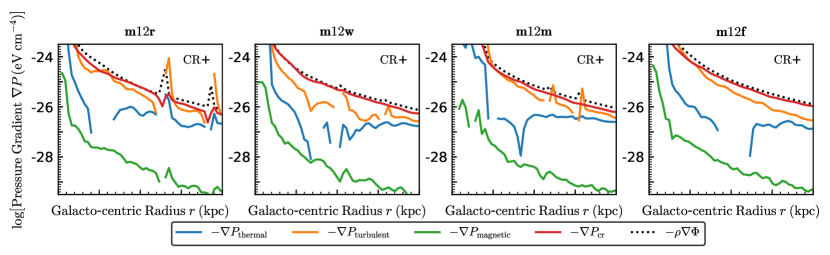
In the main text, we presented one halo (m12i) of mass similar to the Milky Way and showed that its CGM is dominated by CR pressure. Here we present a larger sample of MW-mass halos to demonstrate that results obtained for m12i regarding CR pressure are broadly generic at this mass scale. Figure 12 shows radial profiles of pressure gradients in additional MW-mass halos (m12r, m12w, m12m and m12f) from Hopkins et al. (2019). In all of these MW-mass systems, CR pressure gradients (red) are overall the largest pressure gradients in the CGM, and are comparable with gravitational force. I.e., the gaseous halos are consistent with being predominantly supported by CR pressure. In all cases, the thermal pressure gradients are substantially subdominant.
Appendix B Systematic Effects of the UV Background Model: HM12 versus FG09
In this appendix, we compare two UVB models discussed in the paper, HM12 and FG19, for O vi and Ne viii columns. As discussed in §3.5, these two models they differ in their treatment of the higher-energy EUV spectrum, which in turn leads to different predictions for the photo-ionization of mid/high ions. Fig. 13 presents O vi and Ne viii column densities produced assuming the HM12 or FG09 backgrounds, respectively, from both MHD+ and CR+ runs with various halo masses. In all cases, there is a systematic difference in the predictions for O vi and Ne viii depending on the UVB spectrum we assume: FG09 generally produces shallower profiles for mid/high ions, compared to HM12.
In dwarfs there is no systematic difference between MHD+ and CR+ runs, for either HM12 or FG09 backgrounds: in other words our statement from the text that the effects of CRs in low-mass halos is negligible is robust. In more massive halos, the qualitative effects of CRs are similar independent of UVB, but we see the difference between the two UVB models in the CR+ runs is more pronounced than in the MHD+ runs (as we showed above, the CR+ runs are more strongly dominated by photo-ionization). For example, the O vi column densities in the m12i MHD+ run generally agree between HM12 and FG09 because they are collisionally-dominated, but in the CR+ run HM12 predicts a factor larger inner-halo O vi columns compared to FG09.

In Fig. 14, we focus on the difference between HM12 and FG09 in ionizing O vi and Ne viii in the m12i CR+ runs via density-temperature diagrams. The contribution to O vi and Ne viii coming from gas with and a few (where the majority of CGM gas in this run lies; see Fig. 7) is reduced by a factor in the FG09 UVB model relative to HM12. This is, as we emphasized in the text, also similar to the density and temperature range where photo-ionization is most efficient. Thus, if the mid/high CGM ions are primarily photo-ionized, care is needed in the treatment of the high-energy component of the UVB. The more recent UVB model of Faucher-Giguère (2020), which includes a more detailed treatment of AGN than FG09, produces a high-energy spectrum in good agreement with HM12. We therefore favor the HM12 predictions for ions sensitive to photons of energy 4 Ry.