Fact-Checking Meets Fauxtography: Verifying Claims About Images
Abstract
The recent explosion of false claims in social media and on the Web in general has given rise to a lot of manual fact-checking initiatives. Unfortunately, the number of claims that need to be fact-checked is several orders of magnitude larger than what humans can handle manually. Thus, there has been a lot of research aiming at automating the process. Interestingly, previous work has largely ignored the growing number of claims about images. This is despite the fact that visual imagery is more influential than text and naturally appears alongside fake news. Here we aim at bridging this gap. In particular, we create a new dataset for this problem, and we explore a variety of features modeling the claim, the image, and the relationship between the claim and the image. The evaluation results show sizable improvements over the baseline. We release our dataset, hoping to enable further research on fact-checking claims about images.
1 Introduction
As social media become a bigger part of our daily lives, their influence over the way people think and make decisions increases. Inevitably, this has offered opportunities for fake content to arise and to spread faster than ever, e.g., recent research has shown that fake news spreads six time faster than real news Vosoughi et al. (2018). Sometimes such content is created for pure entertainment or for financial gain from advertisement shown alongside the fake content, but more often and especially recently it has been used to spread disinformation, e.g., with the aim to influence political elections Atanasov et al. (2019). To deal with the problem, a number of manual fact-checking initiatives have been launched, but they remain insufficient to cope with the ever growing number of check-worthy claims. Thus, automated methods have been proposed as a more scalable solution.
Recently, a growing number of claims have been about images. The word Fauxtography has been used to describe images, especially news photographs, that convey a questionable, or outright false, sense of the events they seem to depict. The term was coined over a decade ago Cooper (2007), and there is growing research interest in the topic in the Computer Vision community Bayar and Stamm (2016); de Carvalho et al. (2016). Given the recent proliferation of fake news, and given that many of the questionable claims are about images, it would be natural to expect similar interest in the Computational Linguistics community, especially given the fact that visual imagery is more influential than text and naturally appears alongside fake news. Yet, computational fact-checking has mostly ignored the growing number of claims about images. Here we aim at bridging this gap. In particular, we create a new dataset for this problem, and we explore a variety of features modeling the claim, the image, and the relationship between the claim and the image.
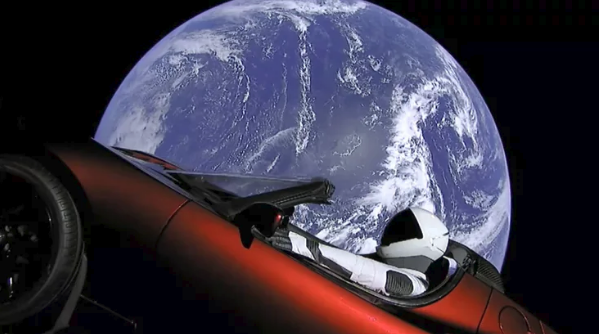
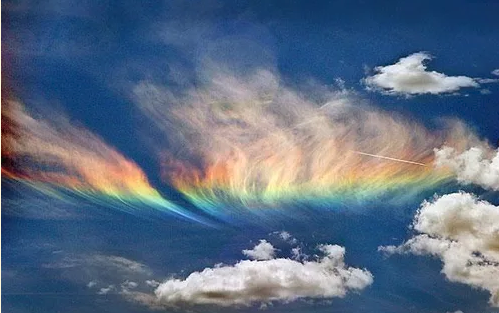
Let us look at some examples. Figure 1 shows two images that look surrealistic, and thus spark interest and raise natural suspicion. Yet, they are in fact real.111http://www.snopes.com/fact-check/tesla-car-really-space,222http://www.snopes.com/fact-check/fire-rainbow
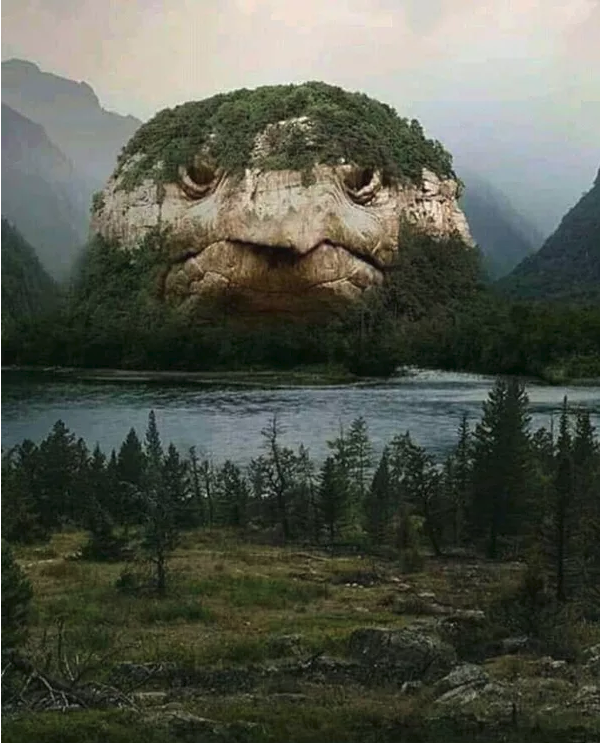
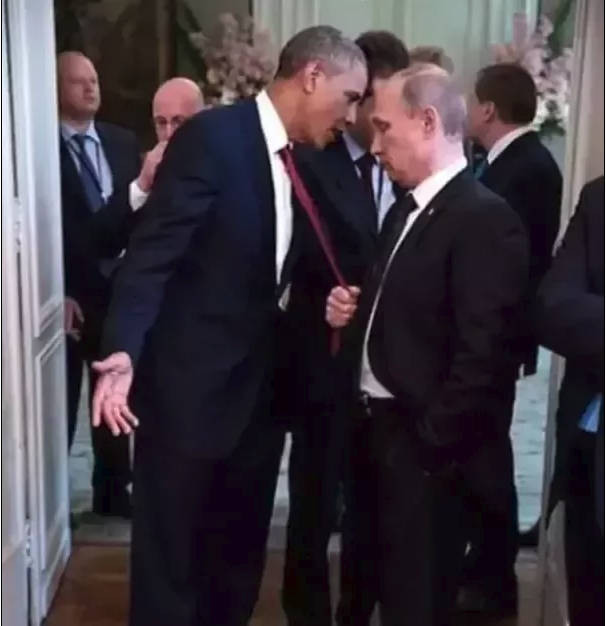
Figure 2 contains fake images accompanied by false claims. On the left, in Figure 2(a), we see an image from a Facebook page that claims to show a turtle mountain. It turns out that this is not a genuine photograph of a real-world location, but a digital artwork comprising altered versions of at least two different photographs.333http://www.snopes.com/fact-check/turtle-mountain-photo/ On the right, Figure 2(b) displays an image purportedly showing Putin aggressively grabbing President Obama by the tie and pulling him close. This image has been digitally manipulated.444http://www.snopes.com/fact-check/putin-obama-tie-pull/
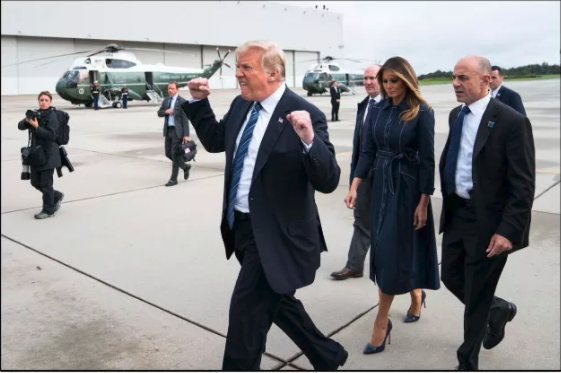
Finally, Figure 3 shows original photographs with false claims about them. The image in Figure 3(a) shows Trump with his fists in the air, but his gesture is not a greeting to a cancer victim as the claim states. The real image was used as a part of a meme555http://www.snopes.com/fact-check/trump-fistpump-cancer-greeting/ that was designed to make it seem that way. The photo in Figure 3(a) was posted by a Twitter account in an attempt to go viral, claiming that it shows a real bunny sitting in the palm of someone’s hand. It actually shows a plush doll.666http://www.snopes.com/fact-check/bunny-toy-photograph/
As we have seen above, there are a number of reasons why an image may be deemed fake. In most cases, this involves some kind of digital manipulation, e.g., cropping, splicing, etc. However, there are cases when an image is completely legitimate, but it is published alongside some text that does not reflect its content accurately. This is our main focus here: we study the factuality of image-claim pairs.

The contributions of this paper can be summarized as follows:
-
•
We study a new problem: predict the factuality of a claim with respect to an image.
-
•
We create a new dataset for this problem, which we release to the research community in order to enable further work.
-
•
We explore a variety of features, and we demonstrate sizable improvements over the baseline.
The remainder of this paper is organized as follows: Section 2 presents some relevant related work. Section 3 describes in depth our method and the various features we experimented with. Section 4 gives details about the datasets we created and used. Section 5 describes our experimental setup and presents the evaluation results. Section 6 gives additional details about the performance of the individual features, both in isolation and in various combinations, and further describes some unsuccessful attempts at extracting better features. Finally, Section 7 presents our conclusions and some ideas for future work.
2 Related Work
2.1 Fact-checking Claims
There has been a lot of research in the last few years in automatic fact-checking of claims and rumors, which can be classified into two general categories. The first approach focuses on the social aspects of the claim and how users in social media react to it Canini et al. (2011); Castillo et al. (2011); Ma et al. (2016); Zubiaga et al. (2016); Ma et al. (2017); Dungs et al. (2018). This is reflected by user comments, likes/dislikes, views and other types of reactions, which are collected and used as features.
Other methods use the Web and try to find information that proves or disproves the claim Mukherjee and Weikum (2015); Popat et al. (2017); Karadzhov et al. (2017); Mihaylova et al. (2018); Baly et al. (2018b). In either case, what is important is the stance Riedel et al. (2017); Thorne et al. (2017); Hanselowski et al. (2018); Mohtarami et al. (2018, 2019): whether the opinion expressed in a tweet or in an article by a particular user/source agrees/disagrees with the claim, and the reliability of the source, i.e., can we trust this source Baly et al. (2018a, 2019).
We should note that all these approaches are limited to textual claims, while we are interested in claims about images.
2.2 Detecting Fake/Manipulated Images
The task of detecting fabricated images falls under the area of image forensics. Such tasks are usually solved using traditional statistical methods modeling color, shape, and texture features Bayram et al. (2006); Stamm and Liu (2010); de Carvalho et al. (2016). More recently, with the rise of Deep Learning, modern approaches and architectures have been applied to tackle the problem Bayar and Stamm (2016). However, most existing work uses datasets with generic images and very few papers specialize in the area of news and social media Jin et al. (2016). Detecting manipulation in the images is relevant for us, but is not enough, since often the image is original, but the claim about it is false.
2.3 Fact-Checking Claims about Images
Little research exists on the topic of fact-checking claims about images, where the input to be analyzed is an image-claim pair. To the best of our knowledge, there is only one work closely related to ours: a recent paper Zhang et al. (2018) presents a system called FauxBuster which aims to fight against Fauxtography. We differ from them in that we use the Web as a source of information. In contrast, they focus on the social aspects of the problem and use comments on Twitter and Reddit to extract features, which makes our work complementary to theirs. Unfortunately, direct comparison to their approach is not feasible, as their dataset is not freely accessible.
3 Method
This section describes the different approaches we applied towards engineering and extracting features from the image-claim pair.
We start with reverse image search. The classical image search allows users to search for images based on a text with specific words or phrases. In contrast, reverse image search takes as input an image and returns Web pages that include this exact image or images that are very similar to it. This process can be easily automated and applied to a large number of images via Google’s Vision API.777http://cloud.google.com/vision/ It can also return other information related to the image, e.g., tags, the text on the image, some object detection, explicit content, etc.
Using reverse image search, for each image we obtain a maximum of 50 Web pages that contain it. We remove pages that are known to be from fact-checking Web sites such as snopes.com, factcheck.org, using open-source code.888github.com/clef2018-factchecking For the remaining Web pages, we crawl the article and we get its title and text.
3.1 Features about the Image
Google tags: This is a list of tags that Google associates with the image. We decided to use this list because it contains words and phrases about events and people related to the image, which might give us an insight about what the image contains and what it is about. For example, the image in Figure 1(a) has the following tags: SpaceX, Falcon Heavy, Rocket, Rocket launch, Falcon, Company, Launch pad, Booster, Thrust, Entrepreneur, Elon Musk. After lowercasing them and removing stop words, we use them directly as bag-of-words features.
URL domains: The Web pages that contain the image usually come from media sources and represent articles on a topic related to the image and/or the claim attached to it. However, in some cases they might point to an image-hosting service or a social network Web site such as Pinterest, Imgur, Twitter, etc. In an effort to use this fact, we extracted the top-level domain names from the list of URLs and we used them as TF.IDF features.
URL categories: In order to get more insight about what types of websites write about fake and genuine images, we classify them in several predefined URL categories.
We use open-source code999http://github.com/matthewruttley/mozclassify to classify URLs, which performs rule-based matching of tokens from the URL against a predefined list of words. Given a URL, it assigns it a tuple of one higher-level and one lower-level category. For example, when we run the algorithm on the Web sites returned for the image in Figure 1(a) we get category tuples such as: (‘arts & entertainment’, ‘general’), (‘sports’, ‘general’), (‘society’, ‘general’), (‘technology & computing’, ‘general’), (‘science’, ‘general’), (‘automotive’, ‘general’) and (‘business’, ‘marketing’). To transform those into features, we take all Web sites returned by the reverse image search for the image, and we merge the lists of their category tuples. We do not differentiate between high- and low-level categories; rather, we just apply TF.IDF on the combined list.
True/False/Mixed media percentage: In order to determine whether an image is fake or not, we can also check the reliability of the sources that wrote about it. Media Bias/Fact Check101010http://mediabiasfactcheck.com/ (MBFC) is a Web site that provides factuality information about 2700+ media sources. We use their database to classify each Web page that is returned by the reverse image search into the following categories: True (high factuality), False (low factuality) and Mixed (mixed factuality). Then, we use the percentage of Web pages from each category returned by the reverse image search as a feature.
Known media percentage: If a URL is not on the MBFC list, we label it as Unknown and we use the percentage of known Web pages as a feature.
True/False/Mixed media titles: We use the titles of the articles from a True, False or Mixed media as bag-of-words features.
3.2 Features about the Claim
So far, in our feature extraction process we have only used the image from the image-claim pair, which means we might be missing crucial information. After manual inspection of a few examples, we realized that about half of them can be classified only using the image, e.g., because it is a collage, was photoshopped, or manipulated in some way. The other half contain legitimate images that might appear on trustworthy Web sites, but the claim associated with them was false.
Claim text: We transform the text of the claim into a TF.IDF vector, which we use as a feature.
3.3 Features about the Image-Claim pair
In addition to using the claim text, we want to check how it is related to the image and whether the claim is true with respect to it. We model that by comparing the text of the claim to the articles returned by the Reverse Image Search of the image. We use only the articles from trustworthy media sources, according to our MBFC labels. We approach the task of computing the similarity of those texts in two different ways.
Cosine similarity: We perform the comparison on the TF.IDF representations of the claim and each article’s title. We compute a smoothed average on the list of cosine similarities to get the final feature value.
Embedding similarity: We use pretrained embeddings of size 512 Cer et al. (2018) as a way to vectorize the claim and the title sentences. Then, it is trivial to calculate the similarity as a dot product, as they are already in a normalized form. Again, we use a smoothed average to reduce the list of similarities to a single number.
4 Data
As we have a new task, we needed to create our own dataset. In fact, we created two datasets from two separate sources, but with similar qualities and format. The main idea behind the data collection process was to find viral, interesting and even contradictory images with some text that describes them, i.e., the claim. Both datasets are in English.
4.1 The Snopes Dataset
Snopes.com is arguably the oldest and the largest fact-checking Web site online. It aims to fight misinformation by investigating different pieces of news. The site has a special section for image-related fact-checking, called Fauxtography111111http://www.snopes.com/fact-check/category/photos. It uses an extensive list of labels to classify each piece of news as True, False, Miscaptioned, Mixture, Undetermined, Unproven, Outdated, etc. For the purpose of our dataset, we gather only image-claim pairs that were labeled as either True or False. The collected data consists of 838 examples of which 197 True and 641 False. The huge imbalance of the classes might be surprising at first, but it makes sense for fact-checkers to prefer to spend their time fact-checking news pieces that have a higher chance of being fake.
Yet, this lack of True-labeled examples can pose some challenges for classification models and the evaluation process as well. This is why we decided to invest some time in gathering more True examples as we explain below.
4.2 The Reuters Dataset
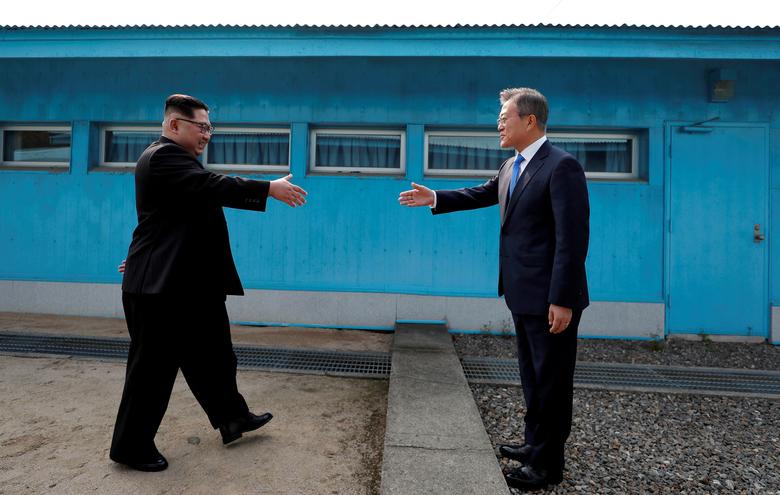
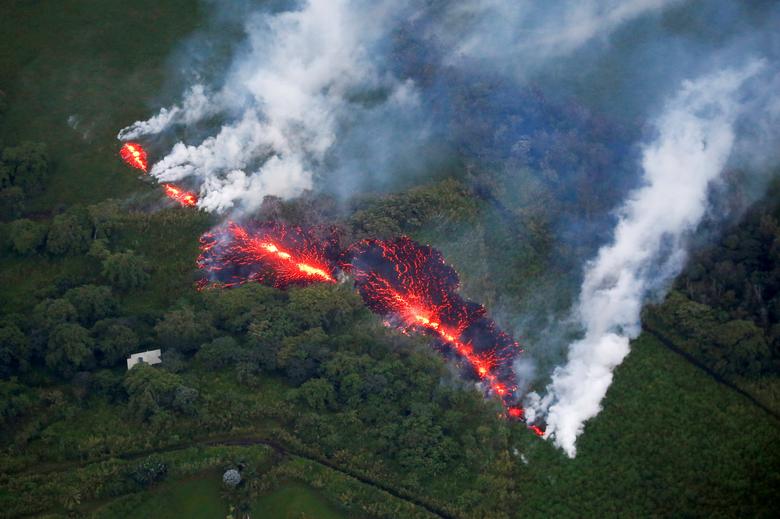
At the end of each year, Reuters publishes a list of about 100 photos, called Pictures of the Year. Conveniently for us, each photo comes with a short textual description, which we can use as a claim. We collected all of these pictures from four consecutive years: 2015, 2016, 2017, and 2018. As a result, we ended up with a total of 395 True image-claim pairs. Some examples are shown in Figure 4. We further performed close manual inspection, and we did not find any obvious differences between these images compared to the ones from The Snopes Dataset. In terms of the claim, texts from Reuters seem to be longer, but this should not be a problem, since we do not use the length as a feature.
5 Experiments and Evaluation
5.1 Setup
Note that the above two datasets contain 1,233 examples combined, and these examples are relatively well-balanced: 592 True and 641 False. As this is a small size, we chose to test the performance of the models using cross-validation. If we mix the data from the two sources having in mind that the Reuters dataset has examples from the True class only, we fear that the models might implicitly learn each example’s source, not its factuality. Hence, we designed the following two cross-validation experiments:
Testing on Snopes-only data.
Ten times, using a different random seed, we do the following:
-
1.
Randomly choose 50 True and 50 False Snopes examples and use them as a test set.
-
2.
Use the rest of the True Snopes data plus all Reuters data as True training examples.
-
3.
Randomly sample the necessary number of examples from the False Snopes data, so that the training set is balanced.
Finally, we compute the average of the evaluation measures for all ten folds.
Testing on Snopes + Reuters data.
Ten times, using a different random seed, we perform the following steps:
-
1.
Combine all Snopes and Reuters data into a single dataset.
-
2.
Balance the resulting dataset by randomly choosing the necessary number of False examples.
-
3.
Do a random train-test split, so that the test set contains 100 examples.
As in the previous experiment, we compute the average of the evaluation measures for all ten folds.
5.2 Classification model
We used a Linear SVM with the default value of =1. We trained a separate SVM model for each feature type, then we applied a softmax to normalize the values, and finally we averaged the confidences of the classifiers to make the final decision.
5.3 Results
We used the following evaluation measures:
-
•
Accuracy, because the classes are balanced, and the majority-class baseline for all experiments is 50.0.
-
•
Average Precision, since it is useful if we want to have a ranking task, e.g., to prioritize which claims about images human fact-checkers should check first. Again, the random baseline for all experiments is 50.0.
| Feature | Acc (S) | AP (S) | Acc (S+R) | AP (S+R) |
|---|---|---|---|---|
| All | 63.2 | 73.0 | 80.1 | 90.3 |
| True media percentage | 62.1 | 59.3 | 74.6 | 69.8 |
| Embedding similarity of claim & true media titles | 61.1 | 62.5 | 74.0 | 69.0 |
| Cosine similarity of claim & true media titles | 61.1 | 58.4 | 73.8 | 69.0 |
| Known media percentage | 60.4 | 58.6 | 74.6 | 71.9 |
| URL domains | 60.3 | 67.3 | 78.6 | 89.7 |
| Google tags | 58.5 | 63.9 | 71.5 | 82.1 |
| Mixed media percentage | 58.0 | 56.1 | 62.4 | 60.8 |
| Claim text | 57.1 | 60.8 | 74.9 | 83.8 |
| True media titles | 55.8 | 63.1 | 73.6 | 81.4 |
| Mixed media titles | 55.4 | 58.5 | 63.1 | 67.2 |
| URL categories | 53.7 | 56.0 | 70.3 | 76.2 |
| False media titles | 50.3 | 50.8 | 50.6 | 50.4 |
| False media percentage | 49.9 | 51.1 | 50.4 | 50.4 |
| Baseline | 50.0 | 50.0 | 50.0 | 50.0 |
Table 1 illustrates the importance of each feature type in isolation. We can see that almost all individual feature types manage to outperform the two 50% baselines. The only weak features are those related to false sources of information: percentage of unreliable media writing about the image and the words used in the titles of the articles. Moreover, using all features (with a model combination as explained above) works best: 63.2% and 80.1% Accuracy, 73.0% and 90.3% Average Precision for S and S+R, respectively. The top-3 feature types for the Snopes test set are true media percentage (62.1% for S and 74.6% for S+R), embedding similarity (61.1% for S and 74.0% for S+R), and cosine similarity (61.1% for S and 73.8% for S+R). In either experiment, Average Precision is higher than Accuracy. Larger improvements are achieved for the Snopes + Reuters test set, which could be due to the model making more mistakes on the True examples from Snopes and being better on True examples from Reuters.
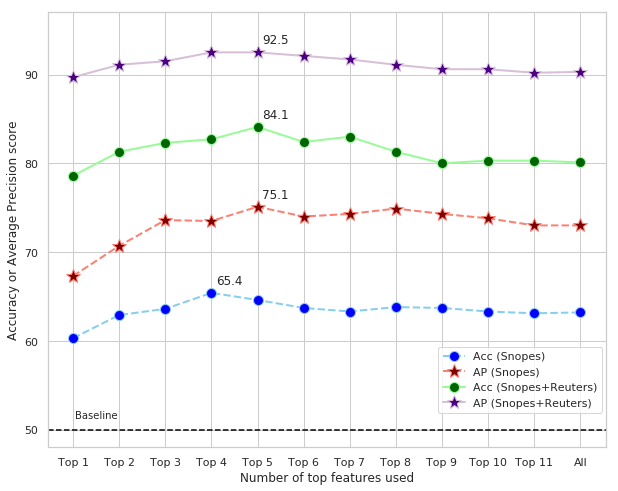
Figure 5 shows combinations of the top- features using each feature’s performance in terms of Average Precision. Note that these top features for the two experiments are different: we use the scores in the AP(S) column in Table 1 for the Snopes dataset, and the AP(S+R) column for the Snopes+Reuters dataset. We can see that selecting the top 4 to 5 features works best, yielding 65.4%, 75.1%, 84.1% and 92.5%.
Note that the Average Precision scores are higher than those for Accuracy, and the scores for the Snopes+Reuters dataset are higher.
6 Discussion
6.1 Most Important Individual Features
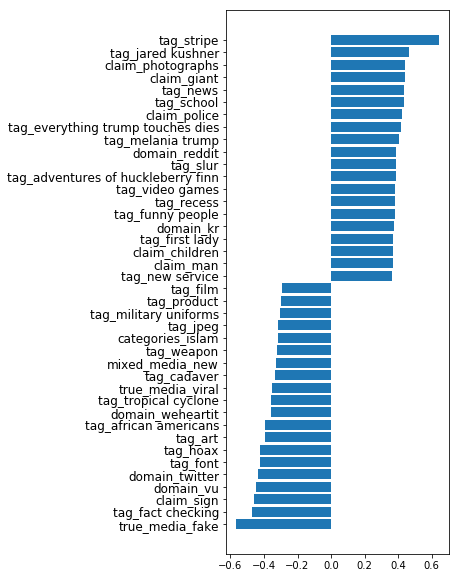
Above, we explored the performance of individual feature groups. Here we try to understand what the most important individual features are. For this purpose, we trained a model on all features, and then we analyzed the weight of each feature in this full model. Note that this is different from the setup in the previous section, where we trained a separate model for each feature group, and then we combined the predictions of these models in an ensemble; in contrast, here we just put all features from all groups together. The results are visualized in Figure 6. We can see that some of them seem random, e.g., adventures of huckleberry fin or everything trump touches dies. However, there are a few that signal false information, e.g., words like fake and viral mentioned in the title of a trustworthy medium, or tags like hoax and fact-checking. The existence of images in the dataset that were modified for artistic purposes can explain tags such as art and film. Also, according to our best features, we should not trust much images that appear on Twitter or ones related to sensitive topics like african americans or islam.
6.2 What Did Not Work
Metadata from images: In an attempt to capture possible manipulation of the input image, we gathered meta information using an open-source tool121212http://github.com/redaelli/imago-forensics for image forensics. The tool extracts metadata in the form of about 100 features such as size, resolution, GPS location. However, most of this metadata turns out to be missing from our images: only five features could be extracted for more than half of the images from the Snopes dataset.
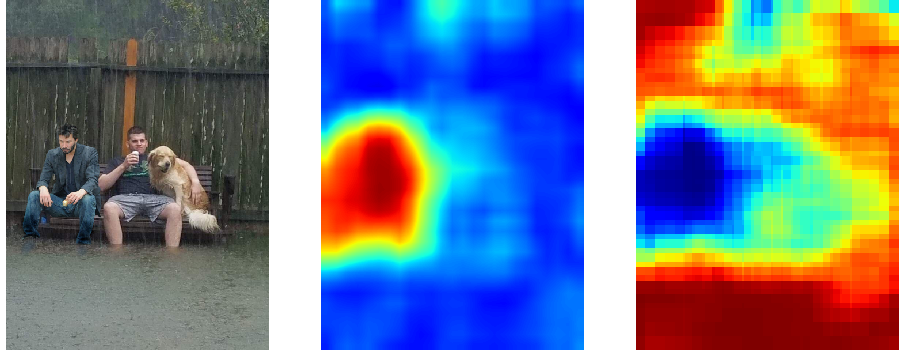
Image Splice Detection: As we have already mentioned, one of the reasons why an image could be fake is that it has been digitally manipulated. A common manipulation is splicing, i.e., cropping and stitching together parts of the same image or multiple different images. We explored an approach that looks for the lack of self-consistency in images and outputs clusters of the predicted image parts using two algorithms: MeanShift and DBSCAN Huh et al. (2018). An illustration on how it works is shown in Figure 7. We decided to validate the method by using a pretrained model,131313http://github.com/minyoungg/selfconsistency which we applied to some images from the Snopes dataset that were obvious cases of splicing.
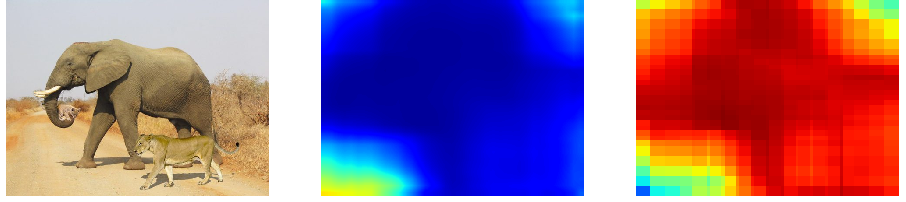
Unfortunately, this seemed not to work for us. Figure 8 shows an example where the model could not find the spliced regions. Eventually, we abandoned this direction as the inference time and the required resources were significant, and the performance was not very good on our dataset.
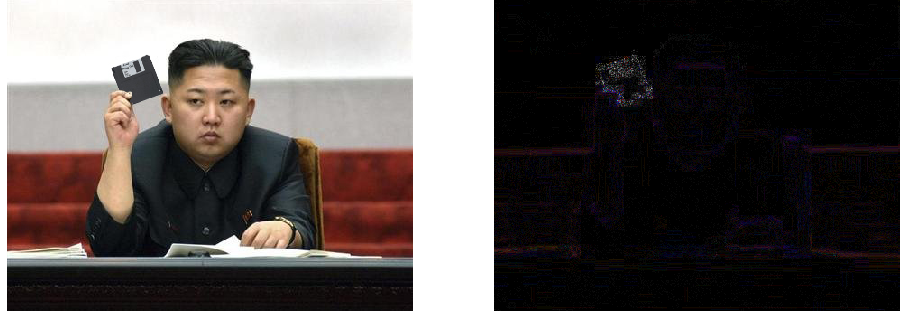
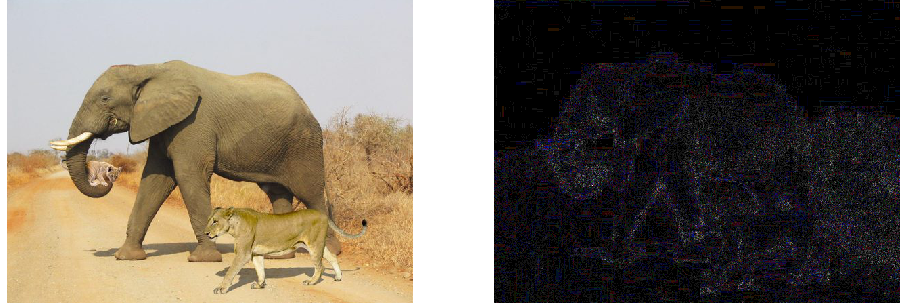
Error Level Analysis: Error Level Analysis (ELA) helps to identify areas within an image that are at different compression levels. With JPEG images such as the ones in our Snopes and Reuters datasets, the entire image should be at roughly the same level. If a section of the image is at a significantly different error level, this would indicate a likely digital modification.
ELA works by intentionally resaving the image at a known error rate such as 95%, and then computing the difference between the images. If there is virtually no change, then the cell has reached its local minima for error at that quality level. However, if there is a large change, then the pixels are not at their local minima and are effectively original. This method can be used to identify splicing, because stitched regions will appear brighter on the ELA version of the image. This is illustrated in Figure 9. After manual inspection of ELA versions of images from our dataset, we did not find the method to be very promising, see Figure 10.
6.3 Testing on New Data
All of the experiments described so far were performed on claim-image pairs from Snopes that were published in the period between November 20, 2000 and February 1, 2019. The data from February up until April 29, 2019 has been left untouched, which makes it suitable for performing one final test of the developed system. In these three months, 64 articles were published in the Fauxtography section, of which 14 were labeled as True and 25 as False. To balance this new test set, we subsampled 14 False examples randomly. The training was performed on all previously collected data from Snopes and Reuters, balanced in the same way. For better certainty of the performance, we sampled randomly the training and the test sets ten times, and we report the average scores.
The results when using the top features based on the Average Precision for the Snopes dataset are shown in Table 2. We can see that the best Average Precision is achieved by using the single top feature of URL domains: 71.7%. When we add to this the second best one, i.e., the Google tags, we get an Accuracy of 64.3%. The scores of the models that use more than three features are not displayed since they were not as good.
The best-performing features across the experiments differ, but as Table 1 shows, the URL domains are top-1 in three out of four experiments, and claim text is top-2 in two out of four experiments.
| Features | Acc | AP |
|---|---|---|
| All | 59.3 | 69.7 |
| Top 1 | 62.9 | 71.7 |
| Top 2 | 64.3 | 70.4 |
| Top 3 | 57.5 | 70.6 |
| Baseline | 50.0 | 50.0 |
7 Conclusion and Future Work
We have presented our efforts towards fighting Fauxtography, namely detecting fake claims about images, which is an under-explored research direction. In particular, we created a new dataset for this problem, and we explored a variety of features modeling the claim, the image, and the relationship between the two. The evaluation results have shown sizable improvements over the baseline. We release our dataset,141414http://gitlab.com/didizlatkova/fake-image-detection hoping to enable further research on fact-checking claims about images.
In future work, we plan to extend the dataset with more examples, to try other features, e.g., from social media and from metadata,151515The lack of metadata that we observed can be explained by the fact that Snopes.com is not the original source of the image files; it collected images from various external sources. Those sources might not be the original creator either and multiple downloading and uploading of files, with possible reformatting could mean loss of metadata as many Web sites reformat images and/or delete/change the metadata of the images uploaded to it. Finally, we could not extract any EXIF metadata for the Reuters images, even though we got them from Reuters. Yet, maybe the metadata can be recovered using Reverse Image Search. and to adapt the system to work with other languages. We further plan experiments with fact-checking claims about videos.
Acknowledgements
This research is part of the Tanbih project,161616http://tanbih.qcri.org/ which aims to limit the effect of “fake news”, propaganda and media bias by making users aware of what they are reading. The project is developed in collaboration between the Qatar Computing Research Institute (QCRI), HBKU and the MIT Computer Science and Artificial Intelligence Laboratory (CSAIL).
References
- Atanasov et al. (2019) Atanas Atanasov, Gianmarco De Francisci Morales, and Preslav Nakov. 2019. Understanding the roles of political trolls in social media. In Proceedings of the 2019 SIGNLL Conference on Computational Natural Language Learning, CoNLL ’19, Hong Kong, China.
- Baly et al. (2018a) Ramy Baly, Georgi Karadzhov, Dimitar Alexandrov, James Glass, and Preslav Nakov. 2018a. Predicting factuality of reporting and bias of news media sources. In Proceedings of the Conference on Empirical Methods in Natural Language Processing, EMNLP ’18, pages 3528–3539, Brussels, Belgium.
- Baly et al. (2019) Ramy Baly, Georgi Karadzhov, Abdelrhman Saleh, James Glass, and Preslav Nakov. 2019. Multi-task ordinal regression for jointly predicting the trustworthiness and the leading political ideology of news media. In Proceedings of the 17th Annual Conference of the North American Chapter of the Association for Computational Linguistics: Human Language Technologies, NAACL-HLT ’19, pages 2109–2116, Minneapolis, MN, USA.
- Baly et al. (2018b) Ramy Baly, Mitra Mohtarami, James Glass, Lluís Màrquez, Alessandro Moschitti, and Preslav Nakov. 2018b. Integrating stance detection and fact checking in a unified corpus. In Proceedings of the 2018 Conference of the North American Chapter of the Association for Computational Linguistics: Human Language Technologies, NAACL-HLT ’18, pages 21–27, New Orleans, LA, USA.
- Bayar and Stamm (2016) Belhassen Bayar and Matthew C. Stamm. 2016. A deep learning approach to universal image manipulation detection using a new convolutional layer. In Proceedings of the 4th ACM Workshop on Information Hiding and Multimedia Security, IH&MMSec ’16, pages 5–10, Vigo, Spain.
- Bayram et al. (2006) Sevinç Bayram, Ismail Avcibas, Bülent Sankur, and Nasir D Memon. 2006. Image manipulation detection. Journal of Electronic Imaging, 15(4):041102.
- Canini et al. (2011) Kevin R. Canini, Bongwon Suh, and Peter L. Pirolli. 2011. Finding credible information sources in social networks based on content and social structure. In Proceedings of the IEEE International Conference on Privacy, Security, Risk, and Trust, and the IEEE International Conference on Social Computing, SocialCom/PASSAT ’11, pages 1–8, Boston, MA, USA.
- de Carvalho et al. (2016) Tiago Jose de Carvalho, Fábio Augusto Faria, Hélio Pedrini, Ricardo da Silva Torres, and Anderson Rocha. 2016. Illuminant-based transformed spaces for image forensics. IEEE Transactions on Information Forensics and Security, 11:720–733.
- Castillo et al. (2011) Carlos Castillo, Marcelo Mendoza, and Barbara Poblete. 2011. Information credibility on Twitter. In Proceedings of the 20th International Conference on World Wide Web, WWW ’11, pages 675–684, Hyderabad, India.
- Cer et al. (2018) Daniel Cer, Yinfei Yang, Sheng-yi Kong, Nan Hua, Nicole Limtiaco, Rhomni St. John, Noah Constant, Mario Guajardo-Cespedes, Steve Yuan, Chris Tar, Brian Strope, and Ray Kurzweil. 2018. Universal sentence encoder for English. In Proceedings of the 2018 Conference on Empirical Methods in Natural Language Processing, EMNLP ’18, pages 169–174, Brussels, Belgium.
- Cooper (2007) Stephen Cooper. 2007. A concise history of the fauxtography blogstorm in the 2006 Lebanon war. American Communication Journal, 9.
- Dungs et al. (2018) Sebastian Dungs, Ahmet Aker, Norbert Fuhr, and Kalina Bontcheva. 2018. Can rumour stance alone predict veracity? In Proceedings of the 27th International Conference on Computational Linguistics, COLING ’18, pages 3360–3370, Santa Fe, NM, USA.
- Hanselowski et al. (2018) Andreas Hanselowski, Avinesh PVS, Benjamin Schiller, Felix Caspelherr, Debanjan Chaudhuri, Christian M. Meyer, and Iryna Gurevych. 2018. A retrospective analysis of the fake news challenge stance-detection task. In Proceedings of the 27th International Conference on Computational Linguistics, COLING ’18, pages 1859–1874, Santa Fe, NM, USA.
- Huh et al. (2018) Minyoung Huh, Andrew Liu, Andrew Owens, and Alexei A. Efros. 2018. Fighting fake news: Image splice detection via learned self-consistency. In Computer Vision – ECCV 2018, pages 106–124, Cham. Springer International Publishing.
- Jin et al. (2016) Zhiwei Jin, Juan Cao, Yongdong Zhang, Jianshe Zhou, and Qi Tian. 2016. Novel visual and statistical image features for microblogs news verification. IEEE Transactions on Multimedia, PP:1–1.
- Karadzhov et al. (2017) Georgi Karadzhov, Preslav Nakov, Lluís Màrquez, Alberto Barrón-Cedeño, and Ivan Koychev. 2017. Fully automated fact checking using external sources. In Proceedings of the Conference on Recent Advances in Natural Language Processing, RANLP ’17, pages 344–353, Varna, Bulgaria.
- Ma et al. (2016) Jing Ma, Wei Gao, Prasenjit Mitra, Sejeong Kwon, Bernard J. Jansen, Kam-Fai Wong, and Meeyoung Cha. 2016. Detecting rumors from microblogs with recurrent neural networks. In Proceedings of the 25th International Joint Conference on Artificial Intelligence, IJCAI ’16, pages 3818–3824, New York, NY, USA.
- Ma et al. (2017) Jing Ma, Wei Gao, and Kam-Fai Wong. 2017. Detect rumors in microblog posts using propagation structure via kernel learning. In Proceedings of the 55th Annual Meeting of the Association for Computational Linguistics, ACL ’17, pages 708–717, Vancouver, Canada.
- Mihaylova et al. (2018) Tsvetomila Mihaylova, Preslav Nakov, Lluís Màrquez, Alberto Barrón-Cedeño, Mitra Mohtarami, Georgi Karadjov, and James Glass. 2018. Fact checking in community forums. In Proceedings of the Thirty-Second AAAI Conference on Artificial Intelligence, AAAI ’18, pages 879–886, New Orleans, LA, USA.
- Mohtarami et al. (2018) Mitra Mohtarami, Ramy Baly, James Glass, Preslav Nakov, Lluís Màrquez, and Alessandro Moschitti. 2018. Automatic stance detection using end-to-end memory networks. In Proceedings of the 16th Annual Conference of the North American Chapter of the Association for Computational Linguistics: Human Language Technologies, NAACL-HLT ’18, pages 767–776, New Orleans, Louisiana, USA.
- Mohtarami et al. (2019) Mitra Mohtarami, James Glass, and Preslav Nakov. 2019. Contrastive language adaptation for cross-lingual stance detection. In Proceedings of the 2019 Conference on Empirical Methods in Natural Language Processing, EMNLP ’19, Hong Kong, China.
- Mukherjee and Weikum (2015) Subhabrata Mukherjee and Gerhard Weikum. 2015. Leveraging joint interactions for credibility analysis in news communities. In Proceedings of the 24th ACM International on Conference on Information and Knowledge Management, CIKM ’15, pages 353–362, Melbourne, Australia.
- Popat et al. (2017) Kashyap Popat, Subhabrata Mukherjee, Jannik Strötgen, and Gerhard Weikum. 2017. Where the truth lies: Explaining the credibility of emerging claims on the Web and social media. In Proceedings of the 26th International Conference on World Wide Web Companion, WWW ’17, pages 1003–1012, Perth, Australia.
- Riedel et al. (2017) Benjamin Riedel, Isabelle Augenstein, Georgios P Spithourakis, and Sebastian Riedel. 2017. A simple but tough-to-beat baseline for the Fake News Challenge stance detection task. ArXiv:1707.03264.
- Stamm and Liu (2010) Matthew C Stamm and KJ Ray Liu. 2010. Forensic detection of image manipulation using statistical intrinsic fingerprints. IEEE Transactions on Information Forensics and Security, 5(3):492–506.
- Thorne et al. (2017) James Thorne, Mingjie Chen, Giorgos Myrianthous, Jiashu Pu, Xiaoxuan Wang, and Andreas Vlachos. 2017. Fake news stance detection using stacked ensemble of classifiers. In Proceedings of the EMNLP Workshop on Natural Language Processing meets Journalism, pages 80–83, Copenhagen, Denmark.
- Vosoughi et al. (2018) Soroush Vosoughi, Deb Roy, and Sinan Aral. 2018. The spread of true and false news online. 359(6380):1146–1151.
- Zhang et al. (2018) Daniel Yue Zhang, Lanyu Shang, Biao Geng, Shuyue Lai, Ke Li, Hongmin Zhu, Md Tanvir Amin, and Dong Wang. 2018. Fauxbuster: A content-free fauxtography detector using social media comments. In 2018 IEEE International Conference on Big Data, BigData ’18, pages 891–900. IEEE.
- Zubiaga et al. (2016) Arkaitz Zubiaga, Maria Liakata, Rob Procter, Geraldine Wong Sak Hoi, and Peter Tolmie. 2016. Analysing how people orient to and spread rumours in social media by looking at conversational threads. PLoS ONE, 11(3):1–29.