Kondo exhaustion and conductive surface states in antiferromagnetic YbIr3Si7
The interplay of Kondo screening and magnetic ordering in strongly correlated materials containing local moments is a subtle problem.Schaffer et al. (2016) Usually the number of conduction electrons matches or exceeds the number of moments, and a Kondo-screened heavy Fermi liquid develops at low temperatures.Kontani and Yamada (2005) Changing the pressure, magnetic field, or chemical doping can displace this heavy Fermi liquid in favor of a magnetically ordered state.Stewart (2001, 2006) Here we report the discovery of a version of such a ‘Kondo lattice’ material, YbIr3Si7, in which the number of free charge carriers is much less than the number of local moments. This leads to ‘Kondo exhaustion’:Meyer and Nolting (2000) the electrical conductivity tends to zero at low temperatures as all the free carriers are consumed in the formation of Kondo singlets. This effect coexists with antiferromagnetic long-range order, with a Néel temperature . Furthermore, the material shows conductive surface states with potential topological nature, and thus presents an exciting topic for future investigations.
Kondo insulators represent a complex amalgam of competing interactions: Kondo screening, Ruderman-Kittel-Kasuya-Yosida (RKKY) interactions between nearby local moments, and crystal electric field effects Dzero et al. (2016). When strong spin-orbit coupling is factored in, non-trivial topological states may occur Dzero et al. (2010). Very few of the suggested Kondo insulator compounds show long-range magnetic order. Of those that do order magnetically, UFe4P12 is ferromagnetic below Nakotte et al. (1999), and CeOs2Al10 is antiferromagnetic below Kawabata et al. (2015). Here, we report the discovery of a new material, YbIr3Si7, which appears to be at the border of Kondo insulating behavior, and which also exhibits both long-range antiferromagnetic order and conductive surface states. The presence of surface states in YbIr3Si7 but not in YbRh3Si7 Rai et al. (2018) favors a topology scenario, given the larger spin-orbit coupling in the former compound. In addition, it appears that the smaller chemical pressure at the surface induces a valence change from magnetic Yb3+ in the bulk to the larger, non-magnetic Yb2+ on the surface. Hence, the more a conductive surface could be a consequence of the lack of Kondo effect from the non-magnetic Yb2+ ions. Conductive surface associated with a topological crystalline insulator state is also a possibility, albeit much less likely, given the low symmetry of the surface of the rhombohedral YbIr3Si7-type structure.Rai et al. (2018)
YbIr3Si7 exhibits several striking and unusual features. First, the usual mild Kondo upturn in the resistivity below the single-ion Kondo temperature appears instead as an increase of the resistivity by several orders of magnitude. As we show below, the bulk part of the conductivity tends to zero in the low-temperature limit. Second, the onset of antiferromagnetic order does not prevent the continued rise of the resistivity even for . Third, this all happens in parallel with a much more gentle evolution of the surface transport, which remains conducting even at the lowest temperatures. We interpret the robust loss of carriers in terms of the Kondo exhaustion scenario, first proposed by Nozières Nozière (1985, 1998) and subsequently investigated numerically by Meyer and Nolting Meyer and Nolting (2000). The origin and nature of the surface states is less clear, but would merit further investigation, especially due to the potential for topological protection, hinted at by the strong spin-orbit coupling in this material, and by the lack of comparable surface conductivity in the isostructural compound YbRh3Si7 Rai et al. (2018).
The physics of YbIr3Si7 appears to be distinct from both of the isostructural materials YbIr3Ge7 and YbRh3Si7 recently reported Rai et al. (2019, 2018), and from the known Kondo insulators CeFe4P12, Ce3Bi4Pt3 Hundley et al. (1990), CeFe2Al10, CeRu4Sn6 Das and Sampathkumaran (1995), SmB6 Menth et al. (1969) and YbB12 Kasaya et al. (1983, 1985). YbIr3Ge7 and YbRh3Si7 show Kondo screening giving way to long-range magnetic order and are low-carrier or bad metals at low temperatures. Conversely, the other Kondo insulators mentioned above are paramagnets or intermediate-valence materials without long-range magnetic order. Long-range antiferro- or ferromagnetic order occurs only in CeOs2Al10 Kawabata et al. (2015) and UFe4P12 Meisner et al. (1985), with YbIr3Si7 the first Yb-based material in the insulator class (albeit at the boundary of that class) that orders antiferromagnetically below .
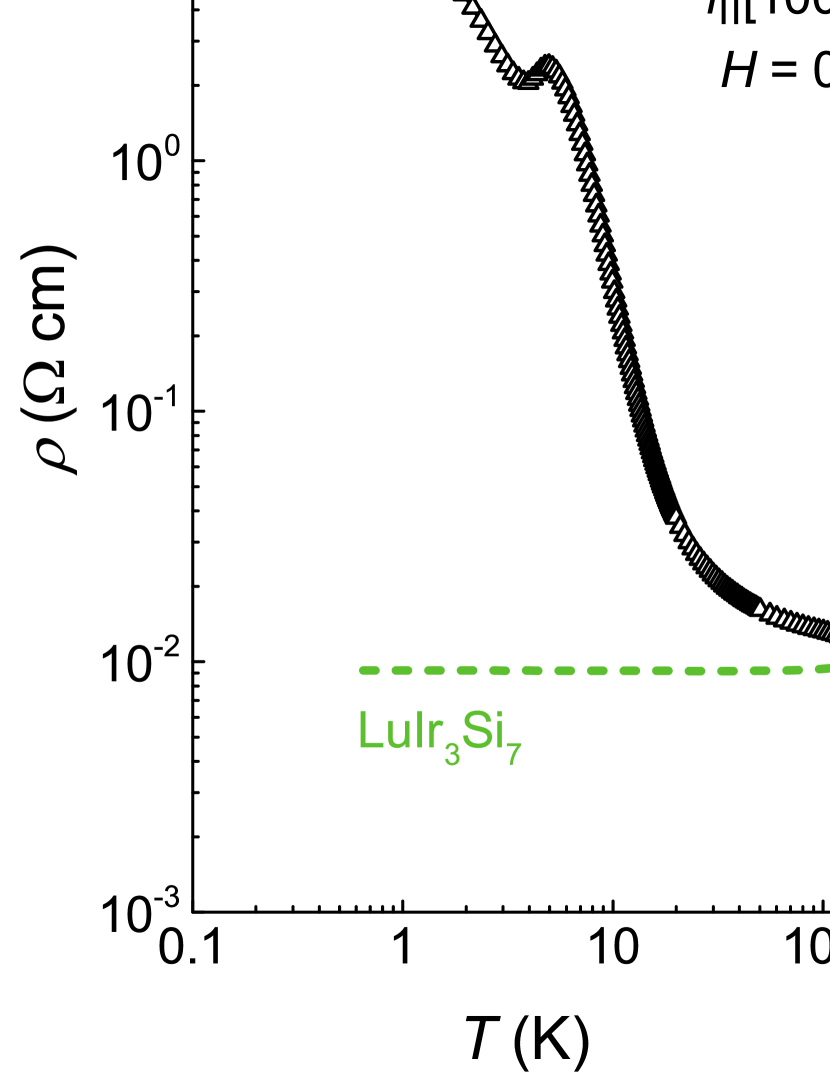
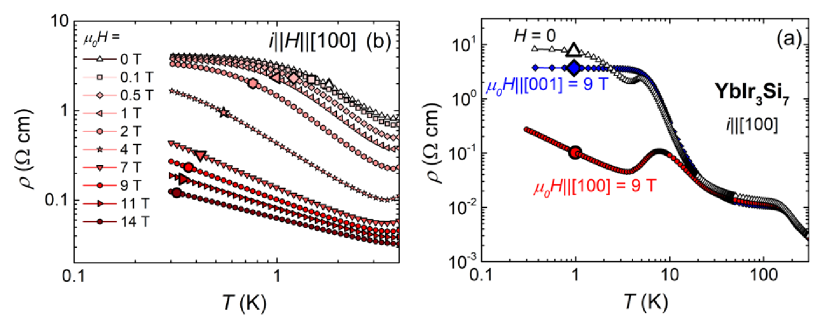
Fig. 1(a) shows evidence for the insulating behavior in the = 0 electrical resistivity of YbIr3Si7 (symbols). The data for the non-magnetic analog LuIr3Si7 (dashed line), where the is weakly -dependent and overall very large ( cm), demonstrate the low-carrier density nature of the Ir3Si7 ( = Yb, Lu) material class. We interpret the differences between the YbIr3Si7 and LuIr3Si7 curves as arising from the interaction between this low-carrier density conduction sea and the local moments of the holes in the Yb 4 orbitals. A striking feature is that the YbIr3Si7 resistivity increases by 4 orders of magnitude on cooling from 300 K to 0.3 K. At low , the resistivity levels off in a manner reminiscent of the plateau caused by conductive surface states in SmB6 Syers et al. (2015). On the way to the low temperature plateau, two notable inflections occur in for YbIr3Si7, above 100 K and below 10 K: the high temperature inflection is likely not related to long-range magnetic order, as it does not move in temperature between the = 0 and = 9 T (Fig. S2 in Supplementary Materials). Crystal electric field signatures in can be ruled out as the origin of the 100 K feature, since anisotropic magnetization measurements (Fig. S4 in Supplementary Materials) point to strong crystal electric field effects at much larger temperatures ( 400 K), with no visible features near 100 K. Furthermore, this feature in disappears in the dilute moment limit, as we demonstrate with resistivity measurements on Yb0.05Lu0.95Ir3Si7 (Fig. S3 in Supplementary Materials), ruling out single-ion crystal electric field effects. Lastly, a structural phase transition can also be ruled out since neutron diffraction data at T = 1.5 K, shown below, confirm the room temperature structure. The most likely explanation for the 100 K resistivity feature is the onset of Kondo correlations around this temperature.
The description of the low- resistivity in YbIr3Si7 goes beyond the purely paramagnetic Kondo screening scenario. As neutron scattering and thermodynamic measurements reveal — see below — antiferromagnetic long-range order sets in at = 4.1 K. The onset of this order is associated with a drop in resistivity for temperatures just below the Néel temperature, which we interpret as the temporary ‘liberation’ of free carriers as the magnetic moments emerge from their screening clouds to form the Néel state. However, contrary to the usual behavior for , the resistivity then resumes its rise, suggesting that there are not enough carriers left to screen the remaining non-ordered fraction of each local moment.
The low-temperature resistivity of YbIr3Si7 is akin to the low-temperature plateau in the resistivity of SmB6 attributed to conductive surface states Phelan et al. (2014). One test for the validity of this hypothesis is the dependence of the total resistivity on sample thickness ; the relative sample surface (conductive) to bulk volume (insulating) ratio increases when the thickness decreases, and should result in an overall resistivity decrease. Fig. 1b confirms the low- resistivity decrease as the crystal is thinned from 723 m to 77 m. The insulating bulk dominates the resistivity above 400 m (black), but for thinner samples the low- resistivity drops by an order of magnitude. For a more quantitative estimate of the contributions of the bulk resistance = and surface resistance = to the total resistance , ( = voltage drop distance, = sample width, = sample thickness), one can write
or
which gives
| (1) |
When plotting as a function of thickness (Fig. 1c), eqn. 1 suggests that different isothermal plots should be lines with the slope and intercept inversely proportional to and , respectively. This is true if the two contributions and are thickness-independent, and such an assumption is indeed validated by the linear plots shown in Fig. 1c (symbols). The dotted lines are fits to eqn. 1, from which the and values are extracted. A comparison between the surface and bulk resistivities, scaled at 20 K (Fig. 1d) reveals a much weaker temperature dependence of compared to , consistent with a much more conductive surface compared to the bulk.
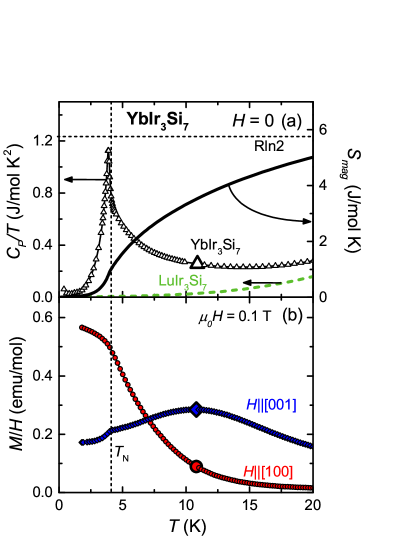
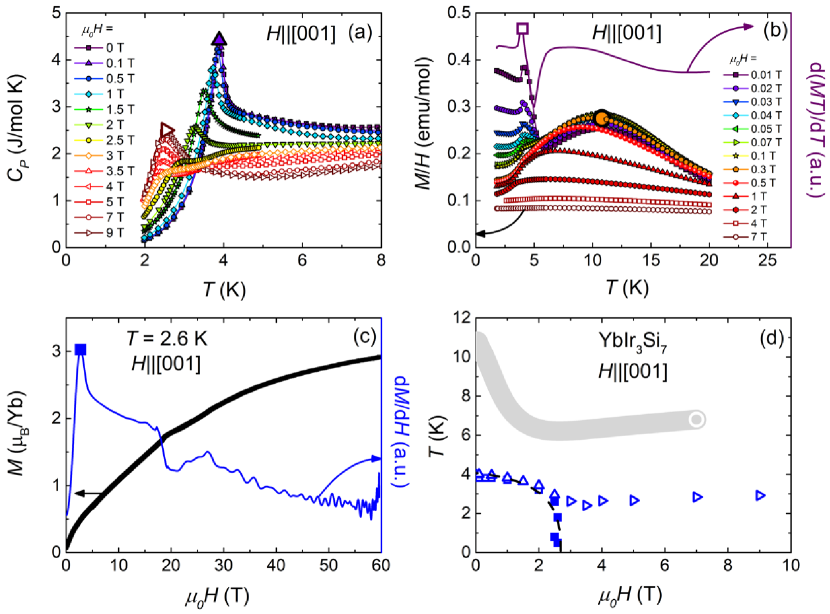
Thermodynamic measurements reveal long-range magnetic order in YbIr3Si7 below = 4.1 K (Fig 2). The zero-field specific heat data for YbIr3Si7 (symbols, Fig 2a) show a peak at 4.1 K, while the non-magnetic analog LuIr3Si7 (dashed line) displays much smaller values and no phase transition. Above the ordering temperature, a large tail in the YbIr3Si7 specific heat could be the result of short-range magnetic interactions. The magnetic entropy for YbIr3Si7 (solid line, Fig. 2a) was estimated from =, where (YbIr3Si(LuIr3Si7). At , the low entropy release of 15% ln2 signals Kondo screening, with an estimated Kondo temperature 16 K from . With this estimate in mind, the low temperature inflection in the = 0 YbIr3Si7 resistivity data (Fig. 1a) can be correlated to Kondo screening.
Further confirmation of the long-range magnetic order is provided through anisotropic magnetic susceptibility measurements / shown in Fig. 2. Temperature-dependent / measurements with = 0.1 T confirm the magnetic phase transition as small inflections are observed on cooling for both [100] (circles) and [001] (diamonds). On warming above , the [001] data (full diamonds in Fig. 2b) display a broad maximum centered around 10 K, while a similar feature at 10 K is absent in the [100] field orientation. The crossing of the anisotropic / curves just above is reminiscent of the hard axis ordering observed in both known isostructural Yb systems YbIr3Ge7Rai et al. (2019), YbRh3Si7Rai et al. (2018), and in the few known FM Kondo lattice compounds.Hafner et al. (2019) Indeed, the susceptibility at high temperatures (Fig. S4 in Supplementary Materials) is indicative of large crystal electric field anisotropy favoring a [001] easy axis. The average magnetization was calculated using = (2 + ). A linear fit to the average inverse susceptibility at high temperatures (above 350 K) yields an effective moment = 4.42 , which is close to the theoretical value of 4.54 for Yb3+.
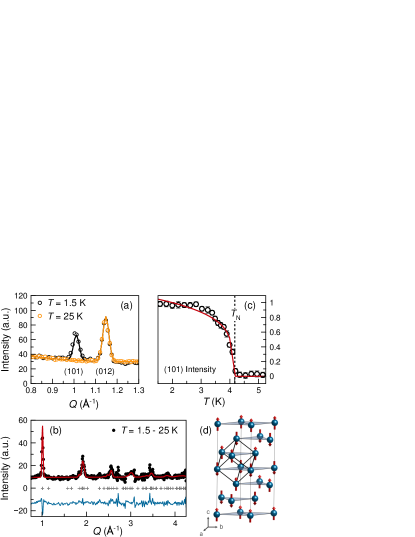
In order to elucidate the nature of the magnetic ground state, we performed powder neutron diffraction measurements. Upon cooling from 25 K (orange symbols, Fig. 3a) to 1.5 K (black symbols, Fig. 3a), we observe the formation of magnetic Bragg peaks, which can be indexed with the propagation vector . There are three possible irreducible representations, , , and , for Yb3+ sitting at the Wyckoff site within the space group. The latter two of these possible magnetic structures can be ruled out, since they would generate intense magnetic Bragg peaks at positions where no peaks are observed in experiment. We are left to consider only the irreducible representation, and the Rietveld refinement with this magnetic structure is shown in Fig. 3b. The magnetic diffraction pattern was isolated by subtracting a data set collected at K from a data set collected at K. This gives excellent agreement between the refinement (red line in Fig. 3b) and the measured data (black symbols). Furthermore, the order parameter (Fig. 3c), which is derived by fitting the intensity of the (101) magnetic Bragg peak, drops to 0 at = 4.1 K, consistent with the thermodynamic data (Fig. 2). In the antiferromagnetically-ordered state (Fig. 3d), all the Yb3+ moments are oriented along the crystallographic axis ([001]). Each Yb3+ moment is aligned anti-parallel with its six nearest neighbors in the nearly cubic Yb sublattice (outlined in Fig. 3d), and parallel with its co-planar next nearest neighbors (grey sheets). The refined ordered moment is 1.51(5) /Yb3+.
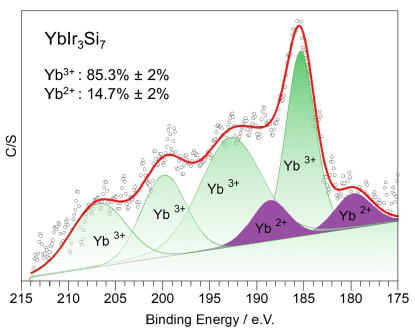
The magnetization (Fig. 2) and neutron diffraction data (Fig. 3) on YbIr3Si7 confirm the trivalent state of the Yb ions in the bulk. However, XPS measurements probe a smaller volume-to-surface ratio than bulk measurements, and are more sensitive to surface valence changes. Our XPS data (Supplementary Materials, Fig. S8) on YbIr3Si7 reveal mixed valence of the Yb ions in the measured volume close to the surface, suggesting a valence change from Yb3+ (smaller) in the bulk to Yb2+ (larger) on the surface. This is possibly due to the smaller chemical pressure at the crystal surface,Johansson (1979) and, in turn, may be responsible for the enhanced surface conductivity in the absence of Kondo effect from the non-magnetic Yb2+ ions.
YbIr3Si7 shows a remarkable portfolio of physical properties that makes it unique among known Kondo insulators: the Kondo insulating behavior is accompanied by long range AFM order, large crystal electric field anisotropy and conductive surface states. This provides a complex energy landscape to explore a variety of quantum interactions and their interplay with surface topology. To determine the cause of the insulating behavior, we performed DFT+U calculations to map the band structure of YbIr3Si7 (see the Supplementary Materials). The band structure calculation, however, is unable to capture the opening of a gap and shows bands crossing the Fermi level even when accounting for strong Kondo hybridization, indicating that the insulating behavior is a many-body effect. To fully understand the arrangement of competing interactions responsible for the insulating behavior, more sophisticated methods such as DMFT calculations are warranted. Further experimental investigation on YbIr3Si7 will include ARPES and transport as a function of sample morphology (underway), as well as point contact spectroscopy, aimed at characterizing the origin of the surface and bulk properties. However, some of these experiments are impeded by the three-dimensional rhombohedral structure, which does not lend itself to cleaving as is needed for some of these experiments.
Acknowledgments. MS, CLH, and EM acknowledge support from the Gordon and Betty Moore Foundation EPiQS initiative through grant GBMF 4417. EM also acknowledges partial travel support to Max Planck Institute in Dresden, Germany from the Alexander von Humboldt Foundation Fellowship for Experienced Researchers, where part of the work was carried out. Research at PARADIM (Platform for the Accelerated Realization, Analysis, and Discovery of Interface Materials) was supported by the National Science Foundation grant no. DMR-1539918. VL and AHN were supported by the Robert A. Welch Foundation grant C-1818. AHN also acknowledges the support of the National Science Foundation grant no. DMR-1350237. A portion of this work was performed at the National High Magnetic Field Laboratory, which is supported by the National Science Foundation Cooperative Agreement No. DMR-1644779, the State of Florida, and the United States Department of Energy. The use of the EPMA facility in the Department of Earth Science, Rice University is kindly acknowledged. KRL, PDS, and JCE would like to acknowledge support of the Jean Perkins Foundation, Florida State University, and Los Alamos National Laboratory. ABP thanks the Indo-US Science and Technology Forum (IUSSTF) for financial support in the form of a postdoctoral fellowship. CAH gratefully acknowledges financial support from the Engineering and Physical Sciences Research Council (UK) via grant number EP/R031924/1. He also thanks Rice University for its hospitality during a four-month visiting professorship where some of this work was carried out. We are grateful for fruitful discussions with B. Rai, T. McQueen, N. Caroca-Canales, C. Geibel, P. Coleman and L. Balicas.
Note: While our manuscript has been under review at Nature Physics, Nakamura et al. reported (J. Phys. Soc. Jpn. 88, 093705) the properties of YbIr3Si7 single crystals grown from Sb flux. The properties they report are drastically different from those on our single crystals, which, in our experience, is very likely associated with Sb incorporation.
References
- Schaffer et al. (2016) R. Schaffer, E. Kin-Ho Lee, B.-J. Yang, and Y. B. Kim, Reports on Progress in Physics 79, 094504 (2016).
- Kontani and Yamada (2005) H. Kontani and K. Yamada, Journal of the Physical Society of Japan 74, 155 (2005).
- Stewart (2001) G. R. Stewart, Review of Modern Physics 73, 797 (2001).
- Stewart (2006) G. R. Stewart, Review of Modern Physics 78, 743 (2006).
- Meyer and Nolting (2000) D. Meyer and W. Nolting, Physical Review B 61, 13465 (2000).
- Dzero et al. (2016) M. Dzero, J. Xia, V. Galitski, and P. Coleman, Annual Review of Condensed Matter Physics 7, 249 (2016).
- Dzero et al. (2010) M. Dzero, K. Sun, V. Galitski, and P. Coleman, Physical review letters 104, 106408 (2010).
- Nakotte et al. (1999) H. Nakotte, N. Dilley, M. Torikachvili, H. Bordallo, M. Maple, S. Chang, A. Christianson, A. Schultz, C. Majkrzak, and G. Shirane, Physica B: Condensed Matter 259, 280 (1999).
- Kawabata et al. (2015) J. Kawabata, T. Ekino, Y. Yamada, Y. Sakai, A. Sugimoto, Y. Muro, and T. Takabatake, Physical Review B 92, 201113 (2015).
- Rai et al. (2018) B. K. Rai, S. Chikara, X. Ding, I. W. H. Oswald, R. Schönemann, V. Loganathan, A. M. Hallas, H. B. Cao, M. Stavinoha, T. Chen, H. Man, S. Carr, J. Singleton, V. Zapf, K. A. Benavides, J. Y. Chan, Q. R. Zhang, D. Rhodes, Y. C. Chiu, L. Balicas, A. A. Aczel, Q. Huang, J. W. Lynn, J. Gaudet, D. A. Sokolov, H. C. Walker, D. T. Adroja, P. Dai, A. H. Nevidomskyy, C.-L. Huang, and E. Morosan, Phys. Rev. X 8, 041047 (2018).
- Nozière (1985) P. Nozière, Ann. Phys. (Paris) 10, 19 (1985).
- Nozière (1998) P. Nozière, Eur. Phys. J. B 6, 447 (1998).
- Rai et al. (2019) B. K. Rai, M. Stavinoha, J. Banda, D. Hafner, K. A. Benavides, D. Sokolov, J. Chan, M. Brando, C.-L. Huang, and E. Morosan, Phys. Rev. B(R) 99, 121109 (2019).
- Hundley et al. (1990) M. Hundley, P. Canfield, J. Thompson, Z. Fisk, and J. Lawrence, Physical Review B 42, 6842 (1990).
- Das and Sampathkumaran (1995) I. Das and E. Sampathkumaran, Physical Review B 51, 1308 (1995).
- Menth et al. (1969) A. Menth, E. Buehler, and T. Geballe, Physical Review Letters 22, 295 (1969).
- Kasaya et al. (1983) M. Kasaya, F. Iga, K. Negishi, S. Nakai, and T. Kasuya, Journal of Magnetism and Magnetic Materials 31, 437 (1983).
- Kasaya et al. (1985) M. Kasaya, F. Iga, M. Takigawa, and T. Kasuya, Journal of Magnetism and Magnetic Materials 47, 429 (1985).
- Meisner et al. (1985) G. Meisner, M. Torikachvili, K. Yang, M. Maple, and R. Guertin, Journal of Applied Physics 57, 3073 (1985).
- Syers et al. (2015) P. Syers, D. Kim, M. S. Fuhrer, and J. Paglione, Physical review letters 114, 096601 (2015).
- Phelan et al. (2014) W. Phelan, S. Koohpayeh, P. Cottingham, J. Freeland, J. Leiner, C. Broholm, and T. McQueen, Physical Review X 4, 031012 (2014).
- Hafner et al. (2019) D. Hafner, B. K. Rai, J. Banda, K. Kliemt, C. Krellner, J. Sichelschmidt, E. Morosan, C. Geibel, and M. Brando, Physical Review B 99, 201109(R) (2019).
- Johansson (1979) B. Johansson, Physical Review B 19, 6615 (1979).
- Lynn et al. (2012) J. Lynn, Y. Chen, S. Chang, Y. Zhao, S. Chi, W. Ratcliff, et al., Journal of research of the National Institute of Standards and Technology 117, 61 (2012).
- Rodríguez-Carvajal (1993) J. Rodríguez-Carvajal, Physica B: Condensed Matter 192, 55 (1993).
- Torikachvili et al. (1986) M. Torikachvili, C. Rossel, M. McElfresh, M. Maple, R. Guertin, and G. Meisner, journal of Magnetism and Magnetic Materials 54, 365 (1986).
- Cooley et al. (1999) J. Cooley, C. Mielke, W. Hults, J. Goettee, M. Honold, R. Modler, A. Lacerda, D. Rickel, and J. Smith, Journal of superconductivity 12, 171 (1999).
- Perdew et al. (1996) J. P. Perdew, K. Burke, and M. Ernzerhof, Physical review letters 77, 3865 (1996).
- Blaha et al. (2001) P. Blaha, K. Schwarz, G. K. Madsen, D. Kvasnicka, and J. Luitz, An augmented plane wave+ local orbitals program for calculating crystal properties (2001).
- Anisimov et al. (1993) V. I. Anisimov, I. Solovyev, M. Korotin, M. Czyżyk, and G. Sawatzky, Physical Review B 48, 16929 (1993).
Supplementary Materials
.1 Crystallography
Single crystals of YbIr3Si7 were oriented using back scattering x-ray Laue diffraction along [100] and [001] in the equivalent hexagonal unit cell setting. Each crystal was mounted onto a three-axis goniometer, and the goniometer was placed onto the stage of a MWL101 real-time back-reflection Laue camera system from Multiwire Laboratories, Ltd. All images were collected using an applied voltage of 10 kV and current of 10 mA to the tungsten x-ray source. Total counting times for all images varied but did not exceed five minutes.
| Formula | YbIr3Si7 |
|---|---|
| (Å) | 7.5562(3) |
| (Å) | 20.0662(11) |
| (Å3) | 992.21(9) |
| Crystal dimensions (mm3) | 0.1 x 0.07 x 0.07 |
| range (°) | 3.7 - 30.6 |
| Extinction coefficient | 0.00072(2) |
| absorption coefficient (mm-1) | 75.329 |
| measured reflections | 7570 |
| independent reflections | 377 |
| Rint | 0.0807 |
| goodness-of-fit on F2 | 1.053 |
| for | 0.0220 |
| 0.0379 |
The rhombohedral space group was confirmed in YbIr3Si7 and LuIr3Si7 using powder x-ray diffraction refinement. Additionally, single crystal x-ray diffraction refinement was used to confirm the space group and full occupancies of the crystallographic sites in YbIr3Si7. Powder x-ray diffraction measurements were performed at ambient temperature using a Bruker D8 Advance diffractometer with Cu K radiation. Rietveld refinement was done using the TOPAS software package. Single crystal x-ray diffraction was conducted using a Rigaku SCX Mini diffractometer with Mo K radiation. Integration of raw frame data was done using CRYSTALCLEAR 2.0. Refinement of the diffraction data was performed using XPREP and SHELXTL software packages.
Electron probe microanalysis (EPMA) was performed to obtain quantitative analysis of the Yb-Ir-Si and Lu-Ir-Si phases using wavelength dispersive spectrometry (WDS). The compositions were shown to be Yb0.99(1)Ir3.00(2)Si7.01(2) and Lu1.02(3)Ir3.04(4)Si6.95(6). The data was acquired at the EPMA laboratory, Earth Science Department, Rice University, using a JEOL JXA 8530F Hyperprobe equipped with a field emission (Schottky) emitter and five WDS spectrometers. The analytical conditions used were 15 kV accelerating voltage, 50 nA beam current, 300 nm beam diameter, and counting times of 10 seconds per peak and 5 seconds per each lower and upper background, respectively. The standards used for element calibration were synthetic metals (Si metal and Ir metal) for Si and Ir, respectively, and REE2 glass8 for Lu and Yb. Both Ir and Yb were concomitantly analyzed on two different spectrometers using two types of diffracting crystals (LiF and LiFH for Ir and PET and PETL for Yb) in order to improve the x-ray statistics and increase the accuracy of the analysis. LiFH and PETL diffracting crystals have much higher sensibility (3-4 times higher x-ray intensities) compared to LiF and PET crystals. The PhiRoZ matrix correction was employed for quantification.
.2 Thermodynamic and Transport Properties
Resistivity and specific heat measurements were performed in a Quantum Design (QD) physical property measurement system (PPMS) equipped with a 3He insert. Temperature-dependent ac resistivity measurements were performed using = 0.05 mA ( = 0.1 mA above 50 K) and = 35.54 Hz for a duration of 3 s. Resistivity measurements performed as a function of sample thickness were conducted on the same sample thinned using mechanical polishing with the leads reapplied before each measurement. Resistivity measurements performed up to 14 T were done using a QD DynaCool physical properties measurement system equipped with a dilution refrigerator. The electrical transport option for resistivity was performed using = 0.1 - 1 mA, = 18.3 Hz, and an averaging time of 2.3 s. Specific heat measurements were performed using an adiabatic relaxation method. A QD magnetic properties measurement system was used to perform dc magnetic susceptibility measurements up to 400 K. High-temperature magnetic susceptibility measurements were carried out on a QD PPMS equipped with the VSM oven option. The measurements covered a temperature range from 300 K to 1000 K. The system calibration was confirmed both before and after the measurements using a palladium calibration standard, the system showing a repeatability of better than 0.2%. Each sample was measured at least three times with each run agreeing within the noise floor of the system.
For the neutron diffraction measurements, the sample was loaded into a liquid helium cryostat with a base temperature of 1.5 K. To search for magnetic scattering the high intensity/coarse resolution BT-7 spectrometer was employed in two-axis mode, with a fixed initial neutron energy of 14.7 meV (wavelength 2.359 Å) and collimator (full-width-half-maximum) configuration open—PG(002) monochromator—80’—sample—80’ radial-collimator—position-sensitive detector.Lynn et al. (2012) The refinements were determined by the Rietveld method with the FullProf suite.Rodríguez-Carvajal (1993)
Fig. S2 shows details of the electrical resistivity () in a log-log scale, for (a) = 0 (triangles), 9 T and [100] (circles) and [001] (diamonds), and (b) [100], with applied field values up to 14 T. The preliminary anisotropic () data (Fig. S2(a)) points to a qualitative change of the temperature dependence with increasing field. Indeed, the applied magnetic field (Fig. S2(b)) changes the temperature dependence from - ln ( = 0, open triangles) to power law -α above 7 T. In a Kondo screening scenario, it can indeed be expected that the ln divergence of the resistivity at low changes to a power law with band polarization in applied magnetic field.
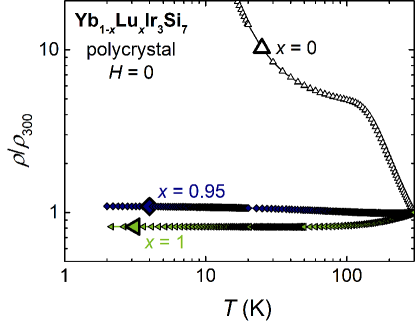
Non-magnetic Lu doping in YbIr3Si7 was used in an attempt to characterize the 100 K inflection in the = 0 () data. Single-ion CEF effects would be expected to scale with the number of magnetic Yb ions (1-). Since the resistivity inflection has disappeared in the highly diluted = 0.95 sample (Fig. S3, diamonds), it is unlikely due to CEF effects, rendering the onset of Kondo correlations the most likely scenario. Indeed, anisotropic inverse magnetic susceptibility data shown in Fig. S4 indicates that CEF splitting occurs at much higher temperatures since no deviations from the Curie-Weiss are observed in the average inverse magnetic susceptibility (solid line, Fig. S4) up to 600 K.
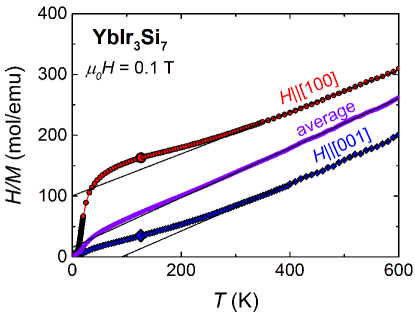
Fig. S5 shows the temperature-dependent specific heat (a) and magnetic susceptibility / (b) measured in different fields, as well as an example of an () isotherm (c, = 2.6 K), for [001]. Increasing field moves the antiferromagnetic transition to lower temperatures (full triangle). However, above = 2.5 T, the peak defines a new phase boundary, as moves to slightly larger values as increase up to 9 T (open side triangle). The AFM phase boundary is also marked by a peak in () (symbols, b), with determined from the peak in ()/ (open square) and the metamagnetic transition (Fig. S5(c)) best evidenced as the maximum (full square) in the derivative / (line). The resulting phase diagram is shown in Fig. S5(d). A as-of-yet unexplained broad maximum in () (Fig. S5(b), large circle) is depicted as a cross-over (grey line) on the phase diagram.
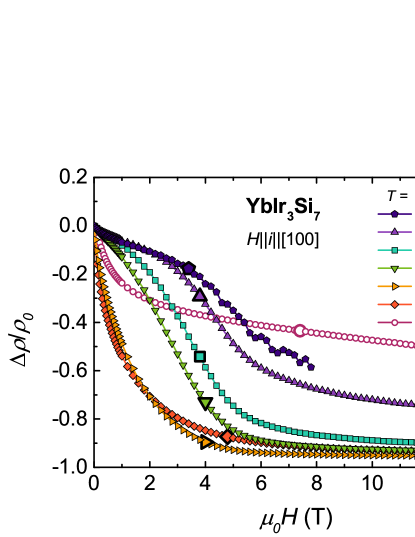
The complex field dependence of the thermodynamic measurements motivated an investigation of the field dependence of the magnetoresistance. Large longitudinal magnetoresistance (MR) is registered in YbIr3Si7 (Fig. S6). At = 10 K ( , open circles), a moderately large MR(14T) -53% was measured with [100]. For temperatures below (full symbols), the negative MR increases to a maximum of -95% and plateaus above 8 T. This large, negative MR below the ordering temperature is similar to that of the magnetic KI UFe4P12, where the MR approaches -90% near the ordering temperature,Torikachvili et al. (1986) attributed to the delocalization of the conduction electrons by disturbing the Kondo screening with applied magnetic field. SmB6 reaches a similarly large, negative MR, albeit at a much higher applied field of 86 T when the hybridization gap is closed.Cooley et al. (1999) This field value is nearly an order of magnitude larger than in YbIr3Si7, consistent with a Kondo temperature of 80 K in the former,Phelan et al. (2014) an order of magnitude larger than in the present compound.
.3 Band Structure Calculations
In order to obtain an insight into the electronic properties of YbIr3Si7, we have performed first principles density functional theory (DFT) calculations using the generalized gradient approximation for the exchange-correlation functional following Perdew, Burke and Ernzerhof (PBE).Perdew et al. (1996) The full-potential linearized augmented plane wave (LAPW) method was used, as implemented in the Wien2k package,Blaha et al. (2001) with the scalar spin-orbit coupling included in the calculation. We have performed the electronic structure in the paramagnetic (PM) and the antiferromagnetically (AFM) ordered ground state of YbIr3Si7, as determined from the neutron scattering (see Fig. 3 in the main text). The resulting band structure in the PM state is shown in Fig. S7(a), plotted along the high-symmetry lines in the Brillouin zone (BZ), with the radius of the circles reflecting the electron contribution to the respective Bloch band. In an attempt to capture the effect of strong correlations on the -orbitals, we have performed the DFT+U calculationsAnisimov et al. (1993) in the AFM state, with the Hubbard = 4 eV on Yb ions. This results in one -band at the chemical potential, shown in Fig. S7(b), which is split from the other six -bands that now lie about 4 eV below (not shown).
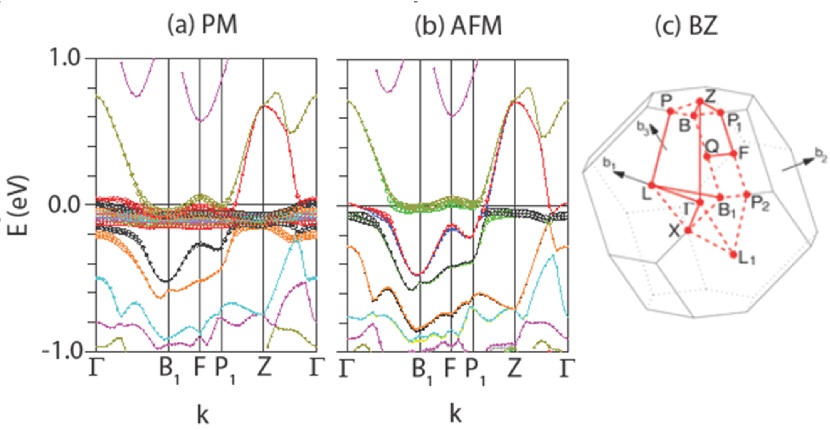
As Fig. S7 shows, the nearly flat Yb 4 band (light green in the center of the plot) hybridizes with the dispersive conduction electron band. Intriguingly, there is another conduction band (inverted parabola centered around the Z point, shown in red in Fig. S7(a), (b)), which appears not to hybridize with the band. As a result, there is a non-vanishing electron density of the states at the chemical potential in both the PM and AFM states. Based on these results, DFT would predict YbIr3Si7 to be a metal, contrary to the insulating behavior of the bulk resistivity reported in Fig. 1 in the main text. The Kondo hybridization, central to understanding this behavior, is a many-body effect not captured by the single-particle DFT calculations. Other, non-perturbative techniques are desirable in order to understand this effect. However, they are beyond the scope of the present work and are left for an upcoming study.
.4 Yb Valence Determination Using XPS
XPS was used to determine the ratio of Yb3+ to Yb2+ in YbIr3Si7 by measuring several spots approximately 7.5 microns in diameter and 10 nm deep. A PHI Quantera II XPS spectrometer with monochromated Al K at 1486.6 eV and 26 eV pass energy was used to obtain the XPS spectra. We measured several points, and the Yb 4 spectrum at one point is shown in Fig. S8. It is very complex and constructed of six peaks that correspond either to Yb3+ or Yb2+ states. The relative abundance of Yb3+ vs. Yb2+ is computed from the area under each peak. For the measured volume close to the crystal surface, Yb appears to be in a mixed valence, with an average ratio Yb3+ : Yb2+ = 85.3 : 14.7, and this composition is consistent between all measured points. Given that bulk measurements (neutron diffraction and magnetization) only detect Yb3+ valence (when the volume to surface ratio is much larger than in the XPS measurements), this mixed valence appears likely due to Yb2+ valence predominantly on the surface.