Infrared-excess white dwarfs in the Gaia 100 pc sample
Abstract
We analyse the 100 pc Gaia white dwarf volume-limited sample by means of VOSA (Virtual Observatory SED Analyser) with the aim of identifying candidates for displaying infrared excesses. Our search focuses on the study of the spectral energy distribution (SED) of 3,733 white dwarfs with reliable infrared photometry and colours below 0.8 mag, a sample which seems to be nearly representative of the overall white dwarf population. Our search results in 77 selected candidates, 52 of which are new identifications. For each target we apply a two-component SED fitting implemented in VOSA to derive the effective temperatures of both the white dwarf and the object causing the excess. We calculate a fraction of infrared-excess white dwarfs due to the presence of a circumstellar disk of 1.60.2%, a value which increases to 2.60.3% if we take into account incompleteness issues. Our results are in agreement with the drop in the percentage of infrared excess detections for cool (8,000 K) and hot (20,000 K) white dwarfs obtained in previous analyses. The fraction of white dwarfs with brown dwarf companions we derive is 0.1–0.2%.
keywords:
(stars:) white dwarfs – (stars:) circumstellar matter – (stars:) brown dwarfs – (astronomical data bases:) virtual observatory tools1 Introduction
Low- and intermediate-mass main sequence stars () end their lives as white dwarfs (WDs; e.g. Siess 2007). WDs are hence the most common stellar remnants and are one of the most common objects in the Galaxy. Given that WDs are compact objects and nuclear reactions have ceased in their interiors, their structure is supported by the pressure of the degenerate electrons in their cores. The energy reservoir available from previous evolutionary phases is contained within this degenerate core and radiated away through a thin envelope of non-degenerate matter following a moderately well-understood cooling process (see e.g. the review by Althaus et al. 2010 and reference therein for a thorough discussion of this issue). This envelope is generally formed by an upper layer of hydrogen of 10-2-10-4 M⊙and a lower layer of helium of 10-15-10-5 M⊙(see e.g. Castanheira & Kepler, 2008; Tremblay & Bergeron, 2008). Due to the high surface gravity acting on WD atmospheres, the heavier elements sink towards the deep interiors. Hence, the optical spectra of the majority of WDs show Balmer absorption lines typical of hydrogen-rich atmospheres, or helium absorption lines if this hydrogen layer is lost (Bergeron et al., 2011; Koester & Kepler, 2015). However, 25-50 per cent of WDs show heavy elements apart from hydrogen and helium (Zuckerman et al., 2003; Koester et al., 2014). These WDs are referred to as DAZs and DBZs, respectively, or DZs if only metal lines are observed. It is of vital importance to understand how these metals reached the atmosphere of those WDs.
Planets and minor planets located a few AUs away from a host star are expected to survive the giant phases once the star evolves out of the main sequence and becomes a WD (Burleigh et al., 2002; Jura, 2008). This implies the orbits of these planets expand, a rearrangement that causes instability to the system. This perturbation may cause some of the surviving minor planets to enter into the tidal radius of the WD and, as a consequence, to be disrupted and accreted (Debes & Sigurdsson, 2002; Debes et al., 2012) during a process that can last a few Gyrs (Bonsor et al., 2011; Veras et al., 2013). The accretion of planetary material leads to the enrichment of heavy elements in the atmosphere of the WD, explaining the identification of metal transitions in the spectra of such DZ WDs. An additional observational feature that arises as a consequence of the disruption of a minor planet is a dust and/or a gas disk within the tidal radius of the WD (Gänsicke et al., 2006; Xu & Jura, 2012; Dennihy et al., 2018). It has been observed that some of these dusty WDs are dynamically active (Xu & Jura, 2014) and recently, transits from an actively disintegrating asteroid have been discovered for the first time around a dusty WD (Vanderburg et al., 2015). The observational feature of dust disks around WDs is the detection of infrared (IR) excess (e.g. Zuckerman & Becklin, 1987). Apart from a few exceptions (Xu et al., 2015; Wilson et al., 2019), the great majority of dusty WDs display also traces of heavy elements in their atmospheres. The dust disk occurrence is about 1–4% for WDs (Barber et al., 2012; Rocchetto et al., 2015; Wilson et al., 2019). For less than 0.5% of the cases, the excess arises from the existence of a sub-stellar brown dwarf companion (Farihi & Christopher, 2004; Farihi et al., 2005). It is also possible that the IR-excess arises from the presence of low-mass star companions that are outshined in the optical by the flux of a relatively hot WD (Rebassa-Mansergas et al., 2010; Badenes et al., 2013; Rebassa-Mansergas et al., 2016).
The presence of metals in the atmosphere of a WD provides unique information about the composition of the accreted material (Klein et al., 2010; Gänsicke et al., 2012; Xu et al., 2014; Hollands et al., 2018a), which is found to be chemically Earth-like (Wilson et al., 2016). Pollution rich in water (Farihi et al., 2013; Raddi et al., 2015) as well as water/ice-rich and volatile-rich (C & N) (Xu et al., 2017) has also been observed. Unfortunately, the current number of confirmed WDs by Spitzer observations displaying infrared excess due to a circumstellar disk is just 35 (see the recent review by Farihi 2016 and reference therein), which makes it difficult to characterise the properties of extreme planetary systems. In this work we aim at identifying additional IR-excess WD candidates, in particular those with a circumstellar disk, by analysing the most complete and volume-limited sample of WDs to date, identified thanks to the data provided by the second release of the Gaia mission.

2 Identification of infrared-excess White Dwarf candidates
The data provided by the Gaia satellite through its Second Data Release has allowed identifying unprecedented samples of both single and binary WDs (e.g. El-Badry & Rix, 2018; Gentile Fusillo et al., 2019), as well as compiling the largest and most complete volume-limited catalogue of such objects to date within 100 pc (Jiménez-Esteban et al., 2018). In order to identify WDs with IR excess we took the sample of Jiménez-Esteban et al. (2018) of 8,555 objects at less than 100 pc and with colours below 0.8 mag available at "The SVO archive of White Dwarfs from Gaia"111http://svo2.cab.inta-csic.es/vocats/v2/wdw/. This colour cut is equivalent to excluding WDs cooler than 6,000 K and it is required due to the expected large contamination of non-WDs at lower effective temperatures (see Jiménez-Esteban et al. 2018 for details). We analysed the Spectral Energy Distributions (SEDs) of the 8,555 WDs taking advantage of VOSA222http://svo.cab.inta-csic.es/theory/vosa/ (Virtual Observatory SED Analyser; Bayo et al. 2008). VOSA is a Virtual Observatory tool that allows building the SEDs of thousands of objects in an automated way from a large number of photometric catalogues ranging from the ultraviolet to the infrared. VOSA compares the photometric data with different collections of theoretical models and determines which model best reproduces the observed data following different statistical approaches. Physical parameters (e.g. effective temperatures, luminosities) are then estimated for each WD from the model that best fits the data. VOSA also allows the identification of IR-excess in the SED and estimates the effective temperature and luminosity of the source causing the excess, which together with the Stefan-Boltzmann equation yields also its radius. Note that the calculated radius has physical meaning only when the source of excess is a companion.
| ID | Gaia ID | RA(ICRS) | DEC(ICRS) | Name | Parallax | PMRA | PMDE | comment | |
|---|---|---|---|---|---|---|---|---|---|
| DR2 | deg | deg | mas | mas/yr | mas/yr | K | |||
| 1A | 396370097820352256 | 22.4283 | 42.4715 | GD 13 | 11.880.09 | 94.490.12 | -45.590.11 | 22,000 | (1) |
| 1B | 396370093526060672 | 22.4271 | 42.4704 | 11.390.17 | 92.300.21 | -45.300.24 | 2,900 | ||
| 2A | 5119295082016649472 | 37.3367 | -24.4348 | 13.050.05 | 91.760.1 | -94.850.10 | 15,500 | (1) | |
| 2B | 5119295082017370368 | 37.3359 | -24.4350 | 13.140.06 | 89.270.11 | -98.940.12 | 3,200 | ||
| 3A | 18493721155296768 | 39.6289 | 6.6333 | PG 0235+064 | 16.890.06 | -12.770.09 | -90.990.08 | 13,000 | (1) |
| 3B | 18493721155296640 | 39.6283 | 6.6353 | 2MASS J02383078+0638071 | 16.980.07 | -11.220.11 | -87.690.10 | 3200 | |
| 4A | 16426811093797760 | 51.5877 | 11.5158 | 16.380.06 | -49.140.12 | -36.060.08 | 17,500 | (1) | |
| 4B | 16426806798453632 | 51.5884 | 11.5149 | [ZEH2003] RX J0326.3+1131 3 | 16.120.08 | -44.650.18 | -35.080.12 | M2V | |
| 5A | 166587938734739456 | 64.1762 | 32.1891 | SDSS J041642.29+321120.5 | 10.130.09 | 0.860.17 | -83.380.13 | 8250 | (2) |
| 5B | 166587938734739328 | 64.1769 | 32.1891 | 10.420.16 | 2.160,32 | -80.710.23 | 3100 | ||
| 6A | 4811421896276768128 | 73.3033 | -44.3944 | 11.130.04 | 26.870.07 | 23.220.08 | WD | (1) | |
| 6B | 4811421896275732480 | 73.3026 | -44.3937 | 11.170.08 | 25.320.16 | 23.010.18 | M4-5V | ||
| 7A | 201854258801563520 | 74.1309 | 41.5220 | 10.130.09 | -36.680.16 | -106.430.11 | 9,500 | (1) | |
| 7B | 201854258801564288 | 74.1293 | 41.5218 | 10.090.07 | -35.790.13 | -106.980.09 | 3,300 | ||
| 8A | 3439162768415866112 | 96.5553 | 32.2198 | 12.580.06 | -17.350.11 | -38.630.1 | 11,000 | (1) | |
| 8B | 3439162768415865600 | 96.5566 | 32.2202 | 12.710.11 | -19.450.20 | -37.310.18 | 3,200 | ||
| 9A | 5598661329740179712 | 116.5578 | -30.4313 | 14.490.05 | 59.430.07 | -117.240.08 | 17,500 | (1) | |
| 9B | 5598661329740179584 | 116.5575 | -30.4305 | 14.390.06 | 59.540.09 | -117.890.1 | 3,100 | ||
| 10A | 3842126835031738368 | 137.9023 | -0.2159 | 16.800.19 | 59.780.29 | -36.230.25 | 6,250 | (1) | |
| 10B | 3842126835031738496 | 137.9020 | -0.2144 | 16.660.21 | 56.930.36 | -35.100.29 | 2,800 | ||
| 11A | 1075673567146680576 | 170.0952 | 72.8795 | 11.500.06 | -63.500.10 | 5.560.09 | 15,750 | (1) | |
| 11B | 1075673567146680704 | 170.0922 | 72.8795 | 11.600.06 | -64.370.11 | 3.080.09 | 3,600 | ||
| 12A | 1692021543289085184 | 190.5089 | 75.1460 | PG 1240+754 | 12.42 0.05 | -201.850.08 | -35.090.07 | WD | (3) |
| 12B | 1692021543289084672 | 190.5142 | 75.1450 | G 255-B18B | 11.980.06 | -199.770.11 | -32.490.09 | 3200 | |
| 13A | 1552488776081383040 | 204.0067 | 48.4793 | GD 325 | 27.090.04 | -134.100.04 | -42.980.05 | 17,500 | (1) |
| 13B | 1552488776081383168 | 204.0079 | 48.4796 | 27.060.06 | -127.550.07 | -47.550.09 | 3,000 | ||
| 14A | 1604422214954487168 | 216.6841 | 50.1066 | CBS 268 | 15.280.04 | -10.600.06 | -82.720.06 | 15,250 | (4) |
| 14B | 1604422283673964160 | 216.6830 | 50.1093 | 15.200.04 | -11.700.06 | -84.830.06 | 3,300 | ||
| 15A | 1276054682231244160 | 225.4845 | 30.3831 | PG 1459+306 | 15.000.04 | -43.150.04 | 52.770.06 | 19,250 | (1) |
| 15B | 1276054677930790272 | 225.4851 | 30.3842 | 14.940.03 | -37.310.03 | 54.160.04 | 3,500 | ||
| 16A | 1643551566043342848 | 240.7042 | 67.4912 | 12.280.08 | -25.190.15 | 6.980.13 | 8,000 | (1) | |
| 16B | 1643551566043342592 | 240.7044 | 67.4898 | 12.320.03 | -24.360.06 | 4.070.05 | 3,500 | ||
| 17A | 4457170451083163392 | 242.7226 | 11.7313 | PG 1608+119 | 11.590.06 | 36.490.07 | -12.990.06 | 20,000 | (1) |
| 17B | 4457170446785639424 | 242.7218 | 11.7316 | 11.580.05 | 33.300.06 | -13.970.05 | 3,500 | ||
| 18A | 1300356053864952064 | 251.6571 | 25.3068 | 12.320.05 | -44.960.07 | 2.400.11 | 12,750 | (1) | |
| 18B | 1300356809779196288 | 251.6561 | 25.3070 | 12.250.06 | -43.780.09 | 3.700.13 | 3,100 | ||
| 19A | 4360643809885839232 | 257.3352 | -7.8785 | 13.820.08 | -37.940.13 | -112.470.09 | 17,750 | (1) | |
| 19B | 4360643809885838976 | 257.3362 | -7.8790 | 13.910.06 | -41.210.10 | -110.210.07 | 3,400 | ||
| 20A | 4366961260100103680 | 260.7060 | -2.8049 | 12.340.09 | -17.640.16 | -29.710.13 | 7,250 | (4) | |
| 20B | 4366961260100103552 | 260.7054 | -2.8054 | 11.870.07 | -19.200.11 | -29.080.09 | 3,200 | ||
| 21A | 5803547624984209792 | 266.1464 | -72.9932 | 11.430.05 | 14.440.06 | 17.530.08 | WD | (4) | |
| 21B | 5803547624984209664 | 266.1488 | -72.9932 | 11.360.10 | 16.450.11 | 14.490.15 | M5V | ||
| 22A | 2103614787618232192 | 284.3691 | 40.5932 | 15.000.03 | -23.460.05 | 41.470.05 | 17,500 | (1) | |
| 22B | 2103614787618232448 | 284.3697 | 40.5938 | KIC 5342558 | 15.120.05 | -26.090.09 | 42.790.09 | 3,100 | |
| 23A | 1768730586908531712 | 330.3371 | 15.0917 | 10.680.06 | -30.320.11 | -89.210.10 | 14,250 | (1) | |
| 23B | 1768730586908531840 | 330.3375 | 15.0928 | 10.630.04 | -30.560.07 | -88.050.06 | 3,500 | ||
| 24A | 2811484217573797248 | 347.3354 | 11.5747 | 14.330.20 | 23.920.35 | -62.610.25 | 7,000 | (1) | |
| 24B | 2811484217572663168 | 347.3361 | 11.5753 | 14.370.17 | 24.350.31 | -65.310.21 | 2,900 | ||
| 25A | 6393502099375879552 | 348.2538 | -64.3321 | 12.710.05 | 179.050.07 | 23.960.08 | WD | (4) | |
| 25B | 6393502099376815744 | 348.2521 | -64.3322 | 13.360.24 | 184.320.34 | 19.370.36 | M3-4V | ||
| 26A | 1999127510441929600 | 356.2808 | 58.2209 | 10.220.08 | 28.870.11 | 5.830.08 | 11,750 | (4) | |
| 26B | 1999127510436274048 | 356.2794 | 58.2205 | 10.540.39 | 29.840.61 | 5.690.42 | 2,800 |
In this paper we made use of the following photometric catalogues available at VOSA: GALEX (Bianchi & GALEX Team, 2000), Gaia DR2 (Gaia Collaboration et al., 2018), SDSS DR12 (Alam et al., 2015), Pan-STARRS DR1 (Chambers et al., 2016), the Dark Energy Survey (DES) (Dark Energy Survey Collaboration et al., 2016), 2MASS PSC (Skrutskie et al., 2006), VISTA (Cross et al., 2012), UKIDSS (Hewett et al., 2006), and WISE (Wright et al., 2010). Additionally, we made use of the Spitzer Enhanced Imaging Products (SEIP) catalogue (Wu et al., 2010), which is presently not included in VOSA. To avoid potential mismatches we used the Gaia proper motions to calculate the corresponding Gaia coordinates at the J2000 epoch, used by all other surveys considered333Ideally, for high proper motion objects one would require to work out the Gaia coordinates at the exact epoch of observations of the other different surveys. However, VOSA uses a search radius of 5”, which means a WD needs a proper motion higher than 330 mas/year to move more than 5” in 15 years (J2000 to J2015). Less than 1% of the 8,555 WDs within 100pc from Jiménez-Esteban et al. (2018) have such high proper motions. Therefore, not calculating the Gaia coordinates at the exact epoch of observations of the other surveys has a very low impact..
From the original list, we filtered out objects with less than three reliable IR (12,000Å) photometric points in their SEDs. Reliable photometry implies data not affected by contamination from nearby sources, artifacts or quality flag issues (Qflg U in the J and H bands for 2MASS; ccf=0 and qph=A/B in the W2 band for WISE; ppErrBits<256 for both VISTA and UKIDSS). This resulted in 3,733 selected Gaia WDs. In order to explore the possibility that our selected sample is representative of the overall WD population we compared the corresponding WD effective temperature and mass distributions (see Section 5 for details on how these parameters are derived) to those arising from the catalogue of Gaia DA WDs within 20 pc of Hollands et al. (2018b). This is not only a volume-limited and complete sample, but also all 20 pc WDs have available effective temperature and mass determinations. Kolmogorov-Smirnov (KS) tests yield probabilities of 10-5 (4.4; effective temperature) and 0.55 (0.6; mass) for our and the 20 pc Gaia samples to be drawn from the same parent population. If we exclude cool (6,000K) WDs from the 20 pc sample, the effective temperature KS probability increases to 0.16 (1.4). We thus conclude there are no strong indications for our sample not to be representative of the overall WD population, except at effective temperature values under 6,000 K. The lack of such cool WDs in our sample is not surprising since these are excluded by our imposed colour cut.
The observational SEDs of the 3,733 selected objects were compared to the hydrogen-rich WD collection of theoretical model atmosphere spectra of Koester (2010) (see Sect. 4.1 in Jiménez-Esteban et al. 2018 for a detailed description of the main characteristics of this grid of models) to identify IR excesses. To that end, VOSA first executes an iterative algorithm which is an extension of the method described in Lada et al. (2006). Starting at , VOSA computes the slope of the linear regression of the observational SED in a log vs. log diagram. This slope is recomputed by adding new infrared photometric points at every step. If, in any of these steps, the slope becomes significantly smaller () than the one expected from a stellar photospheric emission, VOSA flags the object as potentially affected by IR excess and photometric points at longer wavelengths are not taken into account in the SED fitting process for deriving the WD effective temperature and luminosity.
Once the SED fitting is completed, VOSA performs a further refinement of the IR excess estimation by comparing, for each photometric point, the observational flux to the synthetic flux obtained from the model that best fits the data. Significant ( 3) deviations in the observational flux are flagged by VOSA as potential IR excesses. A detailed description of how VOSA manages the infrared excess can be found in the VOSA documentation444https://bit.ly/2KRCv9x. After this process, VOSA identified 377 WD candidates to show IR-excess among our initial 3,733 objects.
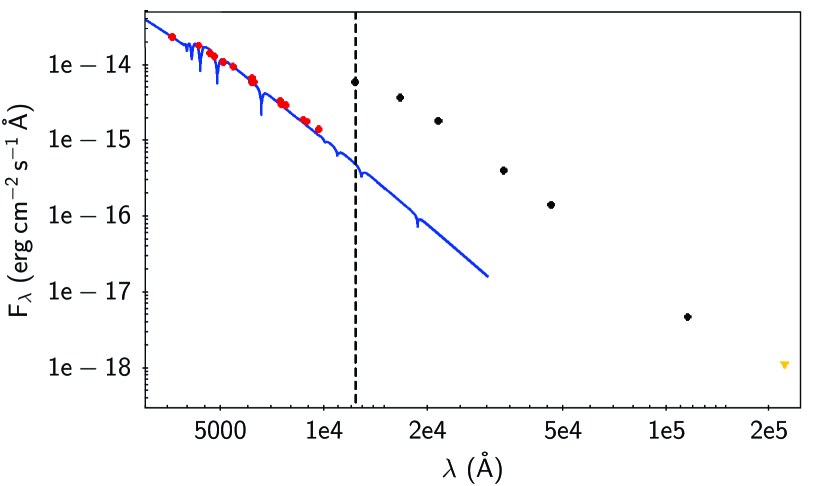
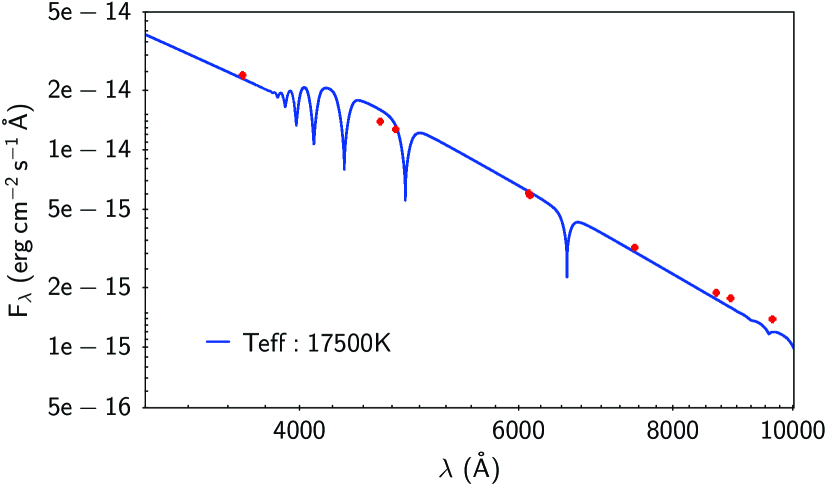
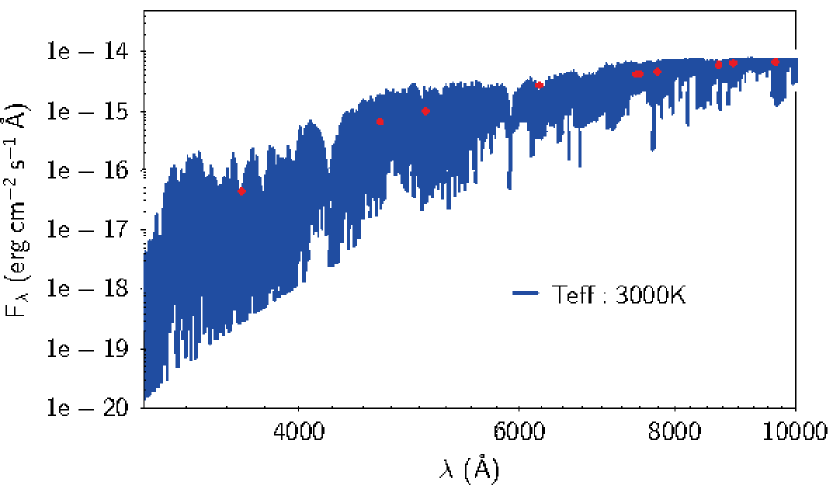
In a first step, we visually inspected the optical (Pan-STARRS1, SDSS and DSS) and IR (2MASS and WISE) images of the 377 sources using Aladin555http://aladin.u-strasbg.fr Bonnarel et al. (2000). The VOSA SED fittings were also checked. We removed a total of 221 sources (58%) from our target list mainly due to the WISE poor spatial resolution (6″ beam size), which causes a significant number of false positives due to contamination by nearby sources. This contamination rate is slightly lower to that found by other authors (75%, e.g. Barber et al., 2016). Of the remaining 156 objects, 38 were identified as co-moving systems by using Gaia parallaxes and proper motions, as well as photometry from surveys where the components of the systems appear spatially resolved. Most of these objects can be easily identified by the jump in their SEDs at IR (mainly WISE) wavelengths. This jump is caused by the sum of the fluxes of the nearby sources that form the system due to the WISE spatial resolution (see an example in Figure 1). 26 of the 38 co-moving pairs were identified as WD+M systems, most of them already reported by El-Badry & Rix (2018) (see Table 1). Effective temperatures were estimated using VOSA and the Koester (2010) and BT-Settl (Allard et al., 2012) models for the WD and the M star components, respectively. The other 12 systems are reported in Table 2.
Of the remaining 118 WDs, one has associated two entries in the Gaia DR2 catalogue separated by less than 2″ (Gaia IDs: 883243467325018496 / 883243467323599616). The differences in parallaxes and the SED analysis made with VOSA conclude that the secondary component causing the IR excess is, most likely, a background M giant. Similar cases are the sources 2612592841965015424, 2564424130905288192, 63846445499673472, 2969841487138850560, 5657351404992422784, 3650552739370519680 and 1316268323580640256, the latter studied by Barber et al. (2014) who confirmed the IR excess arises due to the contamination of a background object.
From the final list of 110 selected WD candidates, 77 benefit from IR photometry at both near and mid IR wavelengths and 33 just at mid IR wavelengths. Tables 3-4 list the 77 WD selected candidates with available near and mid IR photometry, 52 of which are new discoveries not yet known to host disks, brown dwarf or low-mass companions. The effective temperatures and radii (derived from the Stefan-Boltzmann equation) associated to the IR contribution’s sources are estimated from the composite SED fitting. For this, VOSA uses a range of values around the white dwarf and obtained from the single best fit using the Koester (2010) models together with a blackbody with 5,000 K. For WDs, the errors in effective temperatures arising from the composite SED fitting are given by the step of the grid of models, which changes with . The step in the grid of blackbody models is set to 25 K.
Table 5 summarizes the information of the 33 targets having only IR photometry at mid IR wavelengths. The SEDs of these IR-excess candidates are poorly populated and hence it is difficult to asses whether or not the detected excesses are real. Another important issue of only having at hand mid IR photometry is that it is hard to asses if the excesses arise from a dust disk or a companion. It is worth noting that for one of them (Gaia ID 128198912443928691) the IR excess has been confirmed to arise due to a circumbinary disk (Farihi et al., 2008b). However, to avoid including a large number of potential false positive detections in our list, these WDs will not be considered further in this work.
More information about the final 77 selected candidates for displaying IR excess with available photometry at both near and mid IR walelengths, including a visualization of their SED fitting, can be found at the SVO archive of WDs with IR excess from Gaia DR2666http://svo2.cab.inta-csic.es/vocats/v2/wdw3.
| Identifier | Source | Comment |
|---|---|---|
| eps Ret | Farihi et al. (2011) | (1) |
| eps Ret B | ||
| eps Ret b | ||
| PM J04032+2520 | Limoges et al. (2015) | (2) |
| PM J04032+2520E | ||
| 2MASS J04031652+2520192 | ||
| EGGR 576 | Gianninas et al. (2011) | WD+WD |
| EGGR 577 | ||
| LP 402-28 | Simbad | WD+WD |
| LP 402-29 | ||
| SDSS J230249.37+243027.9 | Simbad | (3) |
| SDSS J230250.37+243013.3 | ||
| L 462-56A | Simbad | WD+WD |
| L 462-56B | ||
| Gaia 2751252493861856000 | El-Badry & Rix (2018) | WD+WD (4) |
| Gaia 2751252489566343680 | ||
| Gaia 3404213863611804672 | El-Badry & Rix (2018) | WD+WD (4) |
| Gaia 3404213863614488192 | ||
| Gaia 4209104513139995136 | this work | WD+WD (5) |
| Gaia 4209104577563403136 | ||
| Gaia 4659809928696442368 | this work | WD+WD (5) |
| Gaia 4659809928696442496 | ||
| Gaia 4964509614631078400 | El-Badry & Rix (2018) | WD+WD (5) |
| Gaia 4964509614631078272 | ||
| Gaia 5184384997855024384 | this work | WD+WD (5,6) |
| Gaia 5184385002150373632 |
-
(1): Binary system formed by a red giant (K2 III) with a confirmed extra-solar planet and a white dwarf (DA3).
-
(2) Triple system formed by two white dwarfs and a M-dwarf.
-
(3) WD+high proper motion object.
-
(4): Both components included in Jiménez-Esteban et al. (2018).
-
(5): First component included in Jiménez-Esteban et al. (2018). WD nature of the second component derived from its position in a MG vs - diagram.
-
(6): With a - = 0.92, the second component is one of the coolest WDs in our sample.
| Gaia ID | RA | DEC | Name | R | logg | Mass | Ref. | Type | Type | ||
|---|---|---|---|---|---|---|---|---|---|---|---|
| (ICRS) | (ICRS) | (WD) | (bb) | (bb) | (WD) | (WD) | |||||
| DR2 | deg | deg | K | K | R⊙ | dex | M⊙ | SED | other | ||
| 2416481783371550976 | 1.8951 | -16.0921 | EGGR 509 | 12000 | 2450 | 0.07 | 7.84 | 0.52 | comp. | disk | |
| 2798132572998105984 | 1.9484 | 19.8568 | 12250125 | 2500 | 0.02 | 7.75 | 0.48 | comp. | ? | ||
| 367949367212923392 | 12.3001 | 38.6918 | LAMOST J004912.04+384129.8 | 9500125 | 850 | 0.23 | 7.76 | 0.48 | ? | ||
| 2529337507976700928 | 12.6909 | -3.4487 | 20000310 | 1050 | 0.10 | 8.92 | 1.20 | disk | |||
| 5026963661794939520 | 17.1503 | -32.6288 | HE 0106-3253 | 15750125 | 1900 | 0.06 | 7.97 | 0.60 | (Fa10) | disk | disk |
| 2354670057156360576 | 17.3882 | -19.0215 | 14250125 | 550 | 0.48 | 7.93 | 0.57 | (De17) | ? | ||
| 4913589203924379776 | 18.0888 | -56.2411 | JL 234 | 18250125 | 950 | 0.18 | 7.89 | 0.56 | (Gi12) | disk | disk |
| 2593884960855727872 | 21.2525 | 18.1945 | 8750125 | 1700 | 0.05 | 8.32 | 0.79 | disk | disk | ||
| 2588874825669925504 | 23.8868 | 14.7649 | LSPM J0135+1445 | 8250125 | 2450 | 0.06 | 7.50 | 0.37 | (St13) | comp. | BD/comp. |
| 5135466183642594304 | 26.8412 | -21.9477 | GD 1400 | 12000125 | 2500 | 0.06 | 8.11 | 0.67 | (Fa04) | comp. | BD |
| 291057843317534464(*) | 26.9784 | 23.6617 | WD 0145+234 | 12500125 | - | - | 7.99 | 0.60 | disk | disk | |
| 95297185335797120 | 27.2377 | 19.0405 | Wolf 88 | 13250125 | 2200 | 0.06 | 8.29 | 0.78 | (Fa09) | disk | disk |
| 4632284754595134080 | 31.3539 | -79.6844 | 9500125 | 800 | 0.14 | 8.09 | 0.65 | disk | disk | ||
| 2489533370280291584 | 35.8356 | -4.9852 | 10250125 | 600 | 0.45 | 8.05 | 0.63 | disk | |||
| 2489275328645218560 | 38.5646 | -4.1026 | 13500125 | 900 | 0.16 | 8.12 | 0.67 | disk | disk | ||
| 5187830356195791488 | 45.7209 | -1.1429 | GD 40 | 14500125 | 950 | 0.16 | 8.16 | 0.70 | (Ju07) | disk | disk |
| 139331247344776832 | 47.0822 | 36.4914 | 7500125 | 1650 | 0.01 | 7.94 | 0.56 | ? | |||
| 4833891614684676736 | 52.3630 | -47.6435 | 9750125 | 1450 | 0.06 | 7.84 | 0.52 | disk | disk | ||
| 542865797290276352 | 54.1894 | 70.7364 | 10500125 | 2800 | 0.03 | 7.99 | 0.60 | ? | |||
| 3251748915515143296 | 62.7590 | -3.9735 | GD 56 | 14500125 | 950 | 0.45 | 8.00 | 0.61 | (Ju07) | disk | disk |
| 4837423353408638080 | 63.2121 | -45.1696 | 14000125 | 1350 | 0.08 | 8.02 | 0.62 | disk | disk | ||
| 4653404070862114176 | 64.9077 | -73.0623 | [DI91] 1592 | 18250125 | 1350 | 0.02 | 7.92 | 0.58 | (Ho13) | disk | |
| 271992414775824640 | 66.0653 | 52.1696 | KPD 0420+5203 | 15250125 | 1100 | 0.18 | 8.09 | 0.67 | (Ba16) | disk | disk |
| 152740654933891072 | 68.4777 | 28.4579 | PM J04339+2827 | 14000125 | 1850 | 0.02 | 7.92 | 0.57 | (Xu15) | comp. | BD |
| 203931163247581184 | 69.6641 | 41.1585 | GD 61 | 14250125 | 1350 | 0.001 | 8.08 | 0.66 | (Fa 11) | disk | disk |
| 2986304298645920384 | 75.3165 | -15.1900 | 11250125 | 2350 | 0.05 | 7.83 | 0.51 | ? | |||
| 3415788525598117248 | 77.5087 | 23.2613 | LAMOST J051002.11+231541.0 | 17250125 | 1200 | 0.13 | 8.11 | 0.68 | disk | disk | |
| 4799224635833122304 | 82.7521 | -45.9670 | 10750125 | 850 | 0.13 | 8.02 | 0.61 | disk | |||
| 4795556287084999552 | 84.4726 | -47.9681 | EC 05365-4759 | 18250125 | 450 | 1.40 | 7.87 | 0.55 | (De16) | disk | disk |
| 3329569015639064192(*) | 90.6529 | 9.07322 | LSPM J0602+0904 | 6000125 | - | - | 7.50 | 0.35 | disk | ?/comp. | |
| 962995581174346112 | 90.7863 | 45.3077 | 14750125 | 1950 | 0.04 | 7.95 | 0.58 | disk | disk | ||
| 3112786176370258688 | 105.6910 | 0.0552 | 11750125 | 750 | 0.14 | 8.03 | 0.62 | disk | disk | ||
| 5490140356700680576 | 108.6243 | -55.6572 | 9000125 | 2700 | 0.07 | 7.64 | 0.43 | comp. | BD/comp. | ||
| 872009447786700672(*) | 112.5000 | 27.2781 | LSPM J0730+2716W | 9250125 | - | - | 7.98 | 0.59 | disk | disk | |
| 5292685793681027968 | 113.6708 | -60.1979 | 9250125 | 800 | 0.12 | 8.24 | 0.74 | disk | disk | ||
| 1081504483467714176 | 120.6156 | 56.5321 | 10750125 | 950 | 0.16 | 8.06 | 0.64 | disk | disk | ||
| 585513959248023936 | 141.1386 | 5.3519 | 6000125 | 950 | 0.09 | 8.18 | 0.70 | disk | |||
| 5662556012001458944 | 141.2082 | -24.38456 | 0.23 | 8500125 | 700 | 0.24 | 7.96 | 0.57 | disk | disk | |
| 5740372469987778304 | 143.4221 | -10.0026 | 8000125 | 1450 | 0.06 | 8.56 | 0.95 | ? | |||
| 5459131788043369344 | 154.3688 | -32.6025 | 8000125 | 1300 | 0.05 | 7.93 | 0.56 | disk | disk | ||
| 3888723386196630784 | 154.5154 | 15.8660 | PG 1015+161 | 21000500 | 1600 | 0.01 | 7.98 | 0.61 | (Ju07) | disk | disk |
| 3810933247769901696 | 169.8012 | 2.3426 | GD 133 | 12250125 | 900 | 0.17 | 8.01 | 0.61 | (Ho13) | disk | disk |
| 771517005584473600 | 171.424 | 42.3930 | GD 308 | 9500125 | 1400 | 0.06 | 8.14 | 0.68 | (De11) | disk | disk |
| 3571559292842744960 | 178.3134 | -15.6104 | EC 11507-1519 | 11000125 | 750 | 0.53 | 7.90 | 0.55 | (Ho13) | disk | disk |
| 3543074313820703488 | 178.5127 | -19.2376 | 7250125 | 750 | 0.28 | 7.77 | 0.48 | disk | |||
| 3479615106870788864(*) | 178.5145 | -31.0292 | 6250125 | - | - | 8.17 | 0.69 | disk | disk | ||
| 4028120776036373760 | 180.4780 | 34.0154 | SDSS J120154.70+340055.9 | 6000125 | 1300 | 0.06 | 8.14 | 0.67 | ? | ||
| 1692520339315508224 | 184.2221 | 74.9237 | 6500125 | 1250 | 0.05 | 8.00 | 0.59 | disk | disk | ||
| 3903151246497510784 | 190.1509 | 9.5361 | 6750125 | 750 | 0.14 | 8.45 | 0.87 | disk | |||
| 3663900436870097664 | 208.7495 | 1.1387 | SDSS J135459.89+010819.3 | 11500125 | 750 | 0.20 | 7.88 | 0.54 | disk | disk | |
| 1494157691363079168(*) | 217.1406 | 44.0630 | 7500125 | - | - | 8.36 | 0.81 | (De11) | disk | disk | |
| 1488904946359359488 | 222.5277 | 40.9264 | CBS204 | 13500125 | 800 | 0.21 | 7.88 | 0.54 | ? | ||
| 1183473535423719296 | 227.4253 | 14.1892 | 6250125 | 1250 | 0.04 | 8.15 | 0.67 | disk | disk | ||
| 6315417253178248960 | 229.6198 | -11.8109 | 10250125 | 700 | 0.23 | 7.86 | 0.52 | disk |
| Gaia ID | RA | DEC | Name | R | logg | Mass | Ref. | Type | Type | ||
|---|---|---|---|---|---|---|---|---|---|---|---|
| (ICRS) | (ICRS) | (WD) | (bb) | (bb) | (WD) | (WD) | |||||
| DR2 | deg | deg | K | K | R⊙ | dex | M⊙ | SED | other | ||
| 1641326979142898048 | 235.4372 | 64.8978 | V* KX Dra | 11000125 | 850 | 0.27 | 7.90 | 0.55 | (Ki12) | disk | disk |
| 1429618420396285952 | 243.3191 | 55.3572 | SBSS 1612+554 | 11250125 | 950 | 0.16 | 8.06 | 0.64 | disk | disk | |
| 4390134326651497728 | 260.957 | 4.9799 | PM J17238+0458 | 8500125 | 550 | 0.35 | 7.94 | 0.56 | disk | disk | |
| 1368236912466084352(*) | 265.7298 | 51.6024 | SDSS J174255.14+513608.4 | 8750125 | - | - | 7.95 | 0.57 | disk | disk | |
| 4583221109793391232(*) | 271.6897 | 27.5299 | 6500125 | - | - | 8.09 | 0.64 | disk | disk | ||
| 6417955993895552128 | 273.5734 | -73.9174 | 7750125 | 700 | 0.80 | 8.06 | 0.63 | disk | ? | ||
| 2155960371551164416 | 285.8315 | 60.5980 | GD532 | 10750125 | 850 | 0.23 | 8.04 | 0.63 | disk | ||
| 6429048245152936320 | 305.0718 | -65.4240 | 6500125 | 1900 | 0.05 | 8.25 | 0.74 | comp. | ? | ||
| 1837948790953103232 | 315.1447 | 21.3826 | 15250125 | 1000 | 0.44 | 7.91 | 0.59 | disk | ? | ||
| 6462911897617050240 | 319.9055 | -55.8382 | LAWD 84 | 9500125 | 650 | 0.10 | 8.02 | 0.61 | (Fa09) | disk | disk |
| 6580498481454705408 | 320.3473 | -42.1484 | 7500125 | 600 | 0.26 | 8.32 | 0.79 | disk | |||
| 6811977801160882944 | 328.3816 | -26.4821 | 14750125 | 700 | 0.23 | 9.09 | 1.31 | disk | |||
| 2677851743291189888 | 335.1279 | -0.6854 | PHL 5038 | 7500125 | 1050 | 0.12 | 7.87 | 0.53 | (De11) | disk | disk |
| 2595728287804350720 | 336.0726 | -16.2631 | PHL 5103 | 10000125 | 1450 | 0.04 | 8.12 | 0.67 | (Ro15) | disk | disk |
| 1900545847646195840 | 337.4920 | 30.4028 | PM J22299+3024 | 10500125 | 2550 | 0.08 | 7.41 | 0.35 | comp. | disk/comp. | |
| 2622979271185741312 | 338.3480 | -6.0278 | 8250125 | 850 | 0.31 | 8.07 | 0.63 | disk | |||
| 6594180460552162944 | 338.477 | -38.5436 | LP 1033-28 | 8500125 | 1000 | 0.07 | 8.05 | 0.62 | disk | disk | |
| 2712240064671438720 | 344.3588 | 7.9285 | G28-27 | 13750125 | 950 | 0.07 | 9.36 | 1.44 | (De11) | disk | |
| 1995097319287822080 | 346.3820 | 51.4227 | 12750125 | 1800 | 0.04 | 7.93 | 0.57 | disk | disk | ||
| 6499095244738784128 | 349.0564 | -55.4912 | 10250125 | 950 | 0.10 | 8.35 | 0.81 | disk | disk | ||
| 2660358032257156736 | 352.1975 | 5.2478 | V* ZZ Psc | 10750125 | 950 | 0.19 | 7.90 | 0.55 | (Re05) | disk | disk |
| 1923682286712356992 | 352.9001 | 41.0248 | EGGR 160 | 14500125 | 700 | 0.36 | 7.94 | 0.58 | (Ho13) | disk | disk |
| 6538863343364422528 | 355.1527 | -37.1458 | EC 23379-3725 | 12250125 | 700 | 0.41 | 7.74 | 0.48 | disk | disk |
-
Comments:
(*) Marginal IR excess. No reliable values of blackbody effective temperature and radius.
-
References:
(Fa10): Farihi et al. (2010), (Gi12): Girven et al. (2012), (St13): Steele et al. (2013) (Fa04): Farihi & Christopher (2004) (Fa09): Farihi et al. (2009), (Ju07): Jura et al. (2007), (Ho13): Hoard et al. (2013), (Ba16): Barber et al. (2016), (Xu15): Xu et al. (2015) (Fa11): Farihi et al. (2011), (De16): Dennihy et al. (2016), (Fa08): Farihi et al. (2008a), (Ki12) Kilic et al. (2012), (De11): Debes et al. (2011), (De17): Dennihy et al. (2017) (Re05): Reach et al. (2005). (Ro15): Rocchetto et al. (2015).
| Gaia ID | RA | DEC | Name |
|---|---|---|---|
| (ICRS) | (ICRS) | ||
| DR2 | deg | deg | |
| 2741440172922171008 | 4.2305 | 5.0786 | SDSS J001655.37+050442.1 |
| 2858896086675180928 | 7.2235 | 30.0918 | |
| 2344098385998773120 | 11.3746 | -25.0516 | |
| 377520826387065856 | 13.0183 | 45.0927 | |
| 306805388153226368 | 16.7916 | 27.1691 | |
| 306350606950880128 | 16.8592 | 25.3099 | |
| 2790417540424293120 | 16.9558 | 21.1294 | SDSS J010749.34+210745.2 |
| 5161531373793965440 | 49.6922 | -13.0005 | |
| 568168544844912128 | 57.0280 | 80.8102 | |
| 4887631143142117632 | 57.4624 | -30.5289 | |
| 498487545190443136 | 89.8444 | 72.9873 | |
| 992771180686912000 | 98.8498 | 52.2593 | |
| 921804126089222784 | 122.9556 | 42.2025 | KUV 08084+4221 |
| 1118374024628715264 | 129.4702 | 69.2181 | |
| 10519544856996652801 | 152.5329 | 61.9211 | |
| 738060065046666240 | 163.0523 | 33.3884 | |
| 789712823515276416 | 169.3462 | 48.8665 | |
| 3705386281897262848 | 193.0632 | 4.1786 | HS 1249+0426 |
| 3938156295111047680 | 196.4251 | 18.0179 | V* GP Com |
| 12819891244392869122 | 224.5277 | 29.6223 | EGGR 298 |
| 1157317008497672320 | 227.7374 | 6.4638 | SDSS J151056.99+062749.7 |
| 1219699145026398848 | 237.2293 | 24.8536 | SDSS J154855.04+245112.9 |
| 13166078965781578243 | 240.4179 | 27.5969 | LSPM J1601+2735 |
| 11996861736778165761 | 242.1648 | 17.3935 | |
| 1428562506980546688 | 244.1432 | 54.1698 | |
| 4555079659441944960 | 262.1905 | 20.8949 | |
| 6845706900891884928 | 303.9679 | -28.5888 | |
| 6886271973655421824 | 312.8046 | -15.3495 | |
| 6809396800693752576 | 314.4396 | -20.0568 | |
| 6884996230921934976 | 316.6775 | -14.7588 | |
| 2284456545980836736 | 319.6924 | 76.9831 | |
| 1946495125767488896 | 326.3801 | 32.8618 | |
| 2199338643594260352 | 329.6359 | 58.0752 | Lan 432 |
3 Methodology assessment
The efficiency of our methodology was assessed using the false negative rate, i.e. the fraction of known IR-excess WDs that were not rediscovered in our search. In particular, we compiled a list of 24 WDs at less than 100 pc and with IR excess confirmed by Spitzer. 20 objects (83%) were identified using our methodology and are included in Tables 3-5. The remaining four objects were not identified due to the following two reasons:
(1) Contamination of the WISE photometry due to the presence of a nearby source (WD1929+011 and WD0950-572). It is worth noting that these two objects are not included in the SEIP Spitzer catalogue, otherwise VOSA would have very likely detected the IR excess.
(2) Unreliable WISE photometry in W3 and W4 bands (WD2132+096 and WD2328+107). These targets are not included in the SEIP Spitzer catalogue neither, hence VOSA could not detect the IR excess.
These results confirm the robustness of our methodology (a success rate of 83%) to identify WDs with IR excess. We therefore assume our IR-excess sample to be 83% complete. It is also important to note that if we take into account that the four objects that we could not recover were identified from publicly unavailable Spitzer data (i.e. data not included in the SEIP catalogue), then the success rate of our method would increase to 100%.
Assuming an IR-excess completeness of 83% for our sample does not imply that we have discovered 83% of all WDs displaying IR excess within 100 pc from the Sun. First, we are basing our methodology assessment on confirmed WDs with IR excess by Spitzer, therefore there may exist WDs without Spitzer data and displaying IR excess that we are not taking into account and that are consequently missed by this and all previous studies. Second, and more important, we are only considering 3,733 objects with reliable IR photometry and with colours below 0.8 mag within our Gaia 100 pc sample.
4 Characterization of the sample
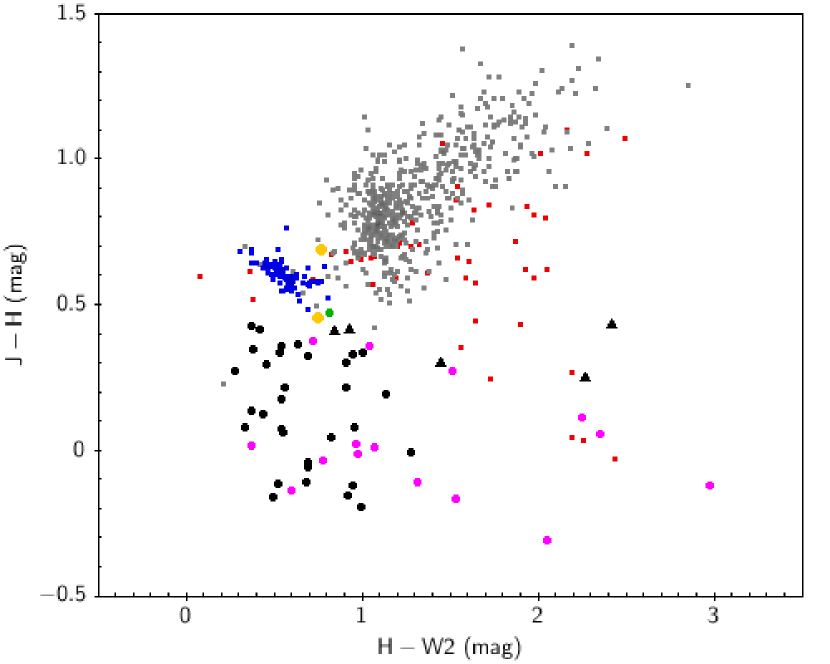
It is widely accepted that there are three main possibilities to explain the IR excess detections in WDs such as those listed in Tables 3-4: the presence of a brown dwarf companion, the presence of low-mass stellar companion and the existence of a circumstellar dust disk. To discern the origin of the IR excess we follow two different approaches, namely the use of a colour-colour diagram and the visual inspection of the SEDs. The classification of IR-excess origin based on these two methods are provided in the last and second-last columns of Tables 3-4, respectively.
We use the colour-colour diagram proposed by Barber et al. (2014). Fig.2 compares the IR colours of the 54 WDs with excess included in Tables 3-4 and with good 2MASS (Qflg U in the J and H bands) and WISE (ccf=0 and qph=A/B in the W2 band) photometry to those of M, L, T dwarf stars and brown dwarfs. 15 objects (pink bullets in Figure 2) have been classified as dusty WDs in the literature, while for one object (green bullet) the IR excess has been ascribed to the presence of a BD companion. 31 objects (black bullets) are located well apart from the stellar/brown dwarf loci, and we hence classify them as dusty WDs based on their IR colours. Two objects (yellow bullets) lie either near the brown dwarf locus or near a confirmed WD+BD binary as we thus classify them as WD+BD candidates. For one of these objects (Gaia ID: 152740654933891072) the morphology flag of the UKIDSS catalogue indicates the possibility that this source was extended at more than one bandpass, which is an additional evidence supporting the hypothesis that the IR excess is due to nearby brown dwarf. The remaining five (black triangles) lie in colour regions expected for T brown dwarfs where also confirmed dusty WDs are located, therefore it becomes difficult to asses the origin of the IR excess in these objects. We explored their quality flags associated to the Gaia astrometry. Following the latest recommendations published by the Gaia ESA team in the Known issues with the Gaia DR2 data web page777 https://www.cosmos.esa.int/web/gaia/dr2-known-issues, we defined sources with good astrometry as those having the re-normalised unit weight error (RUWE) 1.4. Sources having a higher value of RUWE may have a worse astrometric solution due to different effects, one of those being the presence of a close companion. However, we got a value of RUWE1.4 for the five objects, which prevented us from discriminating between a disk or brown dwarf/low-mass star origin of their IR excesses.
In order to further explore the origin of the IR excesses we visually inspected the SEDs of the 77 candidates. Eight of them benefit only from J 2MASS and WISE photometry, hence we do not have enough information at hand to reach a conclusion. In these cases we flag the origin of the excess as unknown (? in the second last column of Tables 3-4). For eight additional objects the IR excesses arise at the J and/or H bands, which supports the idea of these WDs being in binary systems with either low-mass stars or brown dwarf companions. Two objects (Gaia IDs 2588874825669925504 and 5135466183642594304) are in fact confirmed, and one more (152740654933891072) is a candidate to harbour a brown dwarf based on its IR colours (Fig. 2). These objects are flagged to harbour companions in the second-last column of Tables 3-4 and we include the brown dwarf classification of the three discussed targets in the last column of the same tables. The SEDs of 61 WDs display IR excess at K-band or longer wavelengths, characteristic features of circumstellar disk candidates. These objects are hence flagged as such in the second-last column of Tables 3-4.
5 Discussion
We have identified 77 IR-excess WD candidates within the 100 pc Gaia WD catalogue, 52 of which have not been published before (see Tables 3–4). The WD effective temperatures are derived fitting the photometric SED of each WD using VOSA (Section 2), which together with the bolometric luminosities (also provided by VOSA by making use of the Gaia parallaxes) yield the radii of the WDs from the Stefan-Boltzmann equation. The WD masses are estimated interpolating the radii and effective temperatures obtained in this way in the WD cooling tracks for hydrogen-rich, DA, atmospheres of Renedo et al. (2010), following our procedure described in Jiménez-Esteban et al. (2018). Given that Gaia DR2 does not provide stellar spectra, the reliability of the determined masses relies on the assumption that all our WDs are DAs. As we showed in Jiménez-Esteban et al. (2018), the contribution of DB (helium-rich) WDs to the sample of WDs with determined stellar parameters should be no higher than 6%. The average uncertainties that are introduced when assuming DA models when deriving the effective temperatures and masses of DB WDs are 17001680 K and 0.080.06M⊙, respectively, where the errors are the standard deviations. These values are obtained comparing the stellar parameters calculated by Jiménez-Esteban et al. (2018) for 152 common SDSS DB WDs in the spectroscopic catalogue of Koester & Kepler (2015) with relative error below 10% in effective temperature and surface gravity errors below 0.05 dex.
Four WDs have determined masses under 0.45 M⊙, which indicates these objects are likely members of close binaries with sub-stellar or low-mass companions (from which the IR excess likely arises) that formed through common envelope evolution. Another possibility is that these are non-DA WDs, in which case the masses cannot be considered as reliable. The four potentially low-mass WDs have the following Gaia IDs: 2588874825669925504 (LSPM J0135+1445), 3329569015639064192 (LSPM J0602+0904), 5490140356700680576, 1900545847646195840 (PM J22299+3024). LSPM J0135+1445 is a confirmed WD+BD binary (Steele et al., 2013). 3329569015639064192 is classified as a disk candidate based on its SED, which supports the idea of this WD being of a non-DA spectral class. 5490140356700680576 is classified as a companion and brown dwarf by its SED and IR colours, respectively, which strongly indicates this WD is indeed part of a close binary. Finally, the SED and IR colours of 1900545847646195840 indicate a companion and disk origin, respectively, and therefore more information is required (e.g. IR spectroscopy) to confirm this WD is in a close binary system.
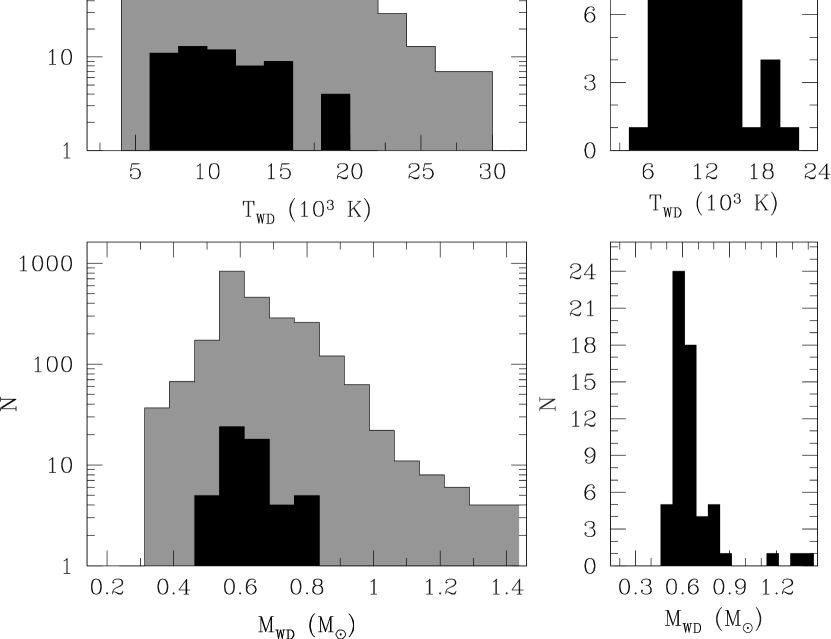
The effective temperature and mass distributions for the 60 WDs in which the IR excess is confirmed/expected to arise from the presence of a circumstellar dust disk (indicated in bold face in the last two columns of Tables 3-4) are illustrated in Fig. 3. Inspection of the Figure reveals the effective temperatures are concentrated between 6,000-20,000 K, with a peak at 9,000 K. No WDs are found below 6,000 K due to the 0.8 mag cut we imposed in Section 2. The drop of IR-excess WD candidates above 20,000 K is in line with previous studies (e.g. Bergfors et al., 2014; Barber et al., 2014, 2016). The physical mechanism causing this could be that the accretion of the material onto the WD is supplied by a pure gas disc, which results from the sublimation of optically thin dust due to the high effective temperatures (Bonsor et al., 2017). A drop in the fraction of IR-excess WDs below 8,000–10,000,K is also reported in previous works (e.g. Bergfors et al., 2014), a result that favours a positive correlation between the WD effective temperature and the detection of IR-excess. In the top-left panel of Fig. 3 one can clearly see the same tendency, i.e. the fraction of cool (8,000–10,000 K) WDs displaying IR excess decreases. However, since the Gaia 100pc WD sample is volume-limited and hence dominated by WDs cooler than 10,000 K (Jiménez-Esteban et al., 2018), the peak of the effective temperature distribution occurs at 9,000 K rather than at higher temperatures (see the top-right panel of Figure 3).
The mass distribution of the WD candidates for displaying IR excess due to a circumstellar dust disk is clearly dominated by 0.6 M⊙ objects. Indeed, 50% of the objects have masses between 0.55 and 0.65 M⊙. It is worth mentioning that three WDs have masses above 1M⊙, one of them near the Chandrasekhar mass limit. The masses of these WDs should be taken with caution since there exists the possibility these are non-DAs. WDs more massive than 0.8 M⊙ are not generally found to display IR excess (Mullally et al., 2007; Barber et al., 2016). This is also observed in our mass distribution, where only 5% of the objects are located in the 0.8–1.0 mass range.
Based on the 60 confirmed/expected dusty WDs in Tables 3-4, we calculate a fraction of IR-excess WDs due to the existence of a circumstellar dust disk of 1.60.2% 888The error is calculated as , where Ntot is the total number of WDs and frac is the IR-excess fraction of WDs.. As we have already mentioned, the detection of IR-excess seems to be positively correlated with the WD effective temperature. Thus, if we exclude all WDs with effective temperatures below 8,000 K from our sample, the fraction of IR-excess WDs increases to 2.30.3%, as expected. For completeness, we provide the fractions at different effective temperature bins in Table 6, where one can see the values gradually decrease as soon as we move towards cooler effective temperatures. The fractions we derived are in excellent agreement with the 1–5% measured percentages by other studies (Debes et al., 2011; Barber et al., 2016; Bonsor et al., 2017; Wilson et al., 2019). It has to be emphasised however that these values should be considered as lower limits, since many WDs in our sample with reliable IR photometry have no counterparts at near IR wavelengths (we remind the reader that all our candidates have reliable IR photometry at both near and mid IR wavelengths). Of the 3,733 WDs in our analysed sample, 2802 have near and mid IR counterparts. This implies a revised overall WD IR-excess fraction of 2.10.3%. Moreover, if we take into account that we assumed our IR-excess sample to be 83% complete (Section 3), this implies a completeness-corrected fraction of 2.60.3%.
| Teff range (K) | fraction (%) | error (%) |
|---|---|---|
| 6,000-8,000 | 0.8 | 0.2 |
| 8,000-10,000 | 1.8 | 0.5 |
| 10,000-12,000 | 2.8 | 0.8 |
| 12,000-14,000 | 2.9 | 1.0 |
| 14,000-16,000 | 4.0 | 1.3 |
| 16,000-18,000 | 0.7 | 0.7 |
| 18,000-20,000 | 4.5 | 2.2 |
| 20,000-22,000 | 2.0 | 2.0 |
Our sample of 77 IR-excess WD candidates contains two confirmed WD+BD binaries (LSPM J0135+1445 and GD 1400) and two more that are also likely to harbour brown dwarf companions: PM J04339+2827 (Gaia ID54901403567006805) and 549014035670068057 (yellow dots in Fig. 2). We thus derive a fraction of IR-excess WDs due to brown dwarf companions of 0.100.05%. If we assume that the IR excess of all WDs expected to harbour companions in Tables 3-4 is due to a brown dwarf rather than due to a low-mass star, the percentage increases to 0.200.05%, or 0.230.05% if we take into account the incompleteness of our sample. Our results are in agreement with the expected value of 0.5% claimed by Farihi et al. (2005).
Finally, it is worth mentioning that all IR-excess WD candidates found in this study are classified to be members of the Galactic thin disk, according to the Random Forest identification algorithm we presented in Torres et al. (2019). The proportion of WDs within the Gaia 100 pc sample belonging to the thin/thick disk within the colour limits considered (<0.8 mag) is expected to be 96.5:3.5 (Torres et al., 2019), which translates into an expected number of 74 thin disk and 3 thick disk IR-excess WDs among our 77 identified objects. Thus, the expected number of thick disk WDs is at odds with the observed value. Given that thick disk WDs are generally old (9 Gyr), and taking into account that the fraction of IR-excess WDs drops for cooler (hence generally older) objects, the discrepancy between the expected and the observed number of thin/thick disk IR-excess WDs seems to be naturally explained.
6 Conclusions
We have analysed the SEDs of 3,733 WDs within 100pc from the Gaia volume-limited sample of Jiménez-Esteban et al. (2018) with reliable IR photometry and with colours below 0.8 mag with the aim of detecting IR excess candidates. The search has resulted in 77 identifications, 52 of which are new. 33 additional WDs have been also identified as potential IR-excess candidates. However, the fact that no near IR photometry is available in these cases makes the reliability of the dectections less certain. We have provided the largest volume-limited sample of IR excess WD candidates to date, which represents a fraction of 2.60.3% of the sample analysed in this work. Having this large number of WD candidates for harbouring a circumstellar disk at hand opens up the possibility to considerably increase our understanding of the properties of extreme planetary systems. A similar exercise to the one performed in this work but for the entire Gaia sample of WDs is encouraging. Even though the Gaia WD catalogue icluding WDs at all distances is magnitude- rather than volume-limited, such an analysis would result in the identification of many additional WDs displaying IR-excess, important for future follow-up studies.
Acknowledgements
This work has made use of data from the European Space Agency (ESA) mission Gaia (https://www.cosmos.esa.int/gaia), processed by the Gaia Data Processing and Analysis Consortium (DPAC, https://www.cosmos.esa.int/web/gaia/dpac/consortium). Funding for the DPAC has been provided by national institutions, in particular the institutions participating in the Gaia Multilateral Agreement. This publication makes use of VOSA, developed under the Spanish Virtual Observatory project supported from the Spanish MINECO through grant AyA2017-84089. This research has made use of the SIMBAD database, operated at CDS, Strasbourg, France. We acknowledge use of the ADS bibliographic services. This research has made use of "Aladin sky atlas" developed at CDS, Strasbourg Observatory, France. This research has made use of Topcat (Taylor, 2005). ARM acknowledges support from the MINECO under the Ramón y Cajal programme (RYC-2016-20254). ARM and ST acknowledge support from the AYA2017-86274-P grant and the AGAUR grant SGR-661/2017. F.J.E. acknowledges financial support from the Spacetec-CM project (S2013/ICE-2822), and from ASTERICS project (ID:653477, H2020-EU.1.4.1.1. - Developing new world-class research infrastructures). We thank the anonymous referee for her/his suggestions and comments.
Appendix A Online catalogue service
In order to help the astronomical community on using the catalogue of WDs with infrared excess identified in this work, we have developed an archive system that can be accessed from a webpage999http://svo2.cab.inta-csic.es/vocats/v2/wdw3 or through a Virtual Observatory ConeSearch101010e.g. http://svo2.cab.inta-csic.es/vocats/v2/wdw3/cs.php?RA=1.895&DEC=-16.092&SR=0.1&VERB=2.
The archive system implements a very simple search interface that permits queries by coordinates and range of effective temperatures, surface gravities and masses. The user can also select the maximum number of sources to return (with values from 10 to unlimited).
The result of the query is a HTML table with all the sources found in the archive fulfilling the search criteria. The result can also be downloaded as a VOTable or a CSV file. Detailed information on the output fields can be obtained placing the mouse over the question mark (“?") located close to the name of the column. The archive also implements the SAMP111111http://www.ivoa.net/documents/SAMP/ (Simple Application Messaging) Virtual Observatory protocol. SAMP allows Virtual Observatory applications to communicate with each other in a seamless and transparent manner for the user. This way, the results of a query can be easily transferred to other VO applications, such as, for instance, Topcat.
References
- Alam et al. (2015) Alam S., et al., 2015, ApJS, 219, 12
- Allard et al. (2012) Allard F., Homeier D., Freytag B., 2012, Philosophical Transactions of the Royal Society of London Series A, 370, 2765
- Althaus et al. (2010) Althaus L. G., Córsico A. H., Isern J., García-Berro E., 2010, A&ARv, 18, 471
- Badenes et al. (2013) Badenes C., van Kerkwijk M. H., Kilic M., Bickerton S. J., Mazeh T., Mullally F., Tal-Or L., Thompson S. E., 2013, MNRAS, 429, 3596
- Barber et al. (2012) Barber S. D., Patterson A. J., Kilic M., Leggett S. K., Dufour P., Bloom J. S., Starr D. L., 2012, ApJ, 760, 26
- Barber et al. (2014) Barber S. D., Kilic M., Brown W. R., Gianninas A., 2014, ApJ, 786, 77
- Barber et al. (2016) Barber S. D., Belardi C., Kilic M., Gianninas A., 2016, MNRAS, 459, 1415
- Bayo et al. (2008) Bayo A., Rodrigo C., Barrado y Navascués D., Solano E., Gutiérrez R., Morales-Calderón M., Allard F., 2008, A&A, 492, 277
- Bergeron et al. (2011) Bergeron P., et al., 2011, ApJ, 737, 28
- Bergfors et al. (2014) Bergfors C., Farihi J., Dufour P., Rocchetto M., 2014, MNRAS, 444, 2147
- Bianchi & GALEX Team (2000) Bianchi L., GALEX Team 2000, Mem. Soc. Astron. Italiana, 71, 1123
- Bonnarel et al. (2000) Bonnarel F., et al., 2000, A&AS, 143, 33
- Bonsor et al. (2011) Bonsor A., Mustill A. J., Wyatt M. C., 2011, MNRAS, 414, 930
- Bonsor et al. (2017) Bonsor A., Farihi J., Wyatt M. C., van Lieshout R., 2017, MNRAS, 468, 154
- Burleigh et al. (2002) Burleigh M. R., Clarke F. J., Hodgkin S. T., 2002, MNRAS, 331, L41
- Castanheira & Kepler (2008) Castanheira B. G., Kepler S. O., 2008, MNRAS, 385, 430
- Chambers et al. (2016) Chambers K. C., et al., 2016, preprint, (arXiv:1612.05560)
- Cross et al. (2012) Cross N. J. G., et al., 2012, A&A, 548, A119
- Dark Energy Survey Collaboration et al. (2016) Dark Energy Survey Collaboration et al., 2016, MNRAS, 460, 1270
- Debes & Sigurdsson (2002) Debes J. H., Sigurdsson S., 2002, ApJ, 572, 556
- Debes et al. (2011) Debes J. H., Hoard D. W., Wachter S., Leisawitz D. T., Cohen M., 2011, ApJS, 197, 38
- Debes et al. (2012) Debes J. H., Walsh K. J., Stark C., 2012, ApJ, 747, 148
- Dennihy et al. (2016) Dennihy E., Debes J. H., Dunlap B. H., Dufour P., Teske J. K., Clemens J. C., 2016, ApJ, 831, 31
- Dennihy et al. (2017) Dennihy E., Clemens J. C., Debes J. H., Dunlap B. H., Kilkenny D., O’Brien P. C., Fuchs J. T., 2017, ApJ, 849, 77
- Dennihy et al. (2018) Dennihy E., Clemens J. C., Dunlap B. H., Fanale S. M., Fuchs J. T., Hermes J. J., 2018, ApJ, 854, 40
- El-Badry & Rix (2018) El-Badry K., Rix H.-W., 2018, MNRAS, 480, 4884
- Farihi (2016) Farihi J., 2016, New Astron. Rev., 71, 9
- Farihi & Christopher (2004) Farihi J., Christopher M., 2004, AJ, 128, 1868
- Farihi et al. (2005) Farihi J., Becklin E. E., Zuckerman B., 2005, ApJS, 161, 394
- Farihi et al. (2008a) Farihi J., Zuckerman B., Becklin E. E., 2008a, ApJ, 674, 431
- Farihi et al. (2008b) Farihi J., Becklin E. E., Zuckerman B., 2008b, ApJ, 681, 1470
- Farihi et al. (2009) Farihi J., Jura M., Zuckerman B., 2009, ApJ, 694, 805
- Farihi et al. (2010) Farihi J., Jura M., Lee J. E., Zuckerman B., 2010, ApJ, 714, 1386
- Farihi et al. (2011) Farihi J., Burleigh M. R., Holberg J. B., Casewell S. L., Barstow M. A., 2011, MNRAS, 417, 1735
- Farihi et al. (2013) Farihi J., Gänsicke B. T., Koester D., 2013, Science, 342, 218
- Gaia Collaboration et al. (2018) Gaia Collaboration Brown A. G. A., Vallenari A., Prusti T., de Bruijne J. H. J., Babusiaux C., Bailer-Jones C. A. L., 2018, preprint, (arXiv:1804.09365)
- Gänsicke et al. (2006) Gänsicke B. T., Marsh T. R., Southworth J., Rebassa-Mansergas A., 2006, Science, 314, 1908
- Gänsicke et al. (2012) Gänsicke B. T., Koester D., Farihi J., Girven J., Parsons S. G., Breedt E., 2012, MNRAS, 424, 333
- Gentile Fusillo et al. (2019) Gentile Fusillo N. P., et al., 2019, MNRAS, 482, 4570
- Gianninas et al. (2011) Gianninas A., Bergeron P., Ruiz M. T., 2011, ApJ, 743, 138
- Girven et al. (2012) Girven J., Brinkworth C. S., Farihi J., Gänsicke B. T., Hoard D. W., Marsh T. R., Koester D., 2012, ApJ, 749, 154
- Hewett et al. (2006) Hewett P. C., Warren S. J., Leggett S. K., Hodgkin S. T., 2006, MNRAS, 367, 454
- Hoard et al. (2013) Hoard D. W., Debes J. H., Wachter S., Leisawitz D. T., Cohen M., 2013, ApJ, 770, 21
- Hollands et al. (2018a) Hollands M. A., Gänsicke B. T., Koester D., 2018a, MNRAS, 477, 93
- Hollands et al. (2018b) Hollands M. A., Tremblay P.-E., Gänsicke B. T., Gentile-Fusillo N. P., Toonen S., 2018b, MNRAS, 480, 3942
- Jiménez-Esteban et al. (2018) Jiménez-Esteban F. M., Torres S., Rebassa-Mansergas A., Skorobogatov G., Solano E., Cantero C., Rodrigo C., 2018, MNRAS, 480, 4505
- Jura (2008) Jura M., 2008, AJ, 135, 1785
- Jura et al. (2007) Jura M., Farihi J., Zuckerman B., 2007, ApJ, 663, 1285
- Kilic et al. (2012) Kilic M., Patterson A. J., Barber S., Leggett S. K., Dufour P., 2012, MNRAS, 419, L59
- Klein et al. (2010) Klein B., Jura M., Koester D., Zuckerman B., Melis C., 2010, ApJ, 709, 950
- Koester (2010) Koester D., 2010, Mem. Soc. Astron. Italiana, 81, 921
- Koester & Kepler (2015) Koester D., Kepler S. O., 2015, A&A, 583, A86
- Koester et al. (2014) Koester D., Gänsicke B. T., Farihi J., 2014, A&A, 566, A34
- Lada et al. (2006) Lada C. J., et al., 2006, AJ, 131, 1574
- Limoges et al. (2015) Limoges M.-M., Bergeron P., Lépine S., 2015, ApJS, 219, 19
- Mullally et al. (2007) Mullally F., Kilic M., Reach W. T., Kuchner M. J., von Hippel T., Burrows A., Winget D. E., 2007, ApJS, 171, 206
- Pecaut & Mamajek (2013) Pecaut M. J., Mamajek E. E., 2013, ApJS, 208, 9
- Raddi et al. (2015) Raddi R., Gänsicke B. T., Koester D., Farihi J., Hermes J. J., Scaringi S., Breedt E., Girven J., 2015, MNRAS, 450, 2083
- Reach et al. (2005) Reach W. T., Kuchner M. J., von Hippel T., Burrows A., Mullally F., Kilic M., Winget D. E., 2005, ApJ, 635, L161
- Rebassa-Mansergas et al. (2010) Rebassa-Mansergas A., Gänsicke B. T., Schreiber M. R., Koester D., Rodríguez-Gil P., 2010, MNRAS, 402, 620
- Rebassa-Mansergas et al. (2016) Rebassa-Mansergas A., Ren J. J., Parsons S. G., Gänsicke B. T., Schreiber M. R., García-Berro E., Liu X.-W., Koester D., 2016, MNRAS, 458, 3808
- Reiners et al. (2018) Reiners A., et al., 2018, A&A, 612, A49
- Ren et al. (2014) Ren J. J., et al., 2014, A&A, 570, A107
- Renedo et al. (2010) Renedo I., Althaus L. G., Miller Bertolami M. M., Romero A. D., Córsico A. H., Rohrmann R. D., García-Berro E., 2010, ApJ, 717, 183
- Rocchetto et al. (2015) Rocchetto M., Farihi J., Gänsicke B. T., Bergfors C., 2015, MNRAS, 449, 574
- Siess (2007) Siess L., 2007, A&A, 476, 893
- Skrutskie et al. (2006) Skrutskie M. F., et al., 2006, AJ, 131, 1163
- Smart et al. (2017) Smart R. L., Marocco F., Caballero J. A., Jones H. R. A., Barrado D., Beamín J. C., Pinfield D. J., Sarro L. M., 2017, MNRAS, 469, 401
- Steele et al. (2013) Steele P. R., et al., 2013, MNRAS, 429, 3492
- Taylor (2005) Taylor M. B., 2005, in Shopbell P., Britton M., Ebert R., eds, Astronomical Society of the Pacific Conference Series Vol. 347, Astronomical Data Analysis Software and Systems XIV. p. 29
- Torres et al. (2019) Torres S., Cantero C., Rebassa-Mansergas A., Skorobogatov G., Jiménez-Esteban F. M., Solano E., 2019, arXiv e-prints,
- Tremblay & Bergeron (2008) Tremblay P.-E., Bergeron P., 2008, ApJ, 672, 1144
- Vanderburg et al. (2015) Vanderburg A., et al., 2015, Nature, 526, 546
- Veras et al. (2013) Veras D., Mustill A. J., Bonsor A., Wyatt M. C., 2013, MNRAS, 431, 1686
- Wilson et al. (2016) Wilson D. J., Gänsicke B. T., Farihi J., Koester D., 2016, MNRAS, 459, 3282
- Wilson et al. (2019) Wilson T. G., Farihi J., Gänsicke B. T., Swan A., 2019, MNRAS,
- Wright et al. (2010) Wright E. L., et al., 2010, AJ, 140, 1868
- Wu et al. (2010) Wu X., Roby T., Ly L., 2010, in Mizumoto Y., Morita K. I., Ohishi M., eds, Astronomical Society of the Pacific Conference Series Vol. 434, Astronomical Data Analysis Software and Systems XIX. p. 14
- Xu & Jura (2012) Xu S., Jura M., 2012, ApJ, 745, 88
- Xu & Jura (2014) Xu S., Jura M., 2014, ApJ, 792, L39
- Xu et al. (2014) Xu S., Jura M., Koester D., Klein B., Zuckerman B., 2014, ApJ, 783, 79
- Xu et al. (2015) Xu S., Jura M., Pantoja B., Klein B., Zuckerman B., Su K. Y. L., Meng H. Y. A., 2015, ApJ, 806, L5
- Xu et al. (2017) Xu S., Zuckerman B., Dufour P., Young E. D., Klein B., Jura M., 2017, ApJ, 836, L7
- Zuckerman & Becklin (1987) Zuckerman B., Becklin E. E., 1987, ApJ, 319, L99
- Zuckerman et al. (2003) Zuckerman B., Koester D., Reid I. N., Hünsch M., 2003, ApJ, 596, 477