NuSTAR Discovery of Dead Quasar Engine in Arp 187
Abstract
Recent active galactic nucleus (AGN) and quasar surveys have revealed a population showing rapid AGN luminosity variability by a factor of . Here we present the most drastic AGN luminosity decline by a factor of constrained by a NuSTAR X-ray observation of the nearby galaxy Arp 187, which is a promising “dead” quasar whose current activity seems quiet but whose past activity of erg s-1 is still observable at a large scale by its light echo. The obtained upper bound of the X-ray luminosity is , corresponding to , indicating an inactive central engine. Even if a putative torus model with cm-2 is assumed, the strong upper-bound still holds with or . Given the expected size of the narrow line region, this luminosity decrease by a factor of must have occurred within yr. This extremely rapid luminosity/accretion shutdown is puzzling and it requires one burst-like accretion mechanism producing a clear outer boundary for an accretion disk. We raise two possible scenarios realizing such an accretion mechanism: a mass accretion 1) by the tidal disruption of a molecular cloud and/or 2) by the gas depletion as a result of vigorous nuclear starformation after rapid mass inflow to the central engine.
1 Introduction
One of the fundamental questions on supermassive black holes (SMBHs) is how they stop growing their mass. The recent and ongoing quasar surveys have revealed massive SMBHs with masses of at (e.g., Mortlock et al., 2011), and interestingly, there seems to be a redshift-independent maximum mass limit at (e.g., Netzer, 2003; Kormendy & Ho, 2013). This suggests that there is a fundamental quenching mechanism of the SMBH growth independently from the cosmic evolution, and possible mechanisms have been discussed theoretically by several authors (e.g., Natarajan & Treister, 2009; King, 2016; Inayoshi & Haiman, 2016).
However, it is still observationally difficult to find quasars in the final growing/dying phase. The Soltan argument requires the total AGN lifetime is the order of yr (Soltan, 1982; Marconi et al., 2004), and even a single episode of AGN activity should be longer than yr (Schawinski et al., 2015), and possibly yr (e.g., Marconi et al., 2004; Hopkins et al., 2006). This long lifetime implies that it is extremely difficult to witness the “newly-born” or “dying” phase of each AGN within the human timescale of yr.
One solution for this issue is using the difference in the physical size among AGN indicators, some of which would give us the quasar time variability longer than the human timescale. AGN have multiple indicators with different physical scales from – (X-ray corona and UV-optically bright accretion disk; Dai et al., 2010; Morgan et al., 2010), – pc (AGN tori; Burtscher et al., 2013; Ichikawa et al., 2015), to kpc (narrow-line region or AGN jet; Bennert et al., 2002; O’Dea, 1998), and the luminosities of the AGN indicators are tightly correlated with each other (Ichikawa et al., 2012, 2017, 2019b; Toba et al., 2014; Asmus et al., 2015; Ueda et al., 2015). Recent observations have revealed an interesting AGN population that shows strong AGN activity at large scales with 1 kpc but much weaker one at small scales ( 10 pc), suggesting a fading activity of the central engine. They are called fading AGN and currently such sources have been reported (e.g., Schirmer et al., 2013; Ichikawa et al., 2016, 2019a; Keel et al., 2017; Kawamuro et al., 2017; Villar-Martín et al., 2018; Wylezalek et al., 2018; Sartori et al., 2018).
Out of those sources, Arp 187, a merger remnant infrared galaxy located at ( Mpc), is the most promising “dying” or “dead” quasar candidate, which completely lack current AGN signatures on small scales ( pc), but previous AGN activity estimated by the large scale AGN indicators ( kpc) must have reached quasar level luminosity. Previous VLA and ALMA 5–100 GHz radio observations have revealed the bimodal jet lobes with kpc size, whose kinematic jet age of yr. On the other hand, the central radio-core is absent, suggesting that the central engine is already faint or even quenched. The optical spectrum indicates that Arp 187 has narrow line region with the estimated size of kpc, and the expected AGN luminosity reaches erg s-1 (Ichikawa et al., 2019a). On the nuclear AGN indicators, pc scale AGN torus emission was not detected in the Spitzer/IRS mid-infrared spectrum, whose emission is dominated by the host galaxy, suggesting the absence of the current AGN torus activity with the upper-bound of erg s-1 (Ichikawa et al., 2016).
However, we still lack a strong constraint on the current activity. In this letter, we report the first NuSTAR hard X-ray observation for this target. Thanks to its strong penetration power against absorption, NuSTAR puts the strongest constraint on the current AGN luminosity even in the case of heavy obscuration, allowing us to conclude that Arp 187 has an inactive central engine.
2 NuSTAR Observations and Results
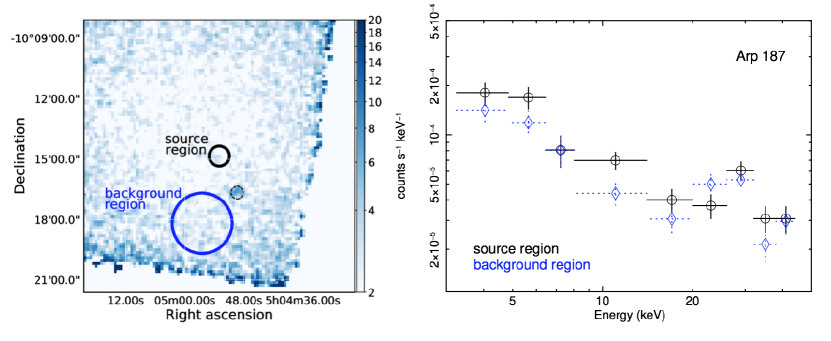
The NuSTAR data were obtained with an on-source exposure of 82 ksec (GO cycle-4 Program 04037, PI: K. Ichikawa). Following the “NuSTAR Analysis Quickstart Quide” 111https://heasarc.gsfc.nasa.gov/docs/nustar/analysis/nustar_quickstart_guide.pdf, we reprocessed the data from NuSTAR detector modules of FPMA and FPMB with the standard NuSTAR script of nupipeline, which has two options to remove times with high background (i.e., saamode and tentable). From the telemetry report on count rates over the focal plane, we found slightly higher rates in orbits around the standard SAA area ( 2 counts s-1) than typical values ( 1 count s-1). Thus, saamode=optimized was adopted. Even if a more strict option of saamode=strict is used, our conclusion is unchanged. By contrast, such increase cannot be clearly seen in the so-called tentacle region (Forster et al., 2014) near the SAA, but by following recommendation of the NuSTAR team, we adopted tentacle=yes. Alternative option of tentable=no indeed provides a similar result, thus having little impact on our conclusion. The left panel of Figure 1 shows an exposure-corrected 8–24 keV image, created by combining the FPMA and FPMB data and smoothed by a Gaussian function with pixels.
As indicated in the X-ray image, we defined a source region as a circle with a 30-arcsec radius centered at the optical position of the galaxy, and the background region was selected from the same chip as an off-source area with a 90 arcsec radius. The larger size was set to avoid local statistical fluctuations of the background level. We confirm insignificant change of our conclusion, even if a background spectrum is taken from a 30-arcsec circle near the source region. Note that, in the field-of-view, an X-ray source was serendipitously detected in (R.A, Decl.) with 8.8 significance at 8–24 keV, and its counterpart is likely to be GALEXASC J050449.00–101633.6 at . Its 2–10 keV flux estimated by a power-law model fit is erg cm-2 s-1. Given its location far from our target Arp 187 with an angular separation of 2 arcmin, which is at least six times larger than the positional uncertainty of NuSTAR (up to arcsec, e.g., Lansbury et al., 2017), we conclude that the emission does not originate from Arp 187 and hereafter we will not discuss this source.
The right panel of Figure 1 shows obtained spectra of Arp 187 at 3–50 keV from the two regions in the left panel. The source spectrum shows no significant excess (2.9 and 1.5 in the 3.0–8.0 keV and 8.0–24 keV bands, respectively) to the background one. By considering an un-absorbed cut-off power-law component with the photon index of 1.7 and cut-off energy of 360 keV (Kawamuro et al., 2016)222Even if we adopt another plausible parameter set of and cut-off energy of 200 keV, found for a large hard X-ray selected AGN sample by Ricci et al. (2017), the upper limit of 2–10 keV luminosity increases only by 10%, thus having little impact on our conclusion., the 3 upper limits of the 8–24 keV flux and luminosity are estimated to be erg cm-2 s-1 and erg s-1, equivalent to the 2–10 keV luminosity of erg s-1, corresponding to erg s-1 with a bolometric correction factor of 20 (Vasudevan et al., 2009). Hereafter, all upper-limits on X-ray fluxes are at level. This estimate is not so sensitive to absorption in the sight-line up to . To consider more heavily obscured cases, we adopt a putative torus model as follows:
 TBabs*cabs*zpowerlw*zhighect
  +zpowerlw*zhighect
     *mtable{e-torus_20161121_2500M.fits}
  +atable{refl_fe_torus.fits},
represented in XSPEC terminology333 The fits files of e-torus models were originally created by Ikeda et al. (2009). The first one is publicly available from https://heasarc.gsfc.nasa.gov/xanadu/xspec/models/etorus.html and the second one was privately obtained from Ikeda et al. (2009). This takes account of an absorbed and Compton scattered power-law component, a reflected continuum and an accompanying fluorescent iron-K line. The photon index of the power-law, inclination and opening angles of the torus are set to 1.7, 70∘, and 60∘, respectively. Even under a Compton-thick absorption of cm-2 in the torus equatorial plane, the upper bound of the intrinsic luminosity is still very low with , or the bolometric luminosity of . Note that other well-known torus models, such as MYTorus and Borus (Yaqoob, 2012; Baloković et al., 2018), also gives similar luminosity upper-bounds with the difference by a factor of 1.2. Lastly, we mention that the X-ray luminosity expected from the star-formation in the infrared (Ueda et al., 2014) is consistent with the 0.5–8 keV upper bound ( erg s-1) from the extrapolation based on the 3–8 keV band, where a canonical power-law model seen in star-forming galaxies with and cm-2 (Mineo et al., 2012) is utilized.
3 Discussion
3.1 Very Faint AGN Even If It Is Highly Obscured
Our NuSTAR result shows the strongest current luminosity constraints with for , and for . This indicates that the central engine of Arp 187 is currently very faint even if it is highly obscured by gas. This is consistent with the absence of the AGN torus emission in the Spitzer/IRS spectra, which gives us the 3 upper-bound luminosity of (Ichikawa et al., 2016).
One would expect that Arp 187 might be obscured by thicker absorption of cm-2. In this case, the expected upper-bound reaches to , or , exceeding the upper-bound obtained from the Spitzer/IRS spectra. However, this situation is unlikely because the reprocessed infrared emission should be observed even in such highly obscured situation, contributing to the Spitzer/IRS spectra (e.g., Yan et al., 2019). Thus, we conclude that the central engine of Arp 187 is likely to be dead, even if we consider the Compton-thick level obscuration, but the extreme absorption reaching cm-2 is also unlikely.
3.2 The Drastic Luminosity Decline
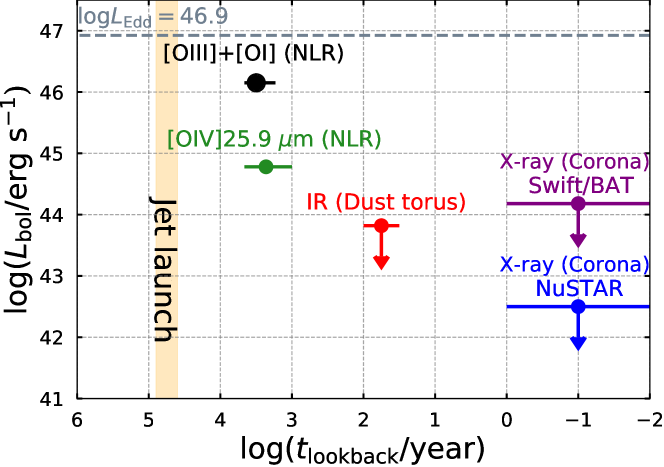
One important goal of our study is to constrain how rapidly the AGN in Arp 187 has dropped its luminosity. As already described in Section 1, the mutli-wavelength observations indicate that Arp 187 has experienced a luminosity decline in the past yr. Figure 2 summarizes the long-term decline together with the X-ray upper-bound we have obtained. The luminosity and the look-back time are obtained by combining the observational results of several AGN indicators with different physical scales (Ichikawa et al., 2016, 2019a).
Figure 2 shows that, thanks to its sensitivity in the hard X-ray band, NuSTAR (blue point) gives us a nearly two orders of magnitude fainter luminosity constraint than a previous estimate in the Swift/BAT 105 month catalog (purple; Oh et al., 2018). In addition, the NuSTAR observation gives the constraint on the current luminosity better than the MIR observations. Compared to the luminosity of (see the black point) obtained from the NLR tracing the AGN activity yr ago, Arp 187 has experienced the luminosity decline at least by a factor of .
Naively, this drastic luminosity experience indicates that the accretion rate in Arp 187 should have drastically dropped over times within yr. This seemingly short timescale itself is consistent with the viscous timescale of the UV emitting region (see the discussion of Ichikawa et al., 2019a). There however remains another question of how such drastic decline of accretion was achieved. A gradual decrease of a external gas supply to the accretion disk cannot produce such a drastic luminosity decline. One suggestion is thus that the accretion disk has a clear outer disk boundary out of which the accretion rate drastically drops over times. Therefore, one burst-like accretion event is preferable for realizing such a drastic accretion rate change.
3.3 Tidal Disruption Event in Arp 187?
One might argue that a tidal disruption event (TDE) of a star could reproduce such a drastic accretion change. However, there are three difficulties in the case of Arp 187. First, the estimated BH mass of Arp 187 is , which thus requires a massive star above the main sequence, such as the red giant, to be tidally disrupted by the tidal field of the SMBH (e.g., Rees, 1988). The second is the luminosity problem: even if a red super giant, whose total mass is typically , is tidally disrupted, it would be hard for the large BH () to reach the expected Eddington ratio of Arp 187 (), or an accretion rate of /yr (e.g., see Figure 5 of MacLeod et al., 2013). Third, the expected time scale: considering the rapid luminosity decline of TDEs which decays roughly as , the maximum observable timescale as AGN or quasar would be maximum yr. If a TDE is assumed to have happened at the time of jet-launch, or – yr ago (see Figure 2 or Section 1), the estimated NLR size should be expanded only up to pc scale, and the [O III] would cool on timescales of yr and thus such feature is no longer observable at the current stage. This is in clear disagreement with the observations, which leads us to exclude a TDE of a star as the origin of the accretion episode currently observed in Arp 187.
The other possibility is the TDE of a giant molecular cloud (GMC). Arp 187 is a good environment to produce such an event because of the starforming galaxy with plenty gas mass of in the central pc (Ueda et al., 2014). The tidal radius of a GMC cloud is big enough as pc, where a canonical range of GMC radii is – pc and that of GMC masses is – in local galaxies (e.g., Bolatto et al., 2008). Although this idea is exclusively applied to Sgr A (e.g., Bonnell & Rice, 2008) and further theoretical studies are required to examine the case of much bigger SMBHs with , a GMC with mass of can feed the SMBH of Arp 187 with the sub-Eddington level for yr. This would be long enough to produce the expected-size NLR by keeping the estimated past luminosity of .
3.4 Accretion Disk Outer Boundary After Nuclear Starburst
Our observation indicates the rapid luminosity decline in the final phase of quasar activity in Arp 187. One question raised from this result is whether this drastic luminosity decline is unique event only for Arp 187 or a rather common behaviour in the final phase of quasars.
Once the accretion rate somehow exceeds a certain value, it may naturally produce the drastic accretion rate gap, resulting in the drastic luminosity decline in the final phase of a quasar. By utilizing the nuclear starburst disk model by Thompson et al. (2005), Ballantyne (2008) and Inayoshi & Haiman (2016) discussed such a possibility that once the rapid accretion rate of yr-1 is achieved, at around pc, vigorous star formation starts to deplete most of the gas and the accretion rate rapidly decreases by a factor of times at some point, making a strong accretion rate gap. This is in good agreement with our expectation of the clear outer accretion disk boundary.
Considering that Arp 187 is a merger remnant, such a rapid accretion flow with yr-1 could be achieved by a previous major merger (e.g., Hopkins & Quataert, 2010). The expected lifetime of such accretion disk is yr, which is long enough to produce the NLR and actually consistent with the typical quasar lifetime (e.g., Martini, 2004). Based on those indirect observational signatures, quasars who experienced a drastic accretion inflow might follow the same luminosity decline in their future after consuming most of the gas in the accretion disk. On the other hand, a smooth accretion which have never exceeded the critical accretion rate of yr-1 will show more slower luminosity decline longer than yr.
References
- Asmus et al. (2015) Asmus, D., Gandhi, P., Hönig, S. F., Smette, A., & Duschl, W. J. 2015, MNRAS, 454, 766, doi: 10.1093/mnras/stv1950
- Ballantyne (2008) Ballantyne, D. R. 2008, ApJ, 685, 787, doi: 10.1086/591048
- Baloković et al. (2018) Baloković, M., Brightman, M., Harrison, F. A., et al. 2018, ApJ, 854, 42, doi: 10.3847/1538-4357/aaa7eb
- Bennert et al. (2002) Bennert, N., Falcke, H., Schulz, H., Wilson, A. S., & Wills, B. J. 2002, ApJ, 574, L105, doi: 10.1086/342420
- Bolatto et al. (2008) Bolatto, A. D., Leroy, A. K., Rosolowsky, E., Walter, F., & Blitz, L. 2008, ApJ, 686, 948, doi: 10.1086/591513
- Bonnell & Rice (2008) Bonnell, I. A., & Rice, W. K. M. 2008, Science, 321, 1060, doi: 10.1126/science.1160653
- Burtscher et al. (2013) Burtscher, L., Meisenheimer, K., Tristram, K. R. W., et al. 2013, A&A, 558, A149, doi: 10.1051/0004-6361/201321890
- Dai et al. (2010) Dai, X., Kochanek, C. S., Chartas, G., et al. 2010, ApJ, 709, 278, doi: 10.1088/0004-637X/709/1/278
- Forster et al. (2014) Forster, K., Harrison, F. A., Dodd, S. R., et al. 2014, in Society of Photo-Optical Instrumentation Engineers (SPIE) Conference Series, Vol. 9149, Proc. SPIE, 91490R
- Hopkins et al. (2006) Hopkins, P. F., Hernquist, L., Cox, T. J., et al. 2006, ApJS, 163, 1, doi: 10.1086/499298
- Hopkins & Quataert (2010) Hopkins, P. F., & Quataert, E. 2010, MNRAS, 407, 1529, doi: 10.1111/j.1365-2966.2010.17064.x
- Ichikawa et al. (2017) Ichikawa, K., Ricci, C., Ueda, Y., et al. 2017, ApJ, 835, 74, doi: 10.3847/1538-4357/835/1/74
- Ichikawa et al. (2019a) Ichikawa, K., Ueda, J., Bae, H.-J., et al. 2019a, ApJ, 870, 65, doi: 10.3847/1538-4357/aaf233
- Ichikawa et al. (2016) Ichikawa, K., Ueda, J., Shidatsu, M., Kawamuro, T., & Matsuoka, K. 2016, PASJ, 68, 9, doi: 10.1093/pasj/psv112
- Ichikawa et al. (2012) Ichikawa, K., Ueda, Y., Terashima, Y., et al. 2012, ApJ, 754, 45, doi: 10.1088/0004-637X/754/1/45
- Ichikawa et al. (2015) Ichikawa, K., Packham, C., Ramos Almeida, C., et al. 2015, ApJ, 803, 57, doi: 10.1088/0004-637X/803/2/57
- Ichikawa et al. (2019b) Ichikawa, K., Ricci, C., Ueda, Y., et al. 2019b, ApJ, 870, 31, doi: 10.3847/1538-4357/aaef8f
- Ikeda et al. (2009) Ikeda, S., Awaki, H., & Terashima, Y. 2009, ApJ, 692, 608, doi: 10.1088/0004-637X/692/1/608
- Inayoshi & Haiman (2016) Inayoshi, K., & Haiman, Z. 2016, ApJ, 828, 110, doi: 10.3847/0004-637X/828/2/110
- Kawamuro et al. (2017) Kawamuro, T., Schirmer, M., Turner, J. E. H., Davies, R. L., & Ichikawa, K. 2017, ApJ, 848, 42, doi: 10.3847/1538-4357/aa8e46
- Kawamuro et al. (2016) Kawamuro, T., Ueda, Y., Tazaki, F., Ricci, C., & Terashima, Y. 2016, ApJS, 225, 14, doi: 10.3847/0067-0049/225/1/14
- Keel et al. (2017) Keel, W. C., Lintott, C. J., Maksym, W. P., et al. 2017, ApJ, 835, 256, doi: 10.3847/1538-4357/835/2/256
- King (2016) King, A. 2016, MNRAS, 456, L109, doi: 10.1093/mnrasl/slv186
- Kormendy & Ho (2013) Kormendy, J., & Ho, L. C. 2013, ARA&A, 51, 511, doi: 10.1146/annurev-astro-082708-101811
- Lansbury et al. (2017) Lansbury, G. B., Stern, D., Aird, J., et al. 2017, ApJ, 836, 99, doi: 10.3847/1538-4357/836/1/99
- MacLeod et al. (2013) MacLeod, M., Ramirez-Ruiz, E., Grady, S., & Guillochon, J. 2013, ApJ, 777, 133, doi: 10.1088/0004-637X/777/2/133
- Marconi et al. (2004) Marconi, A., Risaliti, G., Gilli, R., et al. 2004, MNRAS, 351, 169, doi: 10.1111/j.1365-2966.2004.07765.x
- Martini (2004) Martini, P. 2004, in Coevolution of Black Holes and Galaxies, ed. L. C. Ho, 169
- Mineo et al. (2012) Mineo, S., Gilfanov, M., & Sunyaev, R. 2012, MNRAS, 419, 2095, doi: 10.1111/j.1365-2966.2011.19862.x
- Morgan et al. (2010) Morgan, C. W., Kochanek, C. S., Morgan, N. D., & Falco, E. E. 2010, ApJ, 712, 1129, doi: 10.1088/0004-637X/712/2/1129
- Mortlock et al. (2011) Mortlock, D. J., Warren, S. J., Venemans, B. P., et al. 2011, Nature, 474, 616, doi: 10.1038/nature10159
- Natarajan & Treister (2009) Natarajan, P., & Treister, E. 2009, MNRAS, 393, 838, doi: 10.1111/j.1365-2966.2008.13864.x
- Netzer (2003) Netzer, H. 2003, ApJ, 583, L5, doi: 10.1086/368012
- O’Dea (1998) O’Dea, C. P. 1998, PASP, 110, 493, doi: 10.1086/316162
- Oh et al. (2018) Oh, K., Koss, M., Markwardt, C. B., et al. 2018, ArXiv e-prints. https://arxiv.org/abs/1801.01882
- Rees (1988) Rees, M. J. 1988, Nature, 333, 523, doi: 10.1038/333523a0
- Ricci et al. (2017) Ricci, C., Trakhtenbrot, B., Koss, M. J., et al. 2017, ApJS, 233, 17, doi: 10.3847/1538-4365/aa96ad
- Sartori et al. (2018) Sartori, L. F., Schawinski, K., Trakhtenbrot, B., et al. 2018, MNRAS, 476, L34, doi: 10.1093/mnrasl/sly025
- Schawinski et al. (2015) Schawinski, K., Koss, M., Berney, S., & Sartori, L. F. 2015, MNRAS, 451, 2517, doi: 10.1093/mnras/stv1136
- Schirmer et al. (2013) Schirmer, M., Diaz, R., Holhjem, K., Levenson, N. A., & Winge, C. 2013, ApJ, 763, 60, doi: 10.1088/0004-637X/763/1/60
- Soltan (1982) Soltan, A. 1982, MNRAS, 200, 115, doi: 10.1093/mnras/200.1.115
- Thompson et al. (2005) Thompson, T. A., Quataert, E., & Murray, N. 2005, ApJ, 630, 167, doi: 10.1086/431923
- Toba et al. (2014) Toba, Y., Oyabu, S., Matsuhara, H., et al. 2014, ApJ, 788, 45, doi: 10.1088/0004-637X/788/1/45
- Ueda et al. (2014) Ueda, J., Iono, D., Yun, M. S., et al. 2014, ApJS, 214, 1, doi: 10.1088/0067-0049/214/1/1
- Ueda et al. (2015) Ueda, Y., Hashimoto, Y., Ichikawa, K., et al. 2015, ApJ, 815, 1, doi: 10.1088/0004-637X/815/1/1
- Vasudevan et al. (2009) Vasudevan, R. V., Mushotzky, R. F., Winter, L. M., & Fabian, A. C. 2009, MNRAS, 399, 1553, doi: 10.1111/j.1365-2966.2009.15371.x
- Villar-Martín et al. (2018) Villar-Martín, M., Cabrera-Lavers, A., Humphrey, A., et al. 2018, MNRAS, 474, 2302, doi: 10.1093/mnras/stx2911
- Wylezalek et al. (2018) Wylezalek, D., Zakamska, N. L., Greene, J. E., et al. 2018, MNRAS, 474, 1499, doi: 10.1093/mnras/stx2784
- Yan et al. (2019) Yan, W., Hickox, R. C., Hainline, K. N., et al. 2019, ApJ, 870, 33, doi: 10.3847/1538-4357/aaeed4
- Yaqoob (2012) Yaqoob, T. 2012, MNRAS, 423, 3360, doi: 10.1111/j.1365-2966.2012.21129.x