Effects of restrained degradation on gene expression and regulation
Abstract
The effects of carrying capacity of environment for degradation (the effect for short) on the constitutive gene expression and a simple genetic regulation system, are investigated by employing a stochastic Langevin equation combined with the corresponding Fokker-Planck equation for the two stochastic systems subjected to internal and external noises. This effect characterizes the limited degradation ability of the environment for RNA or proteins, such as insufficient catabolic enzymes. The effect could significantly change the distribution of mRNA copy-number in constitutive gene expression, and interestingly, it leads to the Fano factor slightly larger than 1 if only the internal noise exists. Therefore, that the recent experimental measurements suggests the Fano factor deviates from 1 slightly (Science 346 (2014) 1533), probably originates from the effect. The effects on the steady and transient properties of genetic regulation system, have been investigated in detail. It could enhance the mean first passage time significantly especially when the noises are weak and reduce the signal-to-noise ratio in stochastic resonance substantially.
pacs:
87.17.-d, 87.57.cm, 05.40.-aI Introduction
Gene expression and regulations are a research focus of molecular biology. In addition to extensive experimental studies, some deterministic differential equations are established to quantitatively investigate these complex processes. However, even genetically identical cells in identical environments exhibit variable phenotypes. This phenomenon is traced back to the gene expression noises. The noises sometimes play crucial roles in gene expression and regulation Gene1 ; Gene2 ; Gene3 ; Gene4 ; Gene5 ; Gene6 ; Gene7 ; Gene8 ; Gene9 ; Gene10 that involves lots of biochemical reactions and hence many random events. The noise can be divided into two categories: intrinsic noise and extrinsic noise. Usually, the former one stems from the small number of reactant molecules, while the latter one is produced by fluctuated environment. Therefore, the deterministic approaches that have been widely used in gene regulation networks are not valid any longer, and hence the effect of noises should be taken into account. Some useful approaches or equations have been proposed to study such stochastic gene expression, such as the Gillespie algorithms GS1 ; GS2 ; GS3 , the master equation, the Fokker-Planck equation and the Langevin equation, which have been explored extensively over the past decade FP1 ; FP2 ; FP3 .
During gene expression and regulations, the synthesized RNA or proteins degrade persistently. The degradation rate is regarded to be proportional to their concentration or copy number. However, due to the limited carrying capacity of the environment for degradation, such as the limited catabolic enzymes and ATP, the degradation rate should be restrained and thus it deviates from this linear relationship in particular when the concentration or copy numbers of the RNA or proteins are large, which is analogous to the logistic model for tumor cell growth TM1 ; TM2 ; TM3 .
In this work, we focus on the effect of the limited carrying capacity of the environment for degradation on the gene expression and regulations, we call it the ‘ effect’ for the sake of discussions. Two typical systems are investigated as illustrative examples, that is, the constitutive gene Gene8 and a simple genetic regulation system given by Ref. Sm . For the constitutive gene expression, it is well-known that the steady state distribution of mRNA copy-number obeys the Poisson statistics. The corresponding Fano factor which is defined as the ratio between the variance and the mean , of the mRNA copy-number distribution, is 1. However, the recent experimental measurement suggests that the Fano factor for the constitutive gene expression is larger than 1 data , even if the contribution of external noises is subtracted. We explore the influence of the effect on this Fano factor to attempt to explain the experimental measurement in Sec. 2. In Sec. 3, we calculate the effect on the simple genetic regulation model Sm , and investigate in detail the steady state distribution which characterizes the steady-state characters, the mean first passage time together with the stochastic resonance which characterize the transient properties.
II Constitutive Gene Expression
In a simplest model of constitutive gene expression, a transcript is produced at a constant rate and degraded with rate constant . The kinetics is given by the deterministic differential equation Gene8 , where is the copy-number of mRNA. If we include the effect of the carrying capacity of the environment which is widely-employed in Michaelis-Menten enzyme-catalyzed reactions, this equation should be written as
| (1) |
where measures the restrained degradation due to the limited carrying capacity of the environment, which is similar with the logistic model for tumor cell growth or population growth. With the inclusion of both internal () and external () Gaussian white noises, the corresponding Langevin equation is given as
| (2) | |||||
The two kinds of noises from different sources are assumed to be independent with each other. The Fokker-Planck equation corresponding to this Langevin equation is given by
| (3) | |||||
The stationary probability distribution for this Fokker-Planck equation is given by
| (4) |
where is a normalization constant. If only the intrinsic noise exists, i.e., , the probability distribution of mRNA copy-number follows the distribution of
| (5) |
where is a new normalization constant. If degradation is not restrained, i.e., carrying capacity of the environment is infinity (), the model is reduced to an unrestrained one that has been extensively discussed previously, for which the probability distribution of mRNA copy-number follows a Poisson statistics Gene8 . It is well known that the variance is equal to the mean for Poisson distribution, and hence the Fano factor defined by is exactly 1. The Poisson distribution is approximated to be Gauss distribution when the is large, and the Eq. (5) is exactly a Gauss distribution in the case of . Accordingly, the intrinsic noise strength is to make sure the . The limited carrying capacity of the environment , in particular when the value is small, leads to a result that the distribution deviates from the Gauss distribution, as shown in the above Eq. (5).
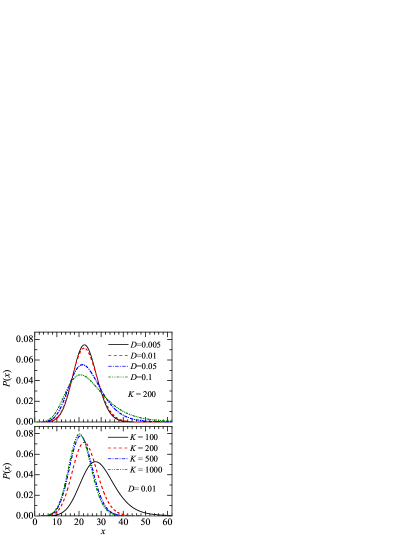
Figure 1 displays the normalized distribution as a function of mRNA copy-number under different carrying capacities of the environment for degradation and extrinsic noise strength . The expected single peak structure is presented. For a given , the peak value of the distribution decreases as the noise strength increases, but the shape of the becomes wider and wider and more asymmetric. A larger combined with a smaller gives a much closer to a Gauss distribution. The lower panel presents the role of the effct in the distribution . Note that a small value corresponds a weak carrying capacities of the environment, i.e., the degradation is strongly restrained by the environment. As the the value becomes smaller (the degradation is more strongly restrained), the peak value of distribution reduces and the location of the peak shifts towards the larger value substantially. Similarly, the distribution becomes more dispersive. When the value is larger enough, for instance, , the distribution does not change visibly because the carrying capacities of the environment is so large that the system approaches an unrestrained degradation case.

The Fano factor quantifies the deviation from Poisson statistics Gene8 for a gene expression system subject to intrinsic noise. Figure 2 shows the calculated Fano factor as a function of carrying capacities of the environment and the mean mRNA copy number, where the external noise is switched off () and the stationary probability distribution is described by Eq. (5). The Fano factor approaches 1, when the value becomes larger and larger and the corresponding the mean mRNA copy number becomes larger, which is consistent with the fact that the Fano factor for unrestrained degradation is exactly 1, and thus it indicates the reliability of the present calculations. The Fano factor is found to increase monotonously as the effect becomes more stronger. Under the influence of the intrinsic noise, the effect could induce the deviation of the Fano factor from 1, which is different from a time delay effect Feng2017 and is perhaps important for us to understand gene expression. The recent experimental measurement of the constitutive expression has indicated that the Fano factor is slightly larger than 1 in particular when the mean mRNA copy number per gene copy is large (the large copy number means that the Poisson distribution transitions to a Gauss distribution), even if the known external noise is subtracted data . Therefore, the deviation of the Fano factor from 1 is probably induced by the finite carrying capacities of the environment for degradation.
III A Simple Gene Transcription Regulatory System
Smolen et al. proposed a typical model for the gene transcriptional regulatory system Sm with the deterministic differential equation written as . Here is the concentration of the transcription factor (TF) monomer, the basal synthesis reaction rate of the TF, the maximal rate of phosphorylated dimer TF activator, the degradation rate, and the concentration of needed for half-maximal induction. By introducing the environmental fluctuation, this model has been widely investigated due to its role of representativeness TF1 ; TF2 ; TF3 ; TF4 ; TF5 ; TF6 ; TF7 ; TF8 ; TF9 . Note that the effect of a carrying capacity of the environment on the production of the TF has been included in this model. In the present work, we taken into account the effect of the limited carrying capacity of the environment on the degradation rate as for the constitutive gene expression that we discussed above. With the inclusion of both internal () and external () Gaussian white noises, the stochastic differential equation takes the form of
| (6) | |||||
The corresponding Fokker-Planck equation is also given by Eq. (II), but with . As a result, the stationary probability distribution is
| (7) |
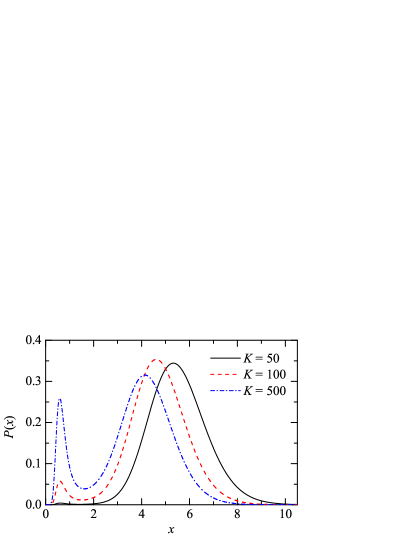
Figure 3 illustrates the normalized steady-state probability distribution versus the TF monomer concentration for different different values. The parameters we used in this work are , , , , as in Refs. TF2 ; TF3 ; TF4 ; TF8 . All the present obvious bimodal structure. One is at the low TF monomer concentration , and the other one is at high concentration . Such a bistability is the central characteristic for gene switches. When the degradation is restrained more strongly (smaller values), the first peak of the distribution decreases while the second one shifts towards a larger substantially. Therefore, the effect results in the transition from lower concentration state to a higher one. Interestingly, when the degradation is restrained strongly by the environment, such as , the bimodal structure vanishes, and just a single peak exists, as shown in Fig. 3. This indicates the importance of the effect in gene transcription regulatory system.
In addition to the steady state characters that we discussed above, to characterize a stochastic dynamical system, the transient properties are necessary. The mean first passage time is usually used to describe the transient properties, which is defined as the escape time from one state to the other one, and expression from the initially state to final state is given by MFPT1 ; MFPT2
| (8) |
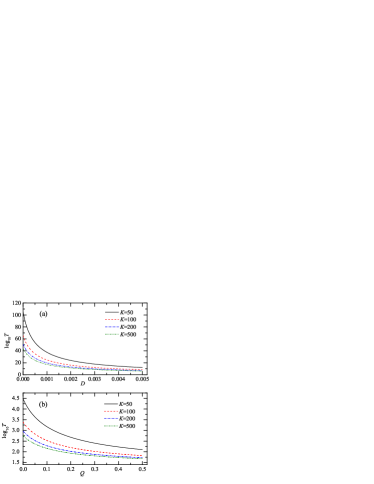
where is the deterministic potential for the system with maximum value at and is the modified potential. The mean first passage time as functions of noise strength and for different values is presented in Fig. 4. The mean first passage time is found to monotonously decreases as the noise strength or increases, and decreases distinctly as the increases in particular when the noises are weak. The decrease of the mean first passage time means that the transition from a high concentration state to a low one is enhanced. Therefore, a strong effect reduces the transition between the two states obviously.
Stochastic resonance that was first proposed by Benzi et al. SR01 and Nicolis et al. SR02 to describe the periodic recurrences of ice ages on Earth has been studied in a variety of nonlinear systems such as in biological systems and laser systems SR1 ; SR2 ; SR3 ; SR4 ; SR5 ; SR6 ; SR7 . As an intriguing phenomenon, it is the result of the cooperative effect between the noises and the external periodic signal. We explore the effect of the carrying capacities of the environment for degradation on the stochastic resonance in the gene transcription regulatory system. The evolution of the TF concentration is employing the Langevin equation of Eq. (2) by adding a weak periodic signal of , where and denote the intensity and frequency of this signal. According to the theory proposed in Ref. MW , in the adiabatic limit, the signal-to-noise ratio (SNR) is given as
| (9) |
with
| (10) | |||||
| (11) | |||||
| (12) |
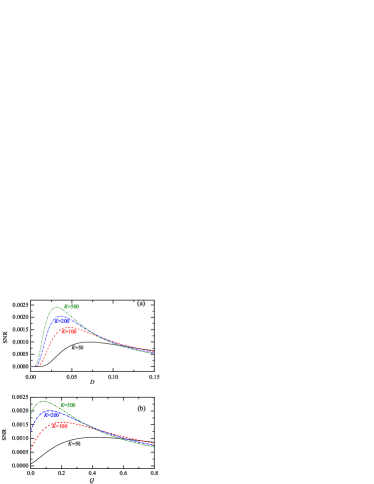
Figure 5 shows the SNR as a function of the external noise intensity and as a function of the internal noise intensity under different values. The SNR is a non-monotonous function with respect to the noise intensity and . The existence of maximum value in these curves is exactly the characteristics of the stochastic resonance. When the degradation is restrained more strongly (smaller values), the peak value of the SNR decreases and its location shifts to the right substantially both in the SNR- plots and in SNR- plots, indicating the significant role of the effect for reducing the stochastic resonance of the gene transcription regulatory system.
IV Summary
We have studied the dynamics of constitutive gene expression under the influence of carrying capacity of the environment for degradation and noises. The distribution of mRNA copy-number has been derived by using a Fokker-Planck equation based on a stochastic Langevin equation. A weak carrying capacity of the environment , corresponding a strong constraint on the degradation, changes the shape of the single peak distribution of obviously. Importantly, it results in an interesting conclusion that the Fano factor is slightly larger than 1 if only the internal noise exists, which may be used to explain the recent experimental measurements. The second example we discussed is the effect on the simple genetic regulation model. The stationary probability distribution, the mean first passage time along with the stochastic resonance have been calculated. We found that the effect induces the transition of the probability distribution between the high concentration state and the low state, and the bistable structure would vanish when the effect is stronger enough. The effect influences the mean first passage time significantly especially when the noises are weak. The larger the effect, the larger the mean first passage time is, and hence the transition between the high and low concentration states is more difficult. Finally, we found that the effect reduces the SNR in stochastic resonance on the whole, and changes the position of the resonance peak.
Acknowledgement
This work is supported by the Natural Science Foundation of Gansu Province for Distinguished Young Scholars (No. 1308RJYA065), by Medical Health Profession Plan Project of Gansu Province (No. GSWSKY-2015-64), by Cuiying Scientific and Technological Innovation Program of Lanzhou University Second Hospital (No. CY2018-QN08), by the National Natural Science Foundation of China (No. 11775276) and by the Youth Innovation Promotion Association of Chinese Academy of Sciences. Yan-Ling Feng and Jing Sun contributed equally to this work.
References
- (1) A. Becskei, L. Serrano, Nature 405, 590 (2000).
- (2) K. Ahmad and S. Henikoff, Cell 104, 839 (2001).
- (3) M. Elowitz, A. Levine, E. Siggia, and P. Swain, Science 297, 1183 (2002).
- (4) J. M. Pedraza and A. van Oudenaarden, Science 307, 1965 (2005).
- (5) D. Bratsun, D. Volfson, L. S. Tsimring, and J. Hasty, PNAS 102, 14593 (2005).
- (6) A. Sanchez and J. Kondev, PNAS 105, 5081 (2008).
- (7) L.-h. So, A. Ghosh, C. Zong, L. A Sepulveda, R. Segev, I. Golding, Nat. Gene. 43, 554 (2011).
- (8) B. Munsky, G. Neuert, and A. van Oudenaarden, Science 336, 183 (2012).
- (9) L. S. Tsimring, Rep. Prog. Phys. 77, 026601 (2014).
- (10) G. Anandamohan, J. Biol. Phys. 41, 49 (2015).
- (11) D. T. Gillespie, J. Phys. Chem. 81, 2340 (1977).
- (12) M. A. Gibson and J. Bruck, J. Phys. Chem. 104, 1876 (2000).
- (13) D. T. Gillespie, J. Chem. Phys. 115, 1716 (2001).
- (14) T. Kepler and T. Elston, Biophys. J. 81, 3116 (2001).
- (15) T. Tian, et al., J. Comput. Appl. Math. 205, 696 (2007).
- (16) T. Bretta and T. Gallab, J. Chem. Phys. 140, 124112 (2014).
- (17) W. R. Zhong, Y. Z. Shao, Z. H. He, Phys. Rev. E 73, 060902(R) (2006).
- (18) C. J. Wang, D. Li, D. C. Mei, Commun. Theor. Phys. 52, 463 (2009).
- (19) L. C. Du, D. C. Mei, Phys. Lett. A 374, 3275 (2010).
- (20) P. Smolen, D. A. Baxter and J. H. Byrne, Am. J. Physiol 274, 531 (1998).
- (21) Y.-L. Feng, J.-M. Dong, D. Wang, and X.-L. Tang, Commun. Theor. Phys. 68, 357 (2017).
- (22) D. L. Jones, R. C. Brewster, R. Phillips, Science 346, 1533 (2014).
- (23) Q. Liu and Y. Jia, Phys. Rev. E 70, 041907 (2004).
- (24) C. H. Zeng and X. C. Wei, Chin. Phys. Lett. 25, 1587 (2008).
- (25) C. H. Zeng and C. W. Xie, Phys. Scr. 78, 035801 (2008).
- (26) C. J. Wang, Chin. Phys. B 19, 030503 (2010).
- (27) C. Y. Bai, Y. Yan, and D. C. Mei, Chin. Phys. B 19, 060503 (2010).
- (28) C. J. Wang, Acta Phys. Sin. 61, 010503 (2012).
- (29) T. Yang, et al., J. Stat. Mech. 12, 12015 (2014).
- (30) Y.-L. Feng, J.-M. Dong, and X.-L. Tang, Chin. Phys. Lett. 33, 108701 (2016).
- (31) Y. L. Feng, J. Zhu, M. Zhang, L. L. Gao, Y. F. Liu, and J. M. Dong, Int. J. Mod. Phys. B 30, 1650067 (2016).
- (32) Y. Jia and J. R. Li, Phys. Rev. E 53, 5764 (1996).
- (33) D. C. Mei, G. Z. Xie, L. Cao, and D. J. Wu, Phys. Rev. E 59, 3880 (1999).
- (34) R. Benzi, A. Sutera, and A. Vulpiani, J. Phys. A 14, 453 (1981).
- (35) C. Nicolis and G. Nicolis, Tellus 33, 225 (1981).
- (36) Y. R. Zhou, Chin. Phys. B 20, 010501 (2011).
- (37) K. K. Wang and X. B. Liu, Chin. Phys. Lett. 30, 70504 (2013).
- (38) L. F. Lin, Y. Tian, and H. Ma, Chin. Phys. B 23, 080503 (2014).
- (39) K. K. Wang and X. B. Liu, Chin. Phys. B 23, 010502 (2014).
- (40) J. H. Li, Chin. Phys. Lett. 31, 030502 (2014).
- (41) D. X. Yang, F. S. Gu, G. J. Feng, Y. M. Yang, and B. Andrew, Chin. Phys. B 24, 110502 (2015).
- (42) Y. X. Wang, J. Q. Zhai, W. W. Xu, G. Z. Sun, and P. H. Wu, Chin. Phys. Lett. 32, 097401 (2015).
- (43) B. McNamara and K. Wiesenfeld, Phys. Rev. A 39, 4854 (1989).