Title: Tuning the Catalytic Properties of Monolayer MoS2 through Doping and Sulfur Vacancies
Author: Satvik Lolla, Xuan Luo
Affiliation: National Graphene Research and Development Center, Springfield, Virginia 22151, USA
Highlights:
1. The catalytic properties of TM doped MoS2 with S vacancies were theoretically studied.
2. Partially occupied orbitals and hybridization greatly affected the adsorption energy of O on doped MoS2.
3. Ir-MoS2 and Rh-MoS2 were the best catalysts before and after adsorption.
4. Introducing S vacancies notably enhances the catalytic properties of doped MoS2 sheets towards O and makes the doped MoS2 a better catalyst than palladium.
Graphical Abstract:
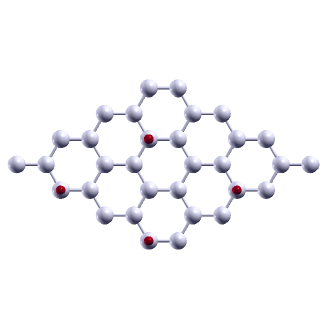
A combination of substitutional doping and sulfur vacancies can modify the electronic structure and chemical activity towards O. This may provide a route to extend the application of MoS2 and other 2D monolayers to develop efficient, cheap catalysts.
Tuning the Catalytic Properties of Monolayer MoS2 through Doping and Sulfur Vacancies
Abstract
Fuel cells in vehicles are the leading cause of carbon monoxide emissions. CO is one of the most dangerous gases in the atmosphere, as it binds to the hemoglobin in blood cells 200 times easier than O2. As the amount of CO in the blood stream increases, the level of oxygen decreases, which can lead to many neurological problems. To reduce the amount of CO in the atmosphere, scientists have focused on the adsorption of oxygen. The best substrates used today are platinum and palladium monolayers, which are very expensive. Because of this, researchers have searched for cheap materials, such as MoS2, that are able to adsorb oxygen. However, sulfur is a chemically inert site for the oxygen, which greatly decreases the catalytic potential of monolayer MoS2 sheets. Therefore, we carried out first-principles calculations to study the effect of substitutional doping and creating sulfur vacancies on the catalytic properties of MoS2. We calculated the adsorption energy of O on doped MoS2 sheets with vacancies, and compared it to the adsorption energy of O on a Pd monolayer. We found that doping MoS2 with Ir, Rh, Co and Fe significantly decreased the adsorption energy, to below -4 eV, indicating that doped MoS2 is a more effective catalyst than Pd. Incorporating sulfur vacancies into the doped MoS2 sheet was extremely effective, and decreased the adsorption energy below -6 eV. Our results show that iridium is the best catalyst as it has the lowest adsorption energy before and after sulfur vacancies were induced. We concluded that a combination of doping and creating vacancies in monolayer MoS2 sheets can greatly impact the catalytic behavior and make it a more effective, less expensive catalyst than Pt and Pd.
I Introduction
Climate change drastically affects the air we breathe. Various gases, such as CO2, CH4, NO2 and NO are producedsearchinger2008use ; however, the most dangerous greenhouse gas by far is CO, which may be the cause of more than one-half of the fatal poisonings reported in many countries ernst1998carbon . The hemoglobin in blood cells binds to carbon monoxide 200 times easier than oxygen does, which reduces the amount of oxygen in the blood while simultaneously increasing the level of carbon monoxide in the bodyraub2000carbon . This deprives the heart, brain, and other vital organs of oxygen. It can cause significant medical issues, including memory loss, seizures and neurological impairmentkao2005carbon . In order to limit the effects of carbon monoxide, scientists have focused on fuel cells, as they are the leading cause of CO in the atmosphereweaver2009carbon . Carbon monoxide can be created when fuel does not burn properly, or when an automobile engine is run in an enclosed space. To stop the carbon monoxide before it exits the vehicle, researchers use adsorption, the process in which a solid holds molecules of a gas or liquid. Many common adsorbents include claygaines1953adsorption , colloidsdeshmukh2015hard and nanoparticles2004colloidal . Nanoparticles are often used as catalysts in fuel cells to reduce carbon monoxide emissions.
The two nanoparticle catalysts used to adsorb oxygen today are platinum and palladiumli2019mechanism ; gauthard2003palladium . These two precious metals are extremely expensive and rare. However, they are very effective as they can easily break the carbon-oxygen bond in COzhou2010enhancement . In the hopes of developing new, promising catalysts, past research has focused on dopingzhang2009study and using other transition metals. The catalytic properties of palladium doped with gold and platinum doped with gold have been studied, but these mixtures have proven to be less effective as the pure metal catalystsgao2012pd ; liu2013defective . Another alloy that researchers have studied is a palladium nickel alloylim2013density . The Pd-Ni alloy was only an effective catalyst if the oxygen molecules were adsorbed by the palladiumphillips2018chemoselective . Silver is also being studied as a possible nanoparticle catalyst; however, silver has a very high adsorption energy, so it is not a good catalystwu2017activity . Emerging research details the use of a silver-copper mixture, usually Ag12Cu, but this alloy is not as effective as Pt or Pdzhang2017activity ; li2013density .
Because researchers have not been able to find a new catalyst by doping platinum and palladium, they have investigated the catalytic properties of two-dimensional (2D) monolayers.
Some of these new 2D materials were classified as Transition Metal Dichalcogenides (TMDs). TMDs can be represented as MX2 where M represents molybdenum or tungsten, and X represents sulfur, selenium, or tellerium. These TMDs are highly reactive due to their buckling heightchhowalla2013chemistry . TMDs have been studied as catalysts for fuel cells2005biomimetic , but experiments have shown that the X atom is not an active adsorption site, which means that the MX2 is highly unstable after the oxygen is adsorbed on the X atomwang2015transition . In order to make the MX2 more reactive, the TMD could be improved by using substitutional doping with transition metals, such as cobalt, nickel, zinc or copperelizondoco .
We chose MoS2 as our TMD because of its high reactivity and low cost. We are currently unaware of studies that have used both doping and vacancies to adsorb O. Therefore, our objective is to determine whether the catalytic properties of MoS2 can be improved through a combination of substitutional doping and sulfur vacancies. Specifically, we doped with Iron (Fe), Cobalt (Co), Nickel (Ni), Copper (Cu), Rhodium (Rh), Silver (Ag), and Iridium (Ir). We calculate the adsorption energy of O and the Projected Density of States for each compound.
In Section II, we detailed our methods to perform first-principle calculations. In Sec. III, we present our results on the adsorption energies. In Sec. IV, we discuss and compare our results with experimental and other theoretical research. Finally, our conclusion and future work are found in Sec. V.
II Methods
II.1 Computational Methods
We conducted first-principles calculations based on density functional theory (DFT) using the ABINITgonze2016 code. We used pseudopotentials in projector augmented-wave (PAW) approximationsblochl1994projector and exchange correlation functionals using the Generalized Gradient Approximation in Perdew-Burke-Ernzehorf approximation (GGA-PBE)perdew1996generalized . These projectors were compiled using the AtomPAW softwareholzwarth2001projector . The electron configuration and radius cutoff to generate the PAW pseudopotentials are shown in Table 1.
II.2 Convergence and Relaxation
The kinetic energy cutoff and Monkhorst-Pack k-point grids were converged for all materials. The self-consistent field (SCF) total energy tolerance was set as 1.0 Hartree. Once this tolerance was reached twice consecutively, the SCF iterations were terminated. The kinetic energy cutoff and Monkhorst-Pack k-point grids were considered converged when the differences in total energies were less than 1.0 Ha ( 3 meV) twice consecutively. With the converged values, we performed a structural relaxation using the Broyden-Fletcher-Goldfarb-Shanno (BFGS) algorithm to determine the atomic positions and lattice constants of the material. The relaxation finished when the maximum absolute force on each atom was less than 5.0 Hartree/Bohr. The maximum dilation of the atomic positions from the initial position with each SCF step was 1.05. All structures were fully relaxed. Using these converged values, we calculated the total energy of the system.
II.3 Materials
We used the hexagonal monolayer crystal structure of MoS2 in this study. To adsorb oxygen onto these materials, we used a 22 supercell and we placed the oxygen in the middle of the crystal, on the molybdenum atom, and on the sulfur atom. The converged kinetic energy cutoff and k-point mesh was 29 Hartree and respectively.
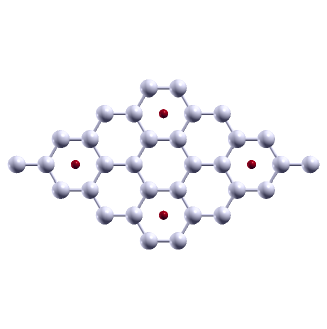
A palladium monolayer was also used as a catalyst because many automobiles today use Pd-based catalysts. We wanted to compare the adsorption energies of O on Pd to the adsorption energies of O on the doped MoS2 to examine the efficiency of the MoS2. The palladium monolayer discovered by Shah et al.shah2017oxygen was used to adsorb oxygen. The hexagonal monolayer crystal structure shown in Figure 3 was used. Oxygen was placed on top of the Pd atom and at the center of the hexagonal monolayer 22 cell. The converged kinetic energy cutoff and k-point mesh was 29 and respectively.
We used Fe, Ni, Co, Cu, Ag, Ir and Rh as our dopants. To dope the MoS2, we used a 22 cell with 12 atoms. First, the plane wave kinetic energy cutoff of the dopant was converged. These converged cutoffs are shown in Table 2. We compared this to the energy cutoff of the MoS2 and used the larger value in our total energy calculations. One sulfur atom was then replaced with a transition metal, and the system was fully relaxed. We added an oxygen atom on top of the transition metal and then relaxed the lattice constants. The doping percentage was increased from 8.3% to 9.1% by introducing a sulfur vacancy. In order to create sulfur vacancies in the doped MoS2, we removed the sulfur atom closest to the dopant. After this structure was fully relaxed, we added an oxygen atom to the same location where the sulfur atom was before.
II.4 Adsorption Energy
We calculated the adsorption energy of our materials on oxygen. We calculated the total energy of the cell, and then recalculated it after placing an oxygen atom inside the crystal. Adsorption energies were calculated using the following formula:
| (1) |
where , , , and represent the adsorption energy, energy of the monolayer MoS2 after adsorption, the energy of the monolayer MoS2 before adsorption, and the energy of the oxygen atom respectively. Because oxygen is a diatomic gas, which means that it occurs naturally as O2, we calculate the total energy of one oxygen atom by dividing the total energy of O2 by 2.
II.5 Projected Density Of States
We also calculated the Projected Density of States (PDOS). We plotted the PDOS of the orbital of the dopant and the orbital of the oxygen. Before adsorption occurs, we plot the orbital of the dopant to identify if there were partially occupied d orbitals near the Fermi level. The Fermi level was set to 0 for all of our PDOS graphs. After adsorption, we plotted the 2p orbital from the oxygen as well as the d orbital of the dopant. We looked for strong hybridization, which occurs when the and orbitals from the oxygen and dopant respectively rise and fall at the same time.
III Results and Discussion
First, we analyze the catalytic properties of pristine MoS2 and Pd monolayers. We then present our results from the calculations pertaining to the doped MoS2 and the doped MoS2 with sulfur vacancies.
III.1 Pristine Substrates
III.1.1 MoS2
Figure 2 shows the atomic structure of MoS2 before and after adsorbing oxygen. The figure shows the front and side views of the three adsorption sites. Figure 2 (a) shows the front and side views of the oxygen adsorbed in the center of the cell, (b) shows the front and side views of the oxygen adsorbed on the molybdenum atom, and (c) shows the front and side views of the oxygen adsorbed on top of the sulfur atom.
We also measured the bond lengths and bond angles of the MoS2. The relaxed lattice constants used was 5.98 Bohr, which is in good agreement with experimental values (5.97 Bohr)ataca2011comparative . We measured the S-Mo-S bond angle to be 80.51 degrees, which has a 0.04% errorkadantsev2012electronic .
Using the relaxed lattice constants, total energy calculations were conducted. These energy values were then used in Equation 1 to calculate the adsorption energy of oxygen on the supercell of the material. A negative adsorption energy indicated that the material used was stable, as it did not gain energy after adsorbing an oxygen atom, and an exothermic reaction occurred. Conversely, positive adsorption energies indicated that an endothermic reaction occurred and the material was less stable as it gained heat. We looked for materials that had a negative adsorption energy with a large magnitude, which indicated that the bond between the oxygen and material was very strong. The adsorption energies calculated for the MoS2 are shown in Table 3. These values show that the best adsorption site for oxygen on a MoS2 sheet is on top of the Molybdenum atom. When the oxygen is put on the sulfur, the oxygen is very unstable, and has a low adsorption energy at 0.825 eV. This is in agreement with past studies as other calculations show that the sulfur is not an active adsorption site, because the oxygen is very unstable when placed on the sulfurwang2015transition .
III.1.2 Palladium
Figure 3 shows the atomic structure of the 22 hexagonal monolayer for Pd. We considered two adsorption sites for the palladium hexagonal monolayer. We placed the oxygen on one of the Pd atoms and in the middle of the hexagonal supercell. These adsorption sites are also shown in Figure 3. Figure 3 (a) shows the top view of the Pd monolayer with the oxygen adsorbed in the center, and Figure 3 (b) shows the top view of the Pd monolayer with the oxygen adsorbed on the Pd atom. We also calculated the lattice constants of the Pd monolayer. Our relaxed lattice parameter was 17.03 Bohr, which has a 0.1% error when compared to the experimental values.
We found that our palladium monolayer had very similar adsorption energies to previous studies, because past research shows that the adsorption energy of one oxygen atom on the Pd atom is -2.21 eVshah2017oxygen . Our study shows that the adsorption energy of O on Pd is -2.19 eV and -2.22 eV when the O was placed in the center of the cell and on the Pd atom respectively, which is in good agreement with Shah. et alshah2017oxygen .
III.2 Doping and Vacancies
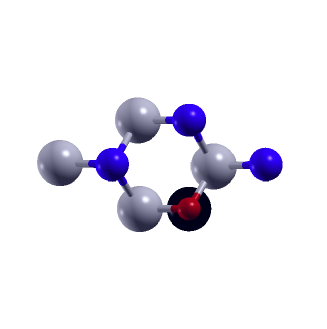
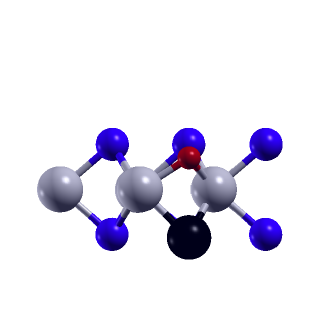
After the MoS2 was substitutionally doped with the transition metals, two adsorption sites were considered. The doped MoS2 is shown in Figure 4 (a). We measure the adsorption energy of the oxygen on the MoS2 after putting it on the dopant atom, as shown in Figure 4 (b). Figure 4 (c) shows the doped MoS2 after the oxygen is adsorbed in a sulfur vacancy.
After the oxygen molecule is adsorbed onto the doped MoS2 sheets, the crystal structure changes significantly. Although the atomic radii of the dopants are larger than that of the sulfur atom, the TM dopants only slightly protrude from the molybdenum disulfide 0.04 Åto 0.25 Å. The average bond lengths between the Mo and dopant increased, after adsorption. These values are shown in Table 4.
III.3 Oxygen adsorption
III.3.1 O adsorption on Rh and Ir doped MoS2
From Table 5, it can be shown that the adsorption energy of O on Rh and Ir doped MoS2 is very strong, with a magnitude of more than -4.5 eV. After a sulfur vacancy was introduced, the adsorption energy decreased below -6.8 eV. This is also shown in Table 4, as the change in Mo-dopant bond length and the change in S-Mo-dopant angle of the Ir and Rh are greater than the change in bond length or bond angle for any other dopant. The strong interaction significantly activates the adsorbed molecule.
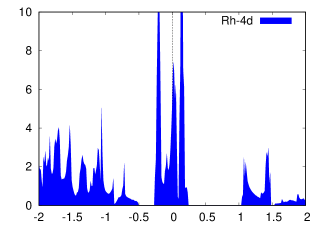
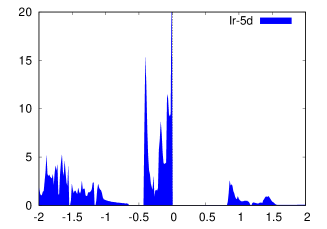
The analyses of electronic structures were performed in Figure 5. We plotted the DOS of the 5d orbital for the Ir and the 4d orbital for the Rh. Previous studies suggest that the interaction of oxygen with the center of the transition metal dopants involves the electron transfer between each otherma2015co . This means that partially occupied orbitals near the Fermi level are crucial to adsorb and activate O molecules as these orbitals facilitate the electron transfer from the substrate to the adsorbed O. Figure 5 shows that the Ir and Rh have partially occupied orbitals near the Fermi level, which shows that Ir and Rh have low adsorption energies.
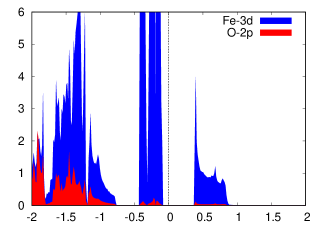
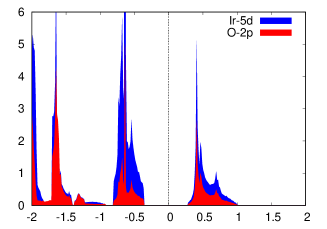
After adsorption, we also calculate the PDOS for the orbital of the dopant and the orbital of the O. We looked for a strong hybridization in the DOS, which is shown by the simultaneous rise and fall of the and orbitals for the dopant and O respectively. This DOS is shown in Figure 5 (c) and 5 (d). Rh and Ir both have strong hybridization with the orbital of the O. The projected density of states for the Ir and Rh intersect the orbital of the O at approximately -1.5 eV. The Rh orbital also intersects the O orbital at 0.5 eV.
These low adsorption energies are in agreement with previous studies as Ir and Rh doped MoS2 were effective catalysts to adsorb O2ma2016modulating . Ma et al. also found that the Ir and Rh had partially occupied orbitals at the Fermi level, and that the crystal structure of Ir and Rh doped MoS2 changed notably after adsorption ocurredma2016modulating . Fan et al.fan2017dft also found that the Ir and Rh doped systems exhibited strong hybridization between the dopant and O as the orbitals occupied the same state and energy level. Past studies also indicate that the PDOS of these two dopants and the O strongly interact as the Projected Density of States intersects that of the O orbitalma2015co . This supports our data as the PDOS shows a strong hybridization between the dopant and the oxygen.
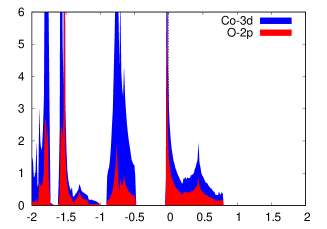
III.3.2 O adsorption on Fe and Co doped MoS2
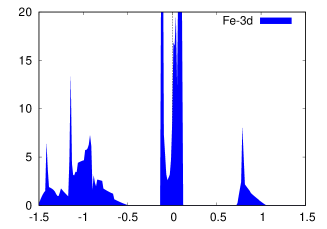
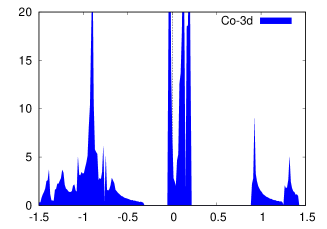
Iron and Cobalt were also very good catalysts as the adsorption energy of O on the Fe and Co-MoS2 was greater than -4 eV, as shown in Table 5. This adsorption energy sharply decreased below -6.7 eV Both of these materials had partially occupied orbitals around the Fermi level, as shown in Figure 6. These materials were slightly worse catalysts than Ir and Rh doped MoS2 due to the weaker hybridization of the orbitals, shown in Figure 6 (c) and 6 (d). There is also no intersection between the 2p and 3d orbitals of the O and dopant respectively. Iron has very weak hybridization above -0.5 eV, and Co has weak hybridization between -2 and -1.5 eV. A strond bond still forms between these dopants and the O as the crystal structure changed significantly after adsorption ocurred. The change in the molybedum-dopant bond length was very large for both Co and Fe doped MoS2 at 0.10 and 0.11 Årespectively. The bond angle between the S-Mo-dopant also increased drastically at 3.72 and 3.39 degrees for Co and Fe separately. This shows that the O was strongly bonded to the doped MoS2 because the bond lengths in the doped MoS2 increased.
Previous studies show that cobalt doped MoS2 had a very low adsorption energy when adsorbing O2xiao2015functional ; fan2017dft . Ma et al. found that the adsorption energy of oxygen on cobalt doped molybdenum disulfide was very similar to that of iridium or rhodium doped MoS2. Our study shows that the adsorption of O on Co-MoS2 is not as strong at the adsorpion of O on Ir or Rh-MoS2, but this difference could have been caused by the difference in the adsorbate used. Ma et al.ma2016modulating did find that the interaction between O2 and Co was weaker than the interaction between the O2 and the Rh or Ir. This supports the data in our PDOS as the co and O orbitals are not as strongly hybridized as the Rh or Ir orbitals and the O.
Past research concerning iron doped MoS2 has shown that Fe-MoS2 is an effective catalyst to adsorb O2, NO2 and COfan2017dft ; ma2015co ; chen . Chen et al.chen determined that the adsorption of gases on Fe doped MoS2 is very strong, as the crystal structure changes significantly. This is in good agreement with our results in Table 4. Fan et al. found that iron and cobalt exhibit similar catalytic properties, which validates the findings in our study. However, Fan et al. concluded that Fe and Co doped MoS2 were more effective catalysts than Ir and Rh doped MoS2. We can attribute this difference to the adsorbate used in the study. Ma et al.ma2015co found that the adsorption of CO on Fe-doped MoS2 did not produce strongly hybridized peaks even though Fe had a strong bond with the CO, which supports our data as we did not find strongly hybridized peaks.
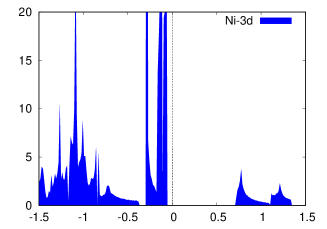
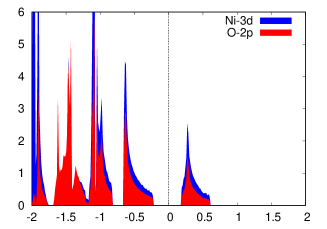
III.3.3 O adsorption on Ni doped MoS2
The adsorption energy of O on Ni is not as large as the adsorption energy of Co and Fe. With an adsorption energy of around -3.3 and -6.6 eV before and after adsorption respectively, the adsorption energy of O on Ni is slightly larger than that of Fe and Co. However, the PDOS does not have any peaks near the Fermi level, as shown in Figure 7 (a). The strong bond between the Ni is not caused by a partially occupied orbital, rather it is caused by the strong hybridization between the and orbitals from the O and Ni respectively, which is shown in Figure 7 (b). Furthermore, the p and d orbitals from the O and Ni intersect between -2 and -1.5. This indicates that a strong bond occurs, as the valence electrons of the Ni and O have the same energy level.
The low adsorption energy of O on Ni agrees with previous studies conducted by Xiao et alxiao2015functional . Xiao et al. found that the Ni did not have partially occupied orbitals, but concluded that the charge transfer between the Ni and O made Ni-MoS2 a good catalyst. Xiao et al. did not study the hybridization between the O and Ni orbitals. However, Ma et al.ma2016modulating found that Ni did not bond strongly to oxygen and did not hybridize strongly. This discrepancy can be attributed to the different asdorbate. The bond between the Ni-O is stronger than the bond between Ni and O2 because all of the electrons in O2 are in bonding orbitals and more energy is needed to excite the oxygen. Our adsorption energy of O on Ni-MoS2 was -3.28 eV, which is in good agreement with previous dataxiao2015functional (-3.23 eV). Our value has a 1.5% error when compared to previous results.
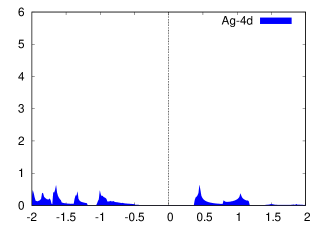
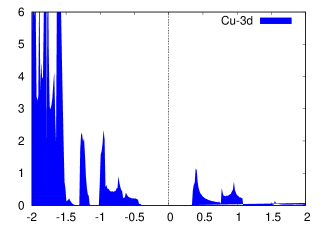
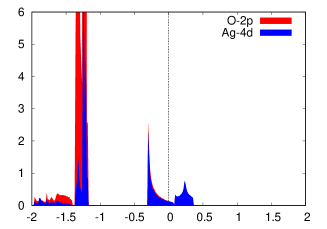
III.3.4 O adsorption on Ag and Cu doped MoS2
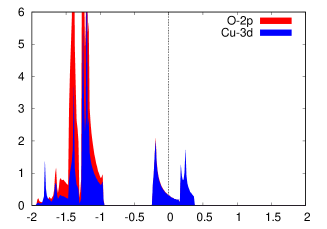
The adsorption of O on Ag and Cu is relatively weak when compared to the other dopants. With adsorption energies of -1.18 and -2.01 eV respectively, the bond between these 2 metals and O is not as strong as the Ni-O bond. After sulfur vacancies are induced, this adsorption energy decreases to -6.28 and -6.48 eV for Ag and Cu respectively, as shown in Table 5. Neither Ag nor Cu have partially occupied orbitals near the Fermi level. This is shown in Figure 8 as the silver and copper doped MoS2 do not have active orbitals. The adsorbed oxygen only modifies the crystal structure slightly, as the bond lengths only change by 0.04 and 0.01 Åfor Cu and Ag respectively. The change in the S-Mo-dopant bond angle is also very small at 1.09 and 1.62 degrees for Ag and Cu respectively. This small change in the crystal structure shows that the Cu and Ag do not strongly bond to the O. The crystal structure changes more for the Cu doped MoS2 than for the Ag doped MoS2, which is caused by the stronger hybridization between the Cu and O.
The hybridization of Ag is also very weak, as shown in Figure 8 (c), which explains the very low adsorption energy of O on Ag doped MoS2. There is no correlation between the peaks of the orbital of the O and the orbital of the Ag. The hybridization of the Cu is stronger, as shown in Figure 8 (d). There is a correlation between the peaks of the Cu and O for most values below 0 eV. However, no hybridization occurs above 0 eV.
The low adsorption energy is in agreement with literature, as previous studies show that Ag-MoS2 did not exhibit strong catalytic propertiesma2016modulating ; fan2017dft ; chen . However, past studies show that Cu-MoS2 was a good catalyst to adsorb NO2fan2017dft . The disparity between the results can be attributed to a strong bond between the Cu and N. Chen et al.chen found that the crystal structure of the Cu doped MoS2 does not change as much as the Ni-MoS2 after asdorption occurs. Chen at al.chen also observed that the NO2 did not contribute significantly to the DOS after adsorption, highlighting that there was little to no hybridization between the O orbitals and the Cu orbitals, which is in agreement with our data.
IV Conclusion
In this study, we use Density Functional Theory to investigate the effect of substitutional doping with TM atoms (Fe, Co, Ni, Cu, Rh, Ag, Ir) and sulfur vacancies on the electronic structure and catalytic properties of monolayer MoS2. The Ir, Rh, Fe, Co and Ni-MoS2 were better catalysts than the Pd monolayer as they had lower adsorption energies than the Pd. Our results suggest that Ir and Rh-MoS2 have a strong bond with the oxygen, showing that they can break the carbon-oxygen bond in CO. This is mainly caused by the partially occupied orbital near the Fermi level, which is used to activate and adsorb O, and the strong hybridization between these dopants and O. A stronger hybridization indicates that the bond length decreases and the bond strength increases. We find that Fe and Co doped MoS2 could also strongly adsorb O due to the partially occupied orbitals at the Fermi level. However, the hybridization between these dopants and O was not as strong as the hybridization between the Ir or Rh and O. Ni also had a low adsorption energy, but this was caused by the hybridization rather than the occupied orbital. Ag-MoS2 and Cu-MoS2 had the weakest adsorption energies as they had neither partially occupied orbitals nor a strong hybridization. These two dopants were not as effective as Pd. After sulfur vacancies were induced in the doped Mo2 sheets, the adsorption energy of O on the MoS2 decreased drastically, showing that the doped MoS2 with S vacancies was a much better catalyst than the traditionally used palladium monolayer.
Therefore, we conclude that a combination of doping and introducing sulfur vacancies could drastically improve the catalytic properties of MoS2 monolayers. In the future, we would like to dope the MoS2 with more transition metals that have similar electron configrations as Pd. We would also calculate the adsorption energy of various greenhouse gases on the MoS2. This study shows that creating vacancies and doping can lead to the discovery of novel nanoparticle catalysts.
References
- [1] T. Searchinger, R. Heimlich, R. A. Houghton, F. Dong, A. Elobeid, J. Fabiosa, S. Tokgoz, D. Hayes, and T.-H. Yu, “Use of us croplands for biofuels increases greenhouse gases through emissions from land-use change,” Science, vol. 319, no. 5867, pp. 1238–1240, 2008.
- [2] A. Ernst and J. D. Zibrak, “Carbon monoxide poisoning,” New England Journal of Medicine, vol. 339, no. 22, pp. 1603–1608, 1998.
- [3] J. A. Raub, M. Mathieu-Nolf, N. B. Hampson, and S. R. Thom, “Carbon monoxide poisoning—a public health perspective,” Toxicology, vol. 145, no. 1, pp. 1–14, 2000.
- [4] L. W. Kao and K. A. Nañagas, “Carbon monoxide poisoning.,” The Medical Clinics of North America, vol. 89, no. 6, pp. 1161–1194, 2005.
- [5] L. K. Weaver, “Carbon monoxide poisoning,” New England Journal of Medicine, vol. 360, no. 12, pp. 1217–1225, 2009.
- [6] G. L. Gaines Jr and H. C. Thomas, “Adsorption studies on clay minerals. ii. a formulation of the thermodynamics of exchange adsorption,” The Journal of Chemical Physics, vol. 21, no. 4, pp. 714–718, 1953.
- [7] O. S. Deshmukh, D. van den Ende, M. C. Stuart, F. Mugele, and M. H. Duits, “Hard and soft colloids at fluid interfaces: Adsorption, interactions, assembly & rheology,” Advances in Colloid and Interface Science, vol. 222, pp. 215–227, 2015.
- [8] H. Tsunoyama, H. Sakurai, N. Ichikuni, Y. Negishi, and T. Tsukuda, “Colloidal gold nanoparticles as catalyst for carbon- carbon bond formation: application to aerobic homocoupling of phenylboronic acid in water,” Langmuir, vol. 20, no. 26, pp. 11293–11296, 2004.
- [9] J. Li, W. Liu, X. Wu, and X. Gao, “Mechanism of ph-switchable peroxidase and catalase-like activities of gold, silver, platinum and palladium,” Biomaterials, vol. 48, pp. 37–44, 2015.
- [10] F. Gauthard, F. Epron, and J. Barbier, “Palladium and platinum-based catalysts in the catalytic reduction of nitrate in water: effect of copper, silver, or gold addition,” Journal of Catalysis, vol. 220, no. 1, pp. 182–191, 2003.
- [11] Y. Zhou, K. Neyerlin, T. S. Olson, S. Pylypenko, J. Bult, H. N. Dinh, T. Gennett, Z. Shao, and R. O’Hayre, “Enhancement of pt and pt-alloy fuel cell catalyst activity and durability via nitrogen-modified carbon supports,” Energy & Environmental Science, vol. 3, no. 10, pp. 1437–1446, 2010.
- [12] J. Zhang, H. Jin, M. B. Sullivan, F. C. H. Lim, and P. Wu, “Study of pd–au bimetallic catalysts for co oxidation reaction by dft calculations,” Physical Chemistry Chemical Physics, vol. 11, no. 9, pp. 1441–1446, 2009.
- [13] F. Gao and D. W. Goodman, “Pd–au bimetallic catalysts: understanding alloy effects from planar models and (supported) nanoparticles,” Chemical Society Reviews, vol. 41, no. 24, pp. 8009–8020, 2012.
- [14] X. Liu, C. Meng, and Y. Han, “Defective graphene supported mpd12 (m= fe, co, ni, cu, zn, pd) nanoparticles as potential oxygen reduction electrocatalysts: a first-principles study,” The Journal of Physical Chemistry C, vol. 117, no. 3, pp. 1350–1357, 2013.
- [15] F. C. Lim, J. Zhang, H. Jin, M. B. Sullivan, and P. Wu, “A density functional theory study of co oxidation on pd-ni alloy with sandwich structure,” Applied Catalysis A: General, vol. 451, pp. 79–85, 2013.
- [16] J. M. Phillips, M. Ahamed, X. Duan, R. N. Lamb, X. Qu, K. Zheng, J. Zou, J. M. Chalker, and C. L. Raston, “Chemoselective and continuous flow hydrogenations in thin films using a palladium nanoparticle catalyst embedded in cellulose paper,” ACS Applied Bio Materials, vol. 2, no. 1, pp. 488–494, 2018.
- [17] X. Wu, F. Chen, N. Zhang, Y. Lei, Y. Jin, A. Qaseem, and R. L. Johnston, “Activity trends of binary silver alloy nanocatalysts for oxygen reduction reaction in alkaline media,” Small, vol. 13, no. 15, p. 1603387, 2017.
- [18] N. Zhang, F. Chen, X. Wu, Q. Wang, A. Qaseem, and Z. Xia, “The activity origin of core–shell and alloy agcu bimetallic nanoparticles for the oxygen reduction reaction,” Journal of Materials Chemistry A, vol. 5, no. 15, pp. 7043–7054, 2017.
- [19] W. Li and F. Chen, “A density functional theory study of structural, electronic, optical and magnetic properties of small ag–cu nanoalloys,” Journal of Nanoparticle Research, vol. 15, no. 7, p. 1809, 2013.
- [20] M. Chhowalla, H. S. Shin, G. Eda, L.-J. Li, K. P. Loh, and H. Zhang, “The chemistry of two-dimensional layered transition metal dichalcogenide nanosheets,” Nature Chemistry, vol. 5, no. 4, p. 263, 2013.
- [21] B. Hinnemann, P. G. Moses, J. Bonde, K. P. Jørgensen, J. H. Nielsen, S. Horch, I. Chorkendorff, and J. K. Nørskov, “Biomimetic hydrogen evolution: Mos2 nanoparticles as catalyst for hydrogen evolution,” Journal of the American Chemical Society, vol. 127, no. 15, pp. 5308–5309, 2005.
- [22] H. Wang, C. Tsai, D. Kong, K. Chan, F. Abild-Pedersen, J. K. Nørskov, and Y. Cui, “Transition-metal doped edge sites in vertically aligned mos 2 catalysts for enhanced hydrogen evolution,” Nano Research, vol. 8, no. 2, pp. 566–575, 2015.
- [23] N. Elizondo, L. H. Verastegui-Domínguez, M. A. A. García, D. I. Martínez-Delgado, A. P. Sanchez-Espinoza, and E. Torres-López, “Co-ni-mos2 nanoparticles grown on graphene: An advanced catalyst for the hydrogen production,”
- [24] X. Gonze, F. Jollet, F. Abreu Araujo, D. Adams, B. Amadon, T. Applencourt, C. Audouze, J.-M. Beuken, J. Bieder, A. Bokhanchuk, E. Bousquet, F. Bruneval, D. Caliste, M. Côté, F. Dahm, F. Da Pieve, M. Delaveau, M. Di Gennaro, B. Dorado, C. Espejo, G. Geneste, L. Genovese, A. Gerossier, M. Giantomassi, Y. Gillet, D. Hamann, L. He, G. Jomard, J. Laflamme Janssen, S. Le Roux, A. Levitt, A. Lherbier, F. Liu, I. Lukačević, A. Martin, C. Martins, M. Oliveira, S. Poncé, Y. Pouillon, T. Rangel, G.-M. Rignanese, A. Romero, B. Rousseau, O. Rubel, A. Shukri, M. Stankovski, M. Torrent, M. Van Setten, B. Van Troeye, M. Verstraete, D. Waroquiers, J. Wiktor, B. Xu, A. Zhou, and J. Zwanziger, “Recent developments in the ABINIT software package,” Comput. Phys. Commun., vol. 205, pp. 106–131, August 2016.
- [25] P. E. Blöchl, “Projector augmented-wave method,” Physical review B, vol. 50, no. 24, p. 17953, 1994.
- [26] J. P. Perdew, K. Burke, and M. Ernzerhof, “Generalized gradient approximation made simple,” Physical Review Letters, vol. 77, no. 18, p. 3865, 1996.
- [27] N. Holzwarth, A. Tackett, and G. Matthews, “A projector augmented wave (paw) code for electronic structure calculations, part i: atompaw for generating atom-centered functions,” Computer Physics Communications, vol. 135, no. 3, pp. 329–347, 2001.
- [28] J. Shah, S. Kansara, S. K. Gupta, and Y. Sonvane, “Oxygen adsorption on palladium monolayer as a surface catalyst,” Physics Letters A, vol. 381, no. 36, pp. 3084–3088, 2017.
- [29] C. Ataca, M. Topsakal, E. Akturk, and S. Ciraci, “A comparative study of lattice dynamics of three-and two-dimensional mos2,” The Journal of Physical Chemistry C, vol. 115, no. 33, pp. 16354–16361, 2011.
- [30] E. S. Kadantsev and P. Hawrylak, “Electronic structure of a single mos2 monolayer,” Solid State Communications, vol. 152, no. 10, pp. 909–913, 2012.
- [31] D. Ma, Y. Tang, G. Yang, J. Zeng, C. He, and Z. Lu, “Co catalytic oxidation on iron-embedded monolayer mos2,” Applied Surface Science, vol. 328, pp. 71–77, 2015.
- [32] D. Ma, W. Ju, T. Li, X. Zhang, C. He, B. Ma, Y. Tang, Z. Lu, and Z. Yang, “Modulating electronic, magnetic and chemical properties of mos2 monolayer sheets by substitutional doping with transition metals,” Applied Surface Science, vol. 364, pp. 181–189, 2016.
- [33] Y. Fan, J. Zhang, Y. Qiu, J. Zhu, Y. Zhang, and G. Hu, “A dft study of transition metal (fe, co, ni, cu, ag, au, rh, pd, pt and ir)-embedded monolayer mos2 for gas adsorption,” Computational Materials Science, vol. 138, pp. 255–266, 2017.
- [34] B. Xiao, P. Zhang, L. Han, and Z. Wen, “Functional mos2 by the co/ni doping as the catalyst for oxygen reduction reaction,” Applied Surface Science, vol. 354, pp. 221–228, 2015.
- [35] Z. Chen, L. Zhang, Y. Li, and J. Ren, “Adsorption of no2 on monolayer mos2 doped with fe, co, and ni, cu: A first-principles study,” Results in Physics, 2019.
| Material | Electron Configuration | PAW radius cutoff (Bohr) |
|---|---|---|
| Oxygen | [He] 2s2 2p4 | 1.4 |
| Sulfur | [Ne] 3s2 3p4 | 1.9 |
| Iron | [Ne] 3s2 3p6 4s1 3d7 | 2.1 |
| Cobalt | [Ne] 3s2 3p6 4s1 3d8 | 2.1 |
| Nickel | [Ne] 3s2 3p6 4s2 3d8 | 1.8 |
| Copper | [Ne] 3s2 3p6 4s1 3d10 | 2.0 |
| Rhodium | [Ar 3d10] 4s2 4p6 5s1 4d8 | 2.2 |
| Palladium | [Ar 3d10] 4s2 4p6 5s1 4d9 | 2.5 |
| Silver | [Kr] 5s1 4d10 | 2.5 |
| Iridium | [Kr 5s2 4d10 4f14] 5p6 6s1 5d8 | 2.5 |
| Material | Crystal Structure | Energy Cutoff (Ha) |
|---|---|---|
| Fe | BCC | 23 |
| Co | Simple Hexagonal | 24 |
| Ni | FCC | 40 |
| Cu | FCC | 22 |
| Rh | FCC | 16 |
| Ag | FCC | 16 |
| Ir | FCC | 19 |
| Location | Adsorption Energy (eV) |
|---|---|
| Center | -1.105 |
| Oxygen on Mo atom | -2.58 |
| Oxygen on S atom | 0.825 |
| Sulfur Vacancy | -2.241 |
| Dopant | Increase in dopant-Mo-S bond angle | Increase in Mo-dopant bond length (Å) |
| Ir | 4.02∘ | 0.21 |
| Rh | 3.83∘ | 0.19 |
| Co | 3.72∘ | 0.11 |
| Ag | 1.09∘ | 0.01 |
| Cu | 1.62∘ | 0.04 |
| Fe | 3.39∘ | 0.10 |
| Ni | 3.82∘ | 0.19 |
| Dopant | Oxygen Location | Oxygen Adsorption Energy (eV) |
|---|---|---|
| Ag | On Ag | -1.18 |
| Ag | Sulfur vacancy | -6.28 |
| Cu | On Cu | -2.01 |
| Cu | Sulfur vacancy | -6.48 |
| Co | On Co | -4.02 |
| Co | Sulfur vacancy | -6.72 |
| Ni | On Ni | -3.28 |
| Ni | Sulfur vacancy | -6.58 |
| Fe | On Fe | -4.05 |
| Fe | Sulfur vacancy | -6.74 |
| Ir | On Ir | -4.58 |
| Ir | Sulfur vacancy | -6.91 |
| Rh | On Rh | -4.52 |
| Rh | Sulfur vacancy | -6.88 |
![[Uncaptioned image]](/html/1908.10350/assets/x5.png)
![[Uncaptioned image]](/html/1908.10350/assets/x6.png)
![[Uncaptioned image]](/html/1908.10350/assets/x7.png)
(
a)![[Uncaptioned image]](/html/1908.10350/assets/x8.png) (b)
(b)![[Uncaptioned image]](/html/1908.10350/assets/x9.png) (c)
(c)![[Uncaptioned image]](/html/1908.10350/assets/x10.png)
![[Uncaptioned image]](/html/1908.10350/assets/x13.png)
![[Uncaptioned image]](/html/1908.10350/assets/x14.png)
![[Uncaptioned image]](/html/1908.10350/assets/x15.png)
(
a)![[Uncaptioned image]](/html/1908.10350/assets/x16.png) (b)
(b)![[Uncaptioned image]](/html/1908.10350/assets/x17.png) (c)
(c)![[Uncaptioned image]](/html/1908.10350/assets/x18.png)