Enhancement of the upper critical field in the cubic Laves-phase superconductor HfV2 by Nb doping
Abstract
We report the effect of Nb doping on the upper critical field of the cubic Laves-phase superconductor HfV2 studied in a series of HfV2-xNbx samples with 0 0.3 under pulsed fields up to 30 T. The undoped HfV2 undergoes a martensitic structural transition around 110 K, and becomes superconducting below = 9.4 K. Upon Nb doping, while the structural transition is suppressed for 0.1, a maximum in of 10.1 K and zero-temperature upper critical field (0) of 22.4 T is found at = 0.2, which is ascribed to an increase of the density of states at the Fermi level. For all samples, the temperature dependence of can be well described by the Werthamer-Helfand-Hohenberg (WHH) theory that takes into account both the spin paramagnetic effect and spin orbit scattering. In addition, a comparison is made between the behavior of HfV2-xNbx and those of Nb-Ti and Nb3Sn.
1 Introduction
HfV2 based superconductors with the C15 cubic Laves-phase structure have received considerable attention because of their potential as high-field superconducting magnets [1, 2]. Similar to A15-type Nb3Sn, HfV2 undergoes a martensitic transition involving two successive structural modifications from cubic to tetragonal then to orthorhombic in the temperature range between 100 to 115 K [3], followed by a superconducting transition below 9 K [4]. Despite its relatively low , the upper critical field of HfV2 has been found to be 20 T at 4.2 K, and can be improved to 23 T by alloying with ZrV2 [5], which is the highest for superconductors composed only of transition metal elements. Furthermore, compared with Nb3Sn, the HfV2-based C15 compounds are more resistant to neutron radiation [6] and less brittle [7], which make them promising for application in nuclear fusion reactor.
For superconductors with spin-singlet Cooper pairs, superconductivity(SC) can be destroyed by the application of magnetic field via two effects. The first one is the orbit effect, which is a manifestation of the Lorentz force. The second one is the spin paramagnetic effect, which tends to align the spin of Cooper pairs and can be partially cancelled out by introducing the spin-orbit scattering. The investigation of the has been shown to provide valuable information on the contributions from these effects [8, 9, 10]. In the case of Hf1-xZrxV2, the value was measured across 0 1, by only at 4.2 K [5]. In addition to Zr, various other dopants, such as Ta [11], Nb [12], Fe [13], Co [13], Ni [13], have been introduced in the HfV2 system to investigate the impurity effect on superconductivity and structural transition. For example, dilute Nb doping ( 5%) is found to suppress the structural transition and increase [12]. However, no systematic study on the temperature and doping dependencies of has been reported for any of these dopants.
In this paper, we present a study on the superconducting properties of HfV2-xNbx for in the range of 0 to 0.3, focusing on the () behavior. Bulk SC with indication of strong coupling nature is observed in this range, and a maximum of 10.1 K is found at = 0.2. The () data for all values are well fitted by the WHH model including the effects of spin paramagnetism and spin orbit scattering. The extrapolated (0) exhibits a maximum of 22.4 T also at = 0.2, which is 4.1 T higher than that of undoped HfV2. The enhancement of both and (0) is attributed to an enhanced density of states of the Fermi level [], as revealed by the specific heat results. We also compare the () curve at the optimal doping with those of Nb0.44Ti0.56 and Nb3Sn, and discuss its implication on the improvement.
2 Experimental details
Polycrystalline HfV2-xNbx samples with = 0, 0.1, 0.2, 0.3 were prepared by the arc-melting method. High purity Hf slugs (99.9%), V (99.99%, 200 mesh) and Nb (99.99%, 200 mesh) powders were weighed according to the stoichiometric ratio and melted in an arc furnace under high-purity argon atmosphere. The melts were turned over and remelted by the same procedure several times to ensure homogeneity, following by rapid cooling on a water-chilled copper plate. The samples were used as cast without further annealing treatment, which was reported to result in degradation [14]. The phase purity of the samples was checked by powder x-ray diffraction (XRD) using a Bruker D8 Advance x-ray diffractometer with Cu K radiation at room temperature. The chemical composition of theses samples was examined with an energy-dispersive x-ray (EDX) spectrometer (Model Octane Plus) affiliated to a Zeiss Supratm 55 schottky field emission scanning electron microscope (SEM). The spectra were collected on at least 3 different locations of each sample for averaging. The electrical resistivity was measured using a standard four-probe method. Resistivity and specific heat measurements down to 1.8 K and up to 9 T were carried out on regular-shaped samples in a Quantum Design PPMS-9 Dynacool. The magnetoresistance under pulsed fields up to 30 T was measured at the National High Magnetic Field Center in Wuhan. The dc magnetization measurements down to 1.8 K were performed using a commercial SQUID magnetometer (Quantum Desgin MPMS3).
3 Results and Discussion
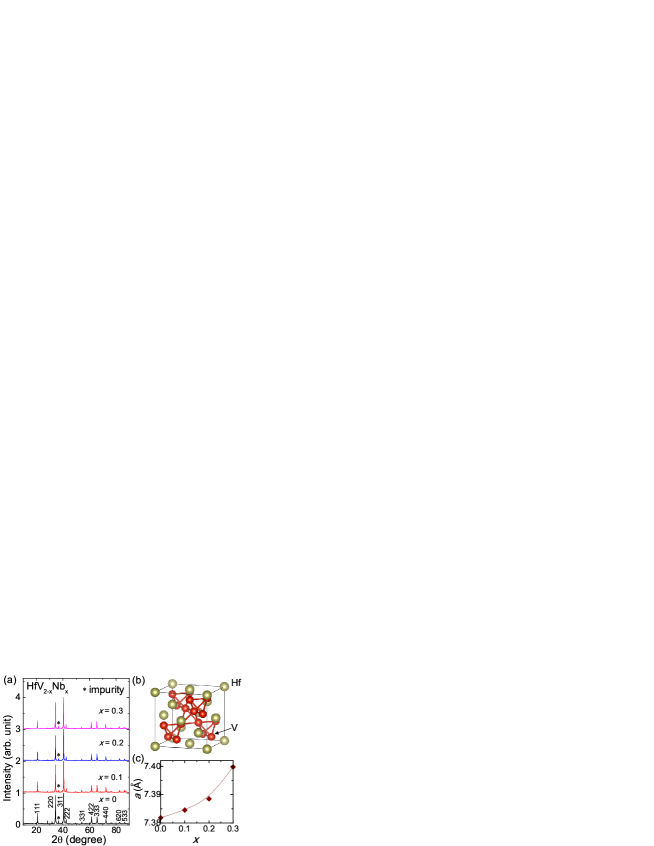
Figure 1(a) shows the room-temperature XRD patterns for the HfV2-xNbx samples. All the major peaks can be indexed on the cubic C15 structure with the space group Fd3m [3], and a schematic structure is shown in Fig. 1(b). The lattice parameter, determined by a least-squares method, is plotted as a function of the nominal Nb content in Fig. 1(c). For undoped HfV2 ( = 0), the refined = 7.382 Å is in good agreement with the previous reports [3, 4]. In this compound, the V atoms form a network of corner sharing tetrahedron, and the nearest V-V distance = 2.616 Å is even smaller than that (2.620 Å) in body-center-cubic (BCC) V. With increasing , the -axis expands monotonically to 7.399 Å. This is in line with the expectation that Nb substitutes V rather than Hf since (V) (Nb) (Hf), where is the atomic radius. In addition to the main C15 phase, there exist small extra diffraction peaks, which is ascribed to the Hf-based solid solution impurity. Base on the peak intensity at 36.7∘ (marked by the asterisks), the impurity fraction is estimated to vary from 8% to 12%, depending on the Nb content. On the other hand, the chemical compositions of these samples measured by EDX are HfV2.04(5), HfV1.88(3)Nb0.12(2), HfV1.7(1)Nb0.20(4), and HfV1.67(2)Nb0.35(3), which agree with the nominal ones considering both the measurement error and impurity level.
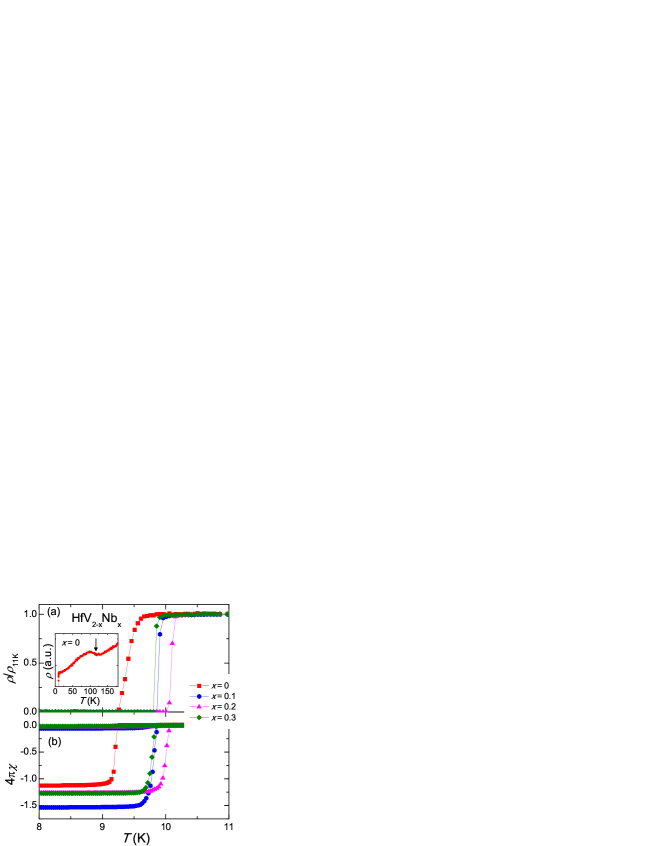
Figure 2(a) shows the low temperature resistivity for the HfV2-xNbx samples. A resistive superconducting transition is observed for all the samples. For HfV2 ( = 0), the transition starts at 9.6 K and the transition width is about 0.4 K. In addition, as shown in the inset of Fig. 2(a), a resistivity bump due to the structural phase transition is clearly visible at 110 K. Upon Nb doping, the resistive transition sharpens considerably. The values, determined as midpoint temperatures of the resistive transitions, are 9.4 K, 9.88 K, 10.1 K, and 9.84 K for = 0, 0.1, 0.2, and 0.3, respectively. The occurrence of SC in these HfV2-xNbx samples is corroborated by the magnetic susceptibility results shown in Fig. 2(b). For each , a strong diamagnetic signal is detected, and its onset temperature corresponds well to the midpoint of the resistive transition except for = 0, where the onset temperature coincides with the completion of the resistive transition. When cooling below 9 K, all the zero-field cooling susceptibility curves become flat, and the shielding fractions are calculated to vary between 110% and 150% without correction for the demagnetization effect.
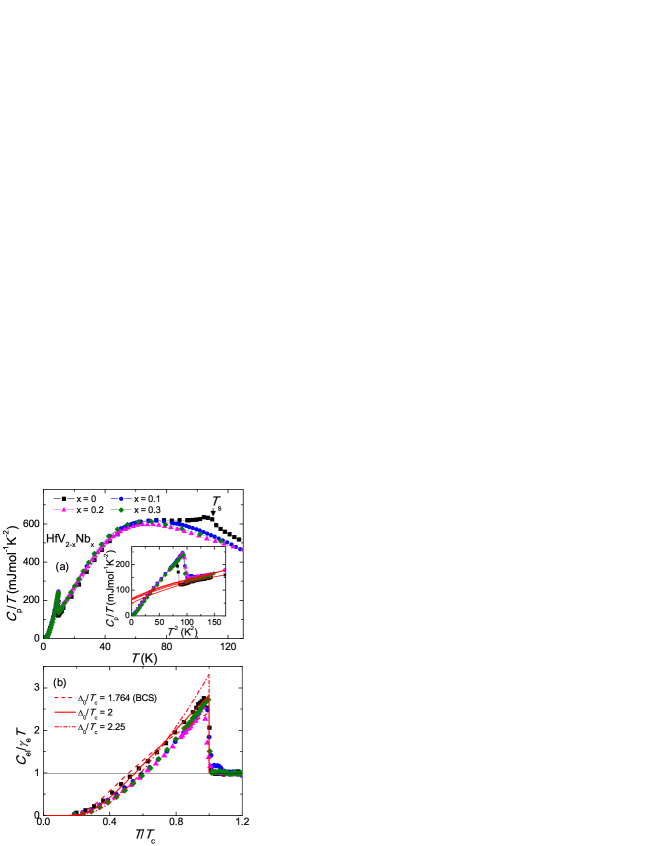
The main panel of Fig. 3(a) shows the temperature dependence of the specific heat / for the HfV2-xNbx samples. A anomaly can be seen at 110 K for HfV2, in accordance with the martensitic structural transformation. However, the small magnitude and relatively broad width of this anomaly signify that the structural transition is of second order rather than first order [12]. This is probably because that our sample is slightly off stoichiometric, and, indeed, its 110 K is slightly lower than that the usual value of 116 K [12]. For 0.1, no such anomaly is discernible. This indicates that the structural transformation is suppressed completely by this Nb doping level, in line with the previous study [12]. On the other hand, a sharp jump around is found for all samples, which can be seen more clearly from the / versus plot shown in the inset of Fig. 3(a). This confirms the bulk nature of SC in these HfV2-xNbx samples. Following Ref. [12], the normal-state data are analyzed by the Debye model / = + + + , where and ( = 3, 5, 7) are the electronic and phonon specific heat coefficients, respectively. Here the high order terms are included since there is a downward curvature of the data. The best fits yield = 50 mJmol-1K-2, 65 mJmol-1K-2, 68 mJmol-1K-2, and 62 mJmol-1K-2 for = 0, 0.1, 0.2, and 0.3, respectively, which are comparable to the previous study [12]. Since is proportional to , these results not only indicate a large in HfV2-xNbx[15], but also point to an increase of by Nb doping.
Figure 3(b) shows the temperature dependence of the normalized electronic specific heat / after subtraction of the phonon contribution. The normalized specific heat jumps / for these samples are about 1.7, which are significantly larger than the value 1.43 of the Bardeen-Cooper-Schrieffer (BCS) theory [16] and point to a strong coupling superconducting state. In such case, the / jump can be analyzed by a modified BCS model, or the so called ” model”, where = / and is the size of fully isotropic gap at 0 K [17]. It turn out that the data of = 0 can be well reproduced with / = 2, which is very close to that reported previously [18] and indeed larger than the BCS value of 1.764. For Nb-doped samples, the data almost overlap with each other and can be better fitted with / = 2.25 for / 0.6. Nevertheless, at higher /, a discrepancy exists between the experimental and theoretical results, which is probably due to either the error in the estimation of phonon specific heat contribution or the existence of gap anisotropy.
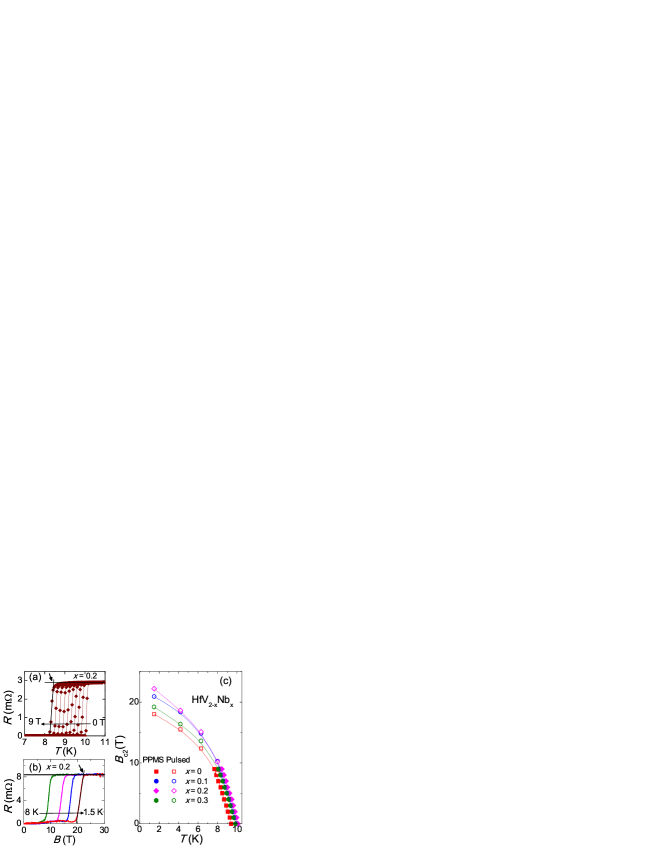
To obtain () for the HfV2-xNbx samples, temperature dependent resistivity measurements at constant fields up 9 T (in PPMS) are combined with isothermal magnetoresistance measurements under pulsed fields up to 30 T. Examples for = 0.2 are shown in Fig. 4(a) and (b), respectively, and the suppression of SC with increasing field is evident in both cases. For consistency, the value of () in each curve is determined as the onset temperature (field) of the resistive transition, and the resulting phase diagrams are displayed in Fig. 4(c). The initial slopes of , (), are found to be 5.1 T/K, 6.0 T/K, 6.0 T/K, and 5.4 T/K for = 0, 0.1, 0.2, and 0.3, respectively, which are typical for HfV2 based superconductors [18].
According to the WHH theory [8], the zero-temperature orbital upper critical field (0) in the dirty limit is given by
| (1) |
Using this formula, the calculated (0) for the HfV2-xNbx samples falls between 33.2 to 41.9 T, which is much higher than the estimated (0) 20 T. This indicates that the spin paramagnetic effect is at work, and hence the Cooper pairs are in the spin singlet state. Note that the paramagnetically limiting field (0) can be expressed as
| (2) |
where = (0)/(0) is the Maki parameter and (0) is the Pauli limiting field at 0 K [9]. Since (0) = /, where is the Bohr magneton, the values are found to be 2.38, 2.47, 2.47, and 2.31 for = 0, 0.1, 0.2 and 0.3, respectively. Then (0) are estimated to be in the range from 12.915.7 T, significantly smaller than the experimental values. Clearly, spin-orbit scattering that counteracts the spin paramagnetic effect needs also to be considered.
It is known that the () of a type-II superconductor in the dirty limit can be calculated from the the linearized Gor’kov equation, with spin paramagnetic effect and spin-orbit scattering parameterized as and [10]. The equation is expressed by a sum of digamma functions as:
| (3) |
where = , [()2-(/2)2]1/2, and
| (4) |
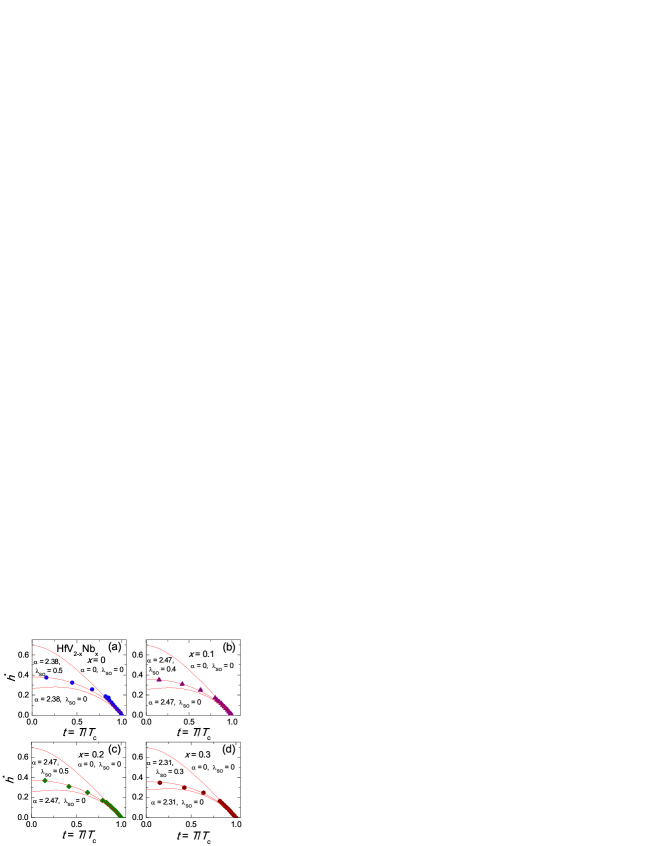
The normalized upper critical field = (/4) for the HfV2-xNbx samples with 0.3 is plotted against in Fig. 5. As can be seen, all the data points are well fitted only when both and are nonzero, which are summarized in Table 1. Actually, the theoretical curves concerning only the orbital effect ( = 0, = 0) fit the data close to well but strongly overestimate () at low temperature. By contrast, the fitting curves with = 0 underestimate the () data for most of the range. These results not only demonstrate conclusively the presence of spin orbit scattering, but also underline the importance of low temperature data in the analysis of behavior for HfV2 based superconductors [18].
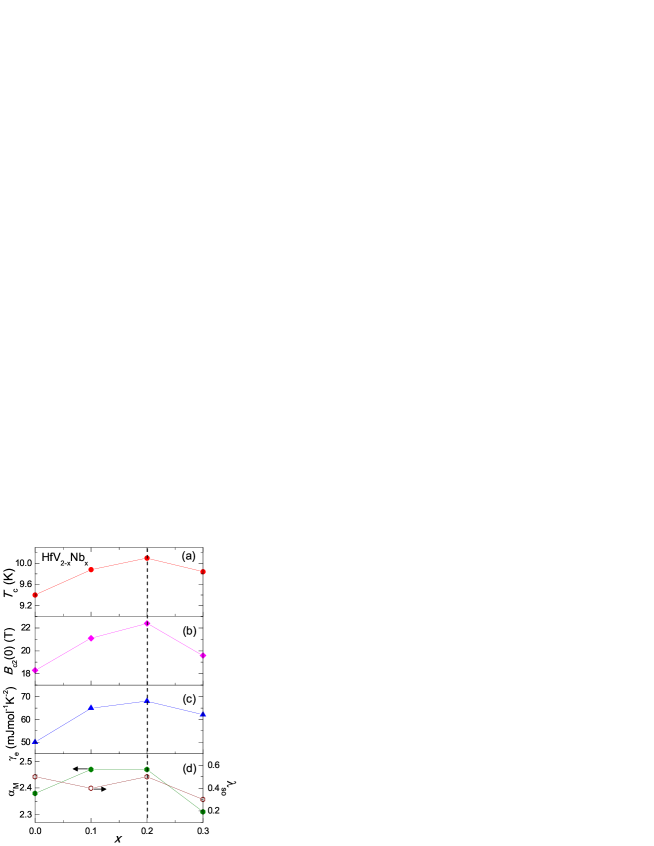
To gain more insight, the values of , (0), , and from the above results are plotted as a function of the Nb content in Fig. 6. It turns out that all of , (0) and follow a nonmonotonic dependence with a maximum at = 0.2, hinting at a close relation between them, while no obvious feature is seen in the data of and . In particular, compared with undoped HfV2, the (0) value is 4.1 T (22%) larger at = 0.2, which is remarkable since is increased only by 0.7 K (7%). For strong coupling superconductors, their is given by the MaMillan formula [19]
| (5) |
with
| (6) |
where is the Debye temperature, is the Coulomb pseudopotential, is the average square electron-ion matric element, is the atomic mass, and is the average square phonon frequency. Hence one could see that increases with increasing ), which explains the enhancement of by Nb doping. On the other hand, it is noted from Fig.5 that the values at 0 K are very similar for the HfV2-xNbx samples. It thus appears that (0) is nearly proportional to the product of and (). In the dirty limit, we have () , where is the resistivity value just above [20]. Given that increases by more than 30% with increasing from 0 to 0.2, it can be speculated that the concomitant enhancement of (0) is also mainly due to an enhanced ).
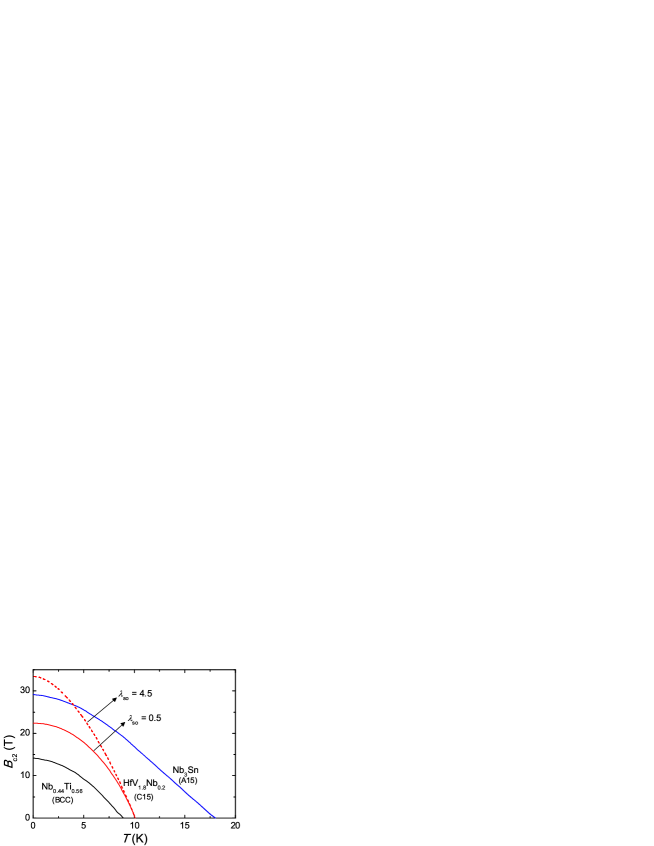
Finally, we present in Fig. 7 a comparison between the - phase diagrams of HfV1.8Nb0.2, Nb0.44Ti0.56 [21], and Nb3Sn [22], all of which adopt the cubic structure but with different space groups (Table 2). It is noted that the () curve of HfV1.8Nb0.2 lies between those of Nb0.44Ti0.56 and Nb3Sn. In particular, the (0) value of HfV1.8Nb0.2 is much higher than that of Nb0.44Ti0.56, despite their similar . This substantiates that C15 HfV2-based superconductors hold the record (0) for compounds composed only of transition metal elements. Furthermore, as can be seen from Table 2, (0) already approaches its orbital-limited value for Nb0.44Ti0.56 and Nb3Sn. By contrast, given its relatively small , there is still plenty room for the (0) enhancement of HfV1.8Nb0.2. Indeed, assuming the same = 4.5 as Nb0.44Ti0.56, (0) of HfV1.8Nb0.2 would reach 33 T, which is even higher than that of Nb3Sn. In this respect, it is worthy noting the following two relations: = 2/3 [10] and / = (/137)4 [23], where is the spin orbit scattering time, is the transport lifetime and is the atomic number. Hence, doping with high elements, such as 4 or 5 elements, may increase and will be of interest for future studies.
4 Conclusion
In summary, we have studied the superconducting properties, with focus on the upper critical field, of polycrytalline C15-type Laves phase compound HfV2-xNbx with up to 0.3. While the martensitic structural transition is suppressed for 0.1, a maximum in (= 10.1 K) as well as (0) (= 23.1 T) is found at = 0.2. Furthermore, the specific heat results indicate a strong coupling SC in the whole range studied, and an increase of ) induced by Nb doping, which is suggested to be responsible for the enhancement of both and (0). The () data of all samples are found to be well described by the WHH model considering the spin paramagnetic effect and spin orbit scattering. In addition, a comparison between the () behavior of HfV2-xNbx and those of Nb-Ti and Nb3Sn signifies the importance of spin orbit scattering in the (0) improvement for the former case. Our results call for further studies to increase the density of states at the Fermi level and spin orbit scattering in the HfV2 based Laves-phase superconductors, which may facilitate the high-field application of these materials.
Acknowledgments
We thank Dr. Yong Sun for his assistance in the data fitting. The work at Zhejiang University is supported by the National Key Research and Development Program of China (No.2017YFA0303002) and the Fundamental Research Funds for the Central Universities of China.
References
References
- [1] K. Tachikawa, J. Magn. Magn. Mater. 11, 169 (1979).
- [2] K. Inoue, T. Kuroda, and K. Tachikawa, IEEE Trans. Magn. Magn. 15, 635 (1979).
- [3] Y. Zhao, F. Chu, R. B. Von Dreele, and Q. Zhu, Acta Crystallogr., Sect. B: Struct. Sci. B56, 601 (2000).
- [4] B. Luthi, M. Herrmann, W. Assmus, H. Schmidt, H. Rietschel, H. Wuhl, U. Gottwick, G. Sparn, and F. Steglich, Z. Phys. B 60, 387 (1985).
- [5] K. Inoue, K. Tachikawa, and Y. Iwasa, Appl. Phys. Lett. 18, 235 (1971).
- [6] B. S. Brown, J. W. Hafstrom, and T. E. Klippert, J. Appl. Phys. 48, 1759 (1977).
- [7] F. Chu, M. Sob, R. Siegl, T. E. Mitchell, D. P. Pope, and S. P. Chen, Philos. Mag. B 70, 881 (1994).
- [8] N. R. Werthamer, E. Helfand, and P. Hohenberg, Phys. Rev. 147,288 (1966).
- [9] K. Maki, Phys. Rev. 148,362 (1966).
- [10] N. R. Werthamer, E. Helfand, and P. Hohenberg, Phys. Rev. 147, 295 (1966).
- [11] J. W. Hafstrom, G. S. Knapp, and A. T. Aldred, Phys. Rev. B 17, 2892 (1978).
- [12] F. Chu, Z. W. Chen, C. J. Fuller, C. L. Lin, and T. Mihalisin, J. Appl. Phys. 79, 6405 (1996).
- [13] C. L. Lin, T. Yuen, T. Mihalisin, and F. Chu, J. Appl. Phys. 87, 6797 (2000).
- [14] T. R. Finlayson and H. R. Khan, Appl. Phys. 17, 165 (1978).
- [15] C. W. Zhang, Z. Zhang, S. Q. Wang, H. Li, J. M. Dong, N. S. Xing, Y. Q. Guo, and W. Li, J. Alloy Compd. 448, 53 (2008).
- [16] J. Bardeen, L. N. Cooper, and J. R. Schreiffer, Phys. Rev. 108, 1175 (1957).
- [17] D. C. Johnston, Supercond. Sci. Technol. 26, 115011 (2013).
- [18] F. R. Drymiotis, J. C. Lashley, T. Kimura, G. Lawes, J. L. Smith, D. J. Thoma, R. A. Fisher, N. E. Phillips, Ya. Mudryk, V. K. Pecharsky, X. Moya, and A. Planes, Phys. Rev. B 72, 024543 (2005).
- [19] W. L. McMillan, Phys. Rev. 167, 331 (1968).
- [20] T. P. Orlando, E. J. McNiff, Jr., S. Foner, and M. R. Beasley, Phys. Rev. B 19, 4545 (1979).
- [21] L. J. Neuringer and Y. Shapira, Phys. Rev. Lett. 17, 81 (1966).
- [22] S. Foner and E. J. McNiff, Jr., Solid State Commun. 39, 959 (1981).
- [23] A. A. Abrikosov and L. P. Gorkov, Zh. Eksp. Teor. Fiz. 42, 1088 (1962) [Sov. Phy. JETP 15, 752 (1962)].
-
= 0 = 0.1 = 0.2 = 0.3 (Å) 7.382 7.385 7.389 7.399 (mJmol-1K-2) 50 65 68 62 (K) 9.4 9.88 10.1 9.84 () (T/K) 5.1 6.0 6.0 5.6 (0) (T) 33.2 41.1 41.9 38.2 (0) (T) 12.9 15.4 15.7 15.1 (0) (T) 18.3 21.1 22.4 19.6 2.38 2.47 2.47 2.31 0.5 0.4 0.5 0.3
-
Nb0.44Ti0.56 Nb3Sn HfV1.8Nb0.2 Space group Im3m Pm3n Fd3m (K) 8.9 17.6 10.1 (0) (T) 14.2 28.9 22.4 (0) (T) 15.5 29.2 41.9 1.34 0 2.47 4.5 0 0.5