Thickness-dependent magnetic order in CrI3 single crystals
Abstract
Two-dimensional (2D) materials with intrinsic ferromagnetism provide unique opportunity to engineer new functionalities in nano-spintronics. One such material is CrI3, showing long-range magnetic order in monolayer with the Curie temperature () of 45 K. Here we study detailed evolution of magnetic transition and magnetic critical properties in response to systematic reduction in crystal thickness down to 50 nm. Bulk of 61 K is gradually suppressed to 57 K, however, the satellite transition at = 45 K is observed layer-independent at fixed magnetic field of 1 kOe. The origin of is proposed to be a crossover from pinning to depinning of magnetic domain walls. The reduction of thickness facilitates a field-driven metamagnetic transition around 20 kOe with out-of-plane field, in contrast to the continuous changes with in-plane field. The critical analysis around elucidates the mean-field type interactions in microscale-thick CrI3.
Introduction
Layered materials, when thinned to atomic limits in 2D exhibit novel properties, different from the bulk counterpart. Recent discoveries of intrinsic 2D ferromagnetism in atomically thin CrI3 and Cr2Ge2Te6 open up new opportunities for studying fundamental 2D magnetism and show great potential in spintronic applications.[1, 2, 3] CrI3 and Cr2Ge2Te6 are ferromagnetic (FM) below 61 K in bulk.[4, 5, 6] First-principle calculations predict a robust 2D ferromagnetism with 57.2 or 106 K in monolayer Cr2Ge2Te6,[7, 8] However, the scanning magneto-optic Kerr microscopy experiment shows that the monotonically decreases with decreasing thickness, showing 30 K in bilayer and the absence of in monolayer.[3]
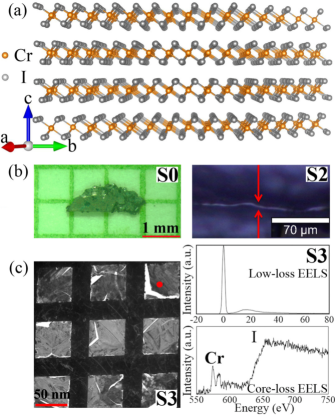
In bulk CrI3, the Cr atoms in each layer form a honeycomb structure, and each Cr atom is surrounded by six I atoms in an octahedral coordination [Fig. 1(a)]. In contrast to Cr2Ge2Te6, ferromagnetism in CrI3 persists in monolayer with of 45 K.[2] Intriguingly, the magnetism in CrI3 is layer-dependent, from FM in monolayer to antiferromagnetic (AFM) in bilayer, and back to FM in trilayer, providing great opportunities for designing magneto-optoelectronic devices.[2] The monolayer CrI3 can be described by the Ising model.[2, 9] Remarkably, the electrostatic doping can modify the saturation magnetization, the coercive force, and the in monolayer as well as change the interlayer magnetic order in bilayer CrI3.[10, 11] In addition, giant tunneling magnetoresistance is observed in few-layer CrI3, exhibiting multiple states as a function of magnetic field.[12, 13, 14, 15] This highlights CrI3 as a potential magnetic tunnel barrier for van der Waals heterostructure spintronic devices and also shows demand for magnetic order investigation at all length scales from bulk to monolayer.
Here we report a detailed study of thickness-dependent magnetic transition and critical behavior in CrI3. An additional satellite transition at was observed just below . The value of is found thickness-independent at fixed magnetic field, in contrast to gradually suppressed with reduction in thickness. Thin CrI3 crystals show an increase in coercive field and distinct field-driven metamagnetic transition around 20 kOe with out-of-plane field but not in-plane field. The critical behavior suggests the long-range mean-field type interactions in mesoscale-thick CrI3 crystals.
Methods
Bulk CrI3 single crystals were fabricated by the chemical vapor transport method and characterized as described previously.[16] A series of thicknesses were obtained step-by-step mechanical exfoliating bulk crystal down to nanometer scale [Figs. 1(b) and 1(c)]. Considering the reactivity of thin CrI3 flakes, all the samples were prepared in an argon-filled glove-box and protected using scotch tape on both sides when transferring for magnetization measurement. The dc magnetization was measured in Quantum Design MPMS-XL5 system. An optical microscopy equipped with 100 objective lens in Witec alpha 300 confocal Raman microscope was used for imaging the cross-section of S2 sample to determine its thickness. Transmission electron microscopy (TEM) sample of S3 was prepared by putting the exfoliated S3 sample in Cu grid. The thickness () of S3 sample was measured by the low loss EELS spectrum in JEM-ARM200F microscope [Fig. 1(c)], , where and are integrated EELS signal intensity under the zero-loss peak and the total spectrum, respectively; is a total mean free path for all inelastic scattering which can be calculated based on the composition of the sample.[17]
Results and Discussion
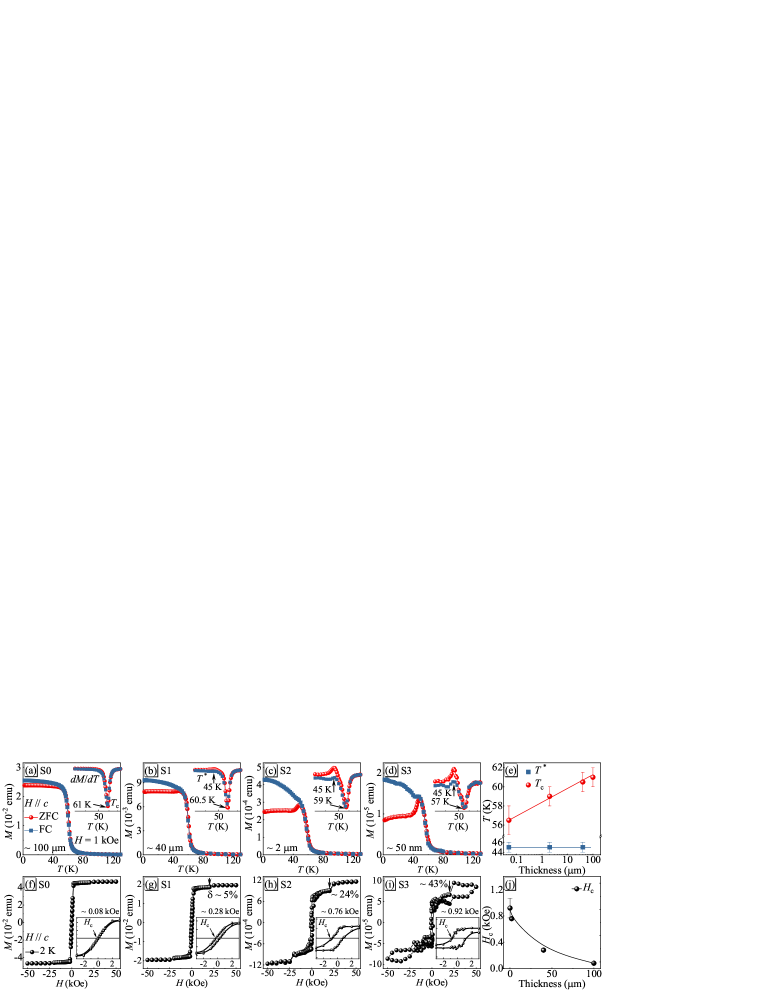
Figures 2(a)-2(d) present the temperature-dependent magnetization with zero-field cooling (ZFC) and field-cooling (FC) modes measured in out-of-plane field = 1 kOe for the samples (S0-S3) with typical thickness from 100 m to 50 nm. There is an apparent increase in , in line with the paramagnetic (PM) to FM transition.[1] The can be determined from the minima of the first derivative of the curves [insets in Figs. 2(a)-2(d)]. Given the large magnetocrystalline anisotropy in CrI3,[18] the divergence of ZFC and FC curves is observed below in = 1 kOe. With subsequent reduction of crystal thickness this discrepancy tends to be larger, indicating an increasing anisotropy in thin crystals. Intriguingly, an additional satellite transition just below is observed. A similar phenomenon was also observed in Fe3GeTe2, arising from the emergence of antiparallel spin arrangement along the axis between different Fe3Ge layers.[19] This satellite transition is defined by the maxima of the first derivative of the curves [insets in Figs. 2(b)-2(d)], which is more apparent in thinner crystal. The thickness dependence of and is summarized in Fig. 2(e). The shows linear decrease with logarithm of thickness. In contrast, the seems thickness-independent and shows a value of 45 K identical to the in monolayer measured by magneto-optic Kerr microscopy in = 1.5 kOe.[2] The isothermal magnetization at = 2 K for the corresponding samples is shown in Figs. 2(f)-2(i). With , the magnetization of bulk CrI3 crystal saturates at a relatively low magnetic field 2 kOe and in line with the previous reports.[1, 16] With reduction of thickness, there is an increase of coercive field as shown in insets of Figs. 2(f)-2(i), from about 80 Oe for S0 sample to 920 Oe for S3 sample, still identified as a relatively soft ferromagnet. It is interesting to note that an apparent magnetization jump around 20 kOe is observed in thin crystals. The calculated value increases from 5 for S1 to 43 for S3. This field-driven metamagnetic transition is first identified by the step-like change of magnetization in the hysteresis curves, which is similar with the giant tunneling magnetoresistance step around the same field observed in few-layer devices.[15] The tunneling magnetoresistance step in few-layer devices is attributed to spin filtering effect arising from collapse of interlayer AFM in thin CrI3.[12, 13, 14, 15] Above this critical field, a fully spin polarized FM state is reached in S0-S2 samples, however, a large hysteresis is observed in S3 sample.
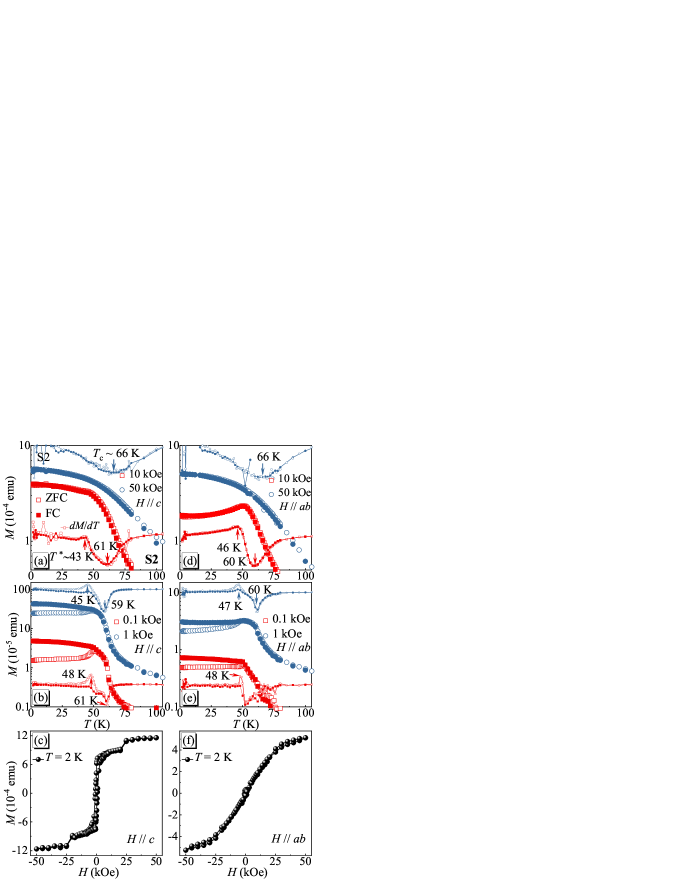
To well understand the nature of magnetism in CrI3 and its properties from bulk to monolayer, we then focus on the S2 sample with mesoscale thickness of 2 m. Figure 3 shows the temperature- and field-dependent magnetization with out-of-plane and in-plane fields, respectively. The is nearly isotropic in = 50 kOe, whilst anisotropic magnetic response is observed in low fields. In = 10 kOe, a monotonic increase of with decreasing temperature is observed for [Fig. 3(a)], however, the decreases with decreasing temperature below 50 K for [Fig. 3(d)]. Similar feature was also observed in bulk CrI3 crystal, associated with its temperature dependent magnetocrystalline anisotropy.[18, 20] The satellite transition reveals itself by the emergence of a weak kink in the curve with = 10 kOe. With decreasing field, the magnetic anisotropy results in larger divergence between ZFC and FC magnetization and a more abrupt satellite transition, as shown in Figs. 3(b) and 3(e). Both and are field-dependent but with an opposite tendency, i.e., with decreasing field the decreases whereas the gradually increases. The isothermal magnetization at 2 K increases discretely for out-of-plane field [Fig. 3(c)], but monotonically for in-plane field [Fig. 3(f)]. Although an A-type AFM ground state was proposed in few-layer devices,[15] a FM ground state is still expected in S2 sample with thickness m. Therefore, the field-driven metamagnetic transition is most likely caused by a movement or depinning of magnetic domains, rather than flipping the spins from an antiparallel to a parallel configuration. A crossover from pinning to depinning of magnetic domain walls is also proposed as the reason for the satellite kink. When the sample is cooled in zero field, the magnetic domains start to be pinned below the crossover temperature . Small applied field at base temperature is insufficient to move the pinned domains. With increasing temperature, thermal fluctuations gradually weaken the pinning force and finally completely depin the domains above . This also explains why the kink is more apparent in the ZFC curves. In the FC process the domains are always pinned with the effective FM moment aligned along the cooling field.
Near a second-order phase transition, the free energy of a ferromagnet . By , the equation of state is obtained as for the behavior of magnetization near . According to the scaling hypothesis, the spontaneous magnetization below , the inverse initial susceptibility above , and the at can be characterized by a series of critical exponents:[21]
| (1) |
| (2) |
| (3) |
where , , and are the critical amplitudes and the reduced temperature, respectively.[22]
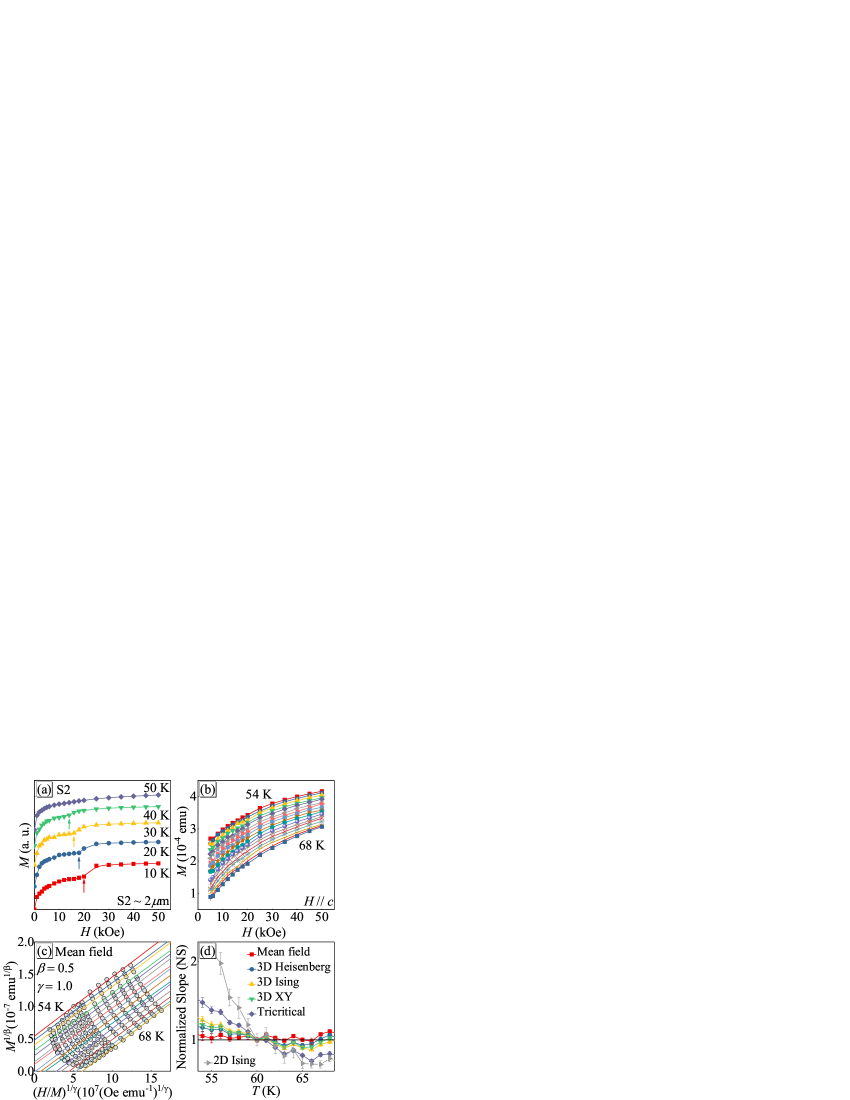
The isothermal magnetization curves with out-of-plane field are depicted in Figs. 4(a) and 4(b). The magnetization jump gradually moves to lower field and finally disappears at 50 K for S2. The Arrott plot of vs [Fig. 4(c)], with = 0.5 and = 1.0,[23, 24] gives a set of quasi-straight lines and the isotherm at pass through the origin, suggesting the mean-field type magnetic interactions in S2 sample. In addition, the positive slope of the straight lines indicates that it is a second-order transition based on the Banerjee′s criterion.[25]. The Arrot-Noaks equation of state gives a general modified Arrott plot , where and are constants.[26] Taking into consideration the three-dimensional (3D) critical behavior in bulk CrI3 (S0 sample),[16] and 2D Ising-like in monolayer,[2] a set of possible exponents belonging to different models are used to build the modified Arrott plots.[27] Comparison the normalized slope () with ideal value ”1” can determine the most suitable model, where . Figure 4(d) presents the vs curves for indicated models, confirming that the mean-field model is the best and the 2D Ising model shows the largest deviation. That is to say, the critical behavior of mesoscale S2 sample is quite different when compared to bulk and monolayer.[16, 2]
| Thickness | Theoretical model | Reference | Technique | (K) | |||
|---|---|---|---|---|---|---|---|
| S0 m | [16] | MAP | 60.45(3)/60.38(6) | 0.284(3) | 1.146(11) | 5.04(1) | |
| [16] | KFP | 60.05(13)/60.43(4) | 0.260(4) | 1.136(6) | 5.37(4) | ||
| [16] | CI | 60 | 5.32(2) | ||||
| 3D Heisenberg | [29] | Theory | 0.365 | 1.386 | 4.8 | ||
| 3D XY | [29] | Theory | 0.345 | 1.316 | 4.81 | ||
| 3D Ising | [29] | Theory | 0.325 | 1.24 | 4.82 | ||
| Tricritical mean field | [27] | Theory | 0.25 | 1.0 | 5 | ||
| S2 m | This work | MAP | 60.9(2)/60.0(2) | 0.45(2) | 0.90(8) | 3.00(9) | |
| This work | KFP | 60.5(3)/60.7(3) | 0.41(2) | 0.87(8) | 3.12(9) | ||
| This work | CI | 60 | 2.88(4) | ||||
| This work | CI | 61 | 3.12(3) | ||||
| Mean field | [21] | Theory | 0.5 | 1.0 | 3.0 | ||
| monolayer | [2] | MOK | 45 | ||||
| 2D Ising | [27] | Theory | 0.125 | 1.75 | 15 |
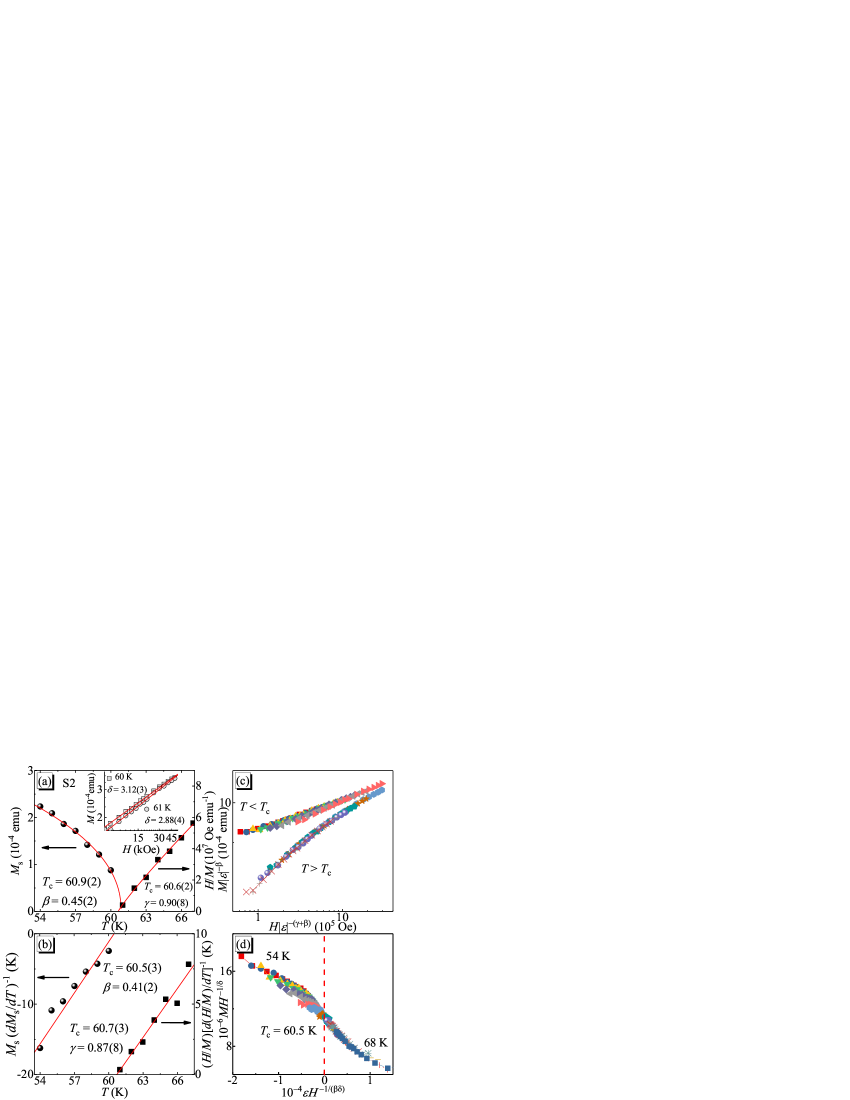
The linearly extrapolated and are plotted from in Fig. 5(a). The solid lines are fitted lines according to Eqs. (1) and (2). The precise critical exponents , with K, and , with K, are obtained, close to the parameters of mean-field model. According to Eq. (3), the at should be a straight line in log-log scale with the slope of [inset in Fig. 5(a)]. Such fitting yields 3.12(3) for = 60 K and 2.88(4) for = 61 K, respectively. The Kouvel-Fisher (KF) method can be used to double check the obtained critical exponents,
| (4) |
| (5) |
where and are linear in and the slopes are and , respectively.[28] Such fitting gives , with K, and , with K, respectively, in line with the values obtained by the modified Arrott plot.
The reliability of obtained critical exponents , , , and can be further checked by a scaling analysis. Near the critical region, the magnetic equation of state can be expressed as
| (6) |
where is the regular function with for , and for , respectively. This equation can be further expressed as , where and are the rescaled magnetization and magnetic field, respectively. Figure 5(c) presents the scaled vs in log-log scale, falling on two separate branches above and below , confirming the true scaling treatment and the intrinsic critical values of , , and . The scaling equation of state can also be expressed as
| (7) |
where the vs should collapse into a single curve with the locating at horizontal zero point [Fig. 5(d)].
The critical exponents of CrI3 (S0 and S2) with different thickness are listed in Table I for comparison with the theoretical models.[2, 16, 21, 29, 27] For a 2D magnet, the value of critical exponent should be within a window .[30] As we can see, the critical exponents of bulk CrI3 crystal (S0) are between the values of theoretical tricritical mean-field and 3D Ising model, exhibiting a clear 3D critical phenomenon, in contrast to Cr2(Si,Ge)2Te6 showing 2D Ising-like behavior.[31, 32] The monolayer CrI3 is claimed as a 2D Ising-like ferromagnetism as a result of large magnetic anisotropy removing the Mermin-Wagner restriction.[2, 33] However, the critical exponents of , , and for mesoscale CrI3 (S2) are well fit with the mean-field model (Table I), which is quite different from the behavior in bulk and monolayer. It should be noted that the precise value of for S2 almost equals to = 61 K for S0 based on the critical analysis, in contrast to the strong thickness dependence of , , and . we assume that the of 45 K in monolayer is most likely stabilized by the satellite transition ( 45 K ) in bulk CrI3, calling for further in-depth theoretical study.
Conclusion
In summary, we have investigated the thickness-dependent magnetism in CrI3 from bulk to 50 nm thickness. In addition to suppression of bulk , we observe an additional satellite transition at 45 K which is independent of thickness and corresponds to the observed in monolayer. Analysis of critical behavior shows mean-field interactions in mesoscale-thick CrI3, in contrast to that in bulk and monolayer, which is helpful to understand the nature magnetism in in CrI3 and is of great importance for future magneto-optoelectronic devices.
References
- [1] M. A. McGuire, H. Dixit, V. R. Cooper, and B. C. Sales, Chem. Mater. 27, 612 (2015).
- [2] B. Huang, G. Clark, E. Navarro-Moratalla, D. R. Klein, R. Cheng, K. L. Seyler, D. Zhong, E. Schmidgall, M. A. McGuire, D. H. Cobden, W. Yao, D. Xiao, P. Jarillo-Herrero, and X. D. Xu, Nature 546, 270 (2017).
- [3] C. Gong, L. Li, Z. L. Li, H. W. Ji, A. Stern, Y. Xia, T. Cao, W. Bao, C. Z. Wang, Y. Wang, Z. Q. Qiu, R. J. Cava, S. G. Louie, J. Xia, and X. Zhang, Nature 546, 265 (2017).
- [4] V. Carteaux, D. Brunet, G. Ouvrard, and G. André, J. Phys.: Condens. Matter 7, 69 (1995).
- [5] L. D. Casto, A. J. Clune, M. O. Yokosuk, J. L. Musfeldt, T. J. Williams, H. L. Zhuang, M. W. Lin, K. Xiao, R. G. Hennig, B. C. Sales, J. Q. Yan, and D. Mandrus, APL Mater. 3, 041515 (2015).
- [6] X. Zhang, Y. L. Zhao, Q. Song, S. Jia, J. Shi, and W. Han, Jpn. J. Appl. Phys. 55, 033001 (2016).
- [7] X. X. Li, and J. L. Yang, J. Mater. Chem. C 2, 7071 (2014).
- [8] N. Sivadas, M. W. Daniels, R. H. Swendsen, S. Okamoto, and D. Xiao, Phys. Rev. B 91, 235425 (2015).
- [9] R. B. Griffiths, Phys. Rev. 136, A437 (1964).
- [10] S. Jiang, L. Li, Z. Wang, K. F. Mak, and J. Shan, Nat. Nanotech. 13, 549 (2018).
- [11] B. Huang, G. Clark, D. R. Klein, D. MacNeill, E. Navarro-Moratalla, K. L. Seyler, N. Wilson, M. A. McGuire, D. H. Cobden, D. Xiao, W. Yao, P. Jarillo-Herrero, and X. D. Xu, Nat. Nanotech. 13, 544 (2018).
- [12] T. Song, X. Cai, M. Wei-Yuan Tu, X. Zhang, B. Huang, N. P. Wilson, K. L. Seyler, L. Zhu, T. Taniguchi, K. Watanabe, M. A. McGuire, D. H. Cobden, D. Xiao, W. Yao, and X. D. Xu, Science 10.1126/science.aar4851 (2018).
- [13] D. R. Klein, D. MacNeill, J. L. Lado, D. Soriano, E. Navarro-Moratalla, K. Watanabe, T. Taniguchi, S. Manni, P. Canfield, J. Fernández-Rossier, and P. Jarillo-Herrero, Science 10.1126/science.aar3617 (2018).
- [14] Z. Wang, I. Gutiérrez-Lezama, N. Ubrig, M. Kroner, T. Taniguchi, K. Watanabe, A. Imamoğlu, E. Giannini, and A. F. Morpurgo, Nat. Commun. 9, 2516 (2018).
- [15] H. H. Kim, B. Yang, T. Patel, F. Sfigakis, C. Li, S. Tian, H. Lei, and A. W. Tsen, Nano Lett. 10.1021/acs.nanolett.8b01552.
- [16] Y. Liu and C. Petrovic, Phys. Rev. B 97, 014420 (2018).
- [17] R. F. Egerton, Electron Energy-Loss Spectroscopy in the Electron Microscope (Plenum Press, New York, 1996).
- [18] N. Richter, D. Weber, F. Martin, N. Singh, U. Schwingenschlögl, B. V. Lotsch, and M. Kläui, Phys. Rev. Materials 2, 024004 (2018).
- [19] J. Yi, H. Zhuang, Q. Zou, Z. Wu, G. Cao, S. Tang, S. A. Calder, P. R. C. Kent, D. Mandrus, and Z. Gai, 2D Mater. 4, 011005 (2016).
- [20] Y. Liu and C. Petrovic, Phys. Rev. B 97, 174418 (2018).
- [21] H. E. Stanley, Introduction to Phase Transitions and Critical Phenomena (Oxford U. P., London and New York, 1971).
- [22] M. E. Fisher, Rep. Prog. Phys. 30, 615 (1967).
- [23] A. Arrott, Phys. Rev. B 108, 1394 (1957).
- [24] J. C. Lin, P. Tong, D. P. Cui, C. Yang, J. Yang, S. Lin, B. S. Wang, W. Tong, L. Zhang, Y. M. Zhou, and Y. P. Sun, Sci. Rep. 5, 7933 (2015).
- [25] S. K. Banerjee, Phys. Lett. 12, 16 (1964).
- [26] A. Arrott, and J. Noakes, Phys. Rev. Lett. 19, 786 (1967).
- [27] J. C. LeGuillou, and J. Zinn-Justin, Phys. Rev. B 21, 3976 (1980).
- [28] J. S. Kouvel, and M. E. Fisher, Phys. Rev. 136, A1626 (1964).
- [29] S. Kaul, J. Magn. Magn. Mater. 53, 5 (1985).
- [30] A. Taroni, S. T. Bramwell, and P. C. W. Holdsworth, J. Phys.: Condens. Matter 20, 275233 (2008).
- [31] Y. Liu, and C. Petrovic, Phys. Rev. B 96, 054406 (2017).
- [32] G. T. Lin, X. Luo, F. C. Chen, J. Yan, J. J. Gao, Y. Sun, W. Tong, P. Tong, W. J. Lu, Z. G. Sheng, W. H. Song, X. B. Zhu, and Y. P. Sun, Appl. Phys. Lett. 112, 072405 (2018).
- [33] N. D. Mermin and H. Wagner, Phys. Rev. Lett. 17, 1133 (1966).
Acknowledgements
Work at Brookhaven National Laboratory is supported by the US DOE, Contract No. DE-SC0012704.
Author contributions statement
C.P. initiated the study. Y.L. synthesized crystals and performed magnetization measurements. X.T. performed optical microscopy study. L.W., J.L, J.T., and Y.Z. contributed TEM and EELS measurements. Y.L. and C.P. organized and wrote the paper with input from all collaborators. This manuscript reflects the contribution and ideas of all authors.
Additional information
Competing interests: The authors declare no competing interests.