Systematics in the ALMA Proposal Review Rankings
Abstract
The results from the ALMA proposal peer review process in Cycles 0–6 are analyzed to identify any systematics in the scientific rankings that may signify bias. Proposal rankings are analyzed with respect to the experience level of a Principal Investigator (PI) in submitting ALMA proposals, regional affiliation (Chile, East Asia, Europe, North America, or Other), and gender. The analysis was conducted for both the Stage 1 rankings, which are based on the preliminary scores from the reviewers, and the Stage 2 rankings, which are based on the final scores from the reviewers after participating in a face-to-face panel discussion. Analysis of the Stage 1 results shows that PIs who submit an ALMA proposal in multiple cycles have systematically better proposal ranks than PIs who have submitted proposals for the first time. In terms of regional affiliation, PIs from Europe and North America have better Stage 1 rankings than PIs from Chile and East Asia. Consistent with Lonsdale et al. (2016), proposals led by men have better Stage 1 rankings than women when averaged over all cycles. This trend was most noticeably present in Cycle 3, but no discernible differences in the Stage 1 rankings are present in recent cycles. Nonetheless, in each cycle to date, women have had a lower proposal acceptance rate than men even after differences in demographics are considered. Comparison of the Stage 1 and Stage 2 rankings reveal no significant changes in the distribution of proposal ranks by experience level, regional affiliation, or gender as a result of the panel discussions, although the proposal ranks for East Asian PIs show a marginally significant improvement from Stage 1 to Stage 2 when averaged over all cycles. Thus any systematics in the proposal rankings are introduced primarily in the Stage 1 process and not from the face-to-face discussions. These results are discussed in the context of potential language and cultural biases, but any conclusions on the origin of the observed systematics remain speculative.
1 Introduction
The Atacama Large Millimeter/Submillimeter Array (ALMA) is an international astronomical facility operated in a partnership of the European Organisation for Astronomical Research in the Southern Hemisphere (ESO), the U.S. National Science Foundation, and the National Institutes of Natural Sciences of Japan in cooperation with the Republic of Chile. The Joint ALMA Observatory (JAO) solicits observing proposals from the scientific community to use ALMA through an annual Call for Proposals. This is the primary means by which projects are selected for observation. ALMA proposals are peer reviewed by volunteers from the scientific community. Projects are added to the observing queue based primarily on the scientific rank from the review process, but also operational considerations, including over-subscription in antenna configurations and by right ascension, the required weather conditions for the observations, and the pre-determined share of observing time that is awarded to Chile, East Asia, Europe, and North America.
Given the importance that telescope access can have on developing a scientific career, it is imperative that the community has confidence that scientific merit is the primary determinant of proposal rank. Analyzing the results from the review process and presenting the outcomes in a transparent manner is an important part in building confidence within the community. Along these lines, identifying potential systematics in the proposal review process at astronomical observatories has received prominent attention in recent years. If the probability of success of a proposal depends on some characteristic (e.g., the gender of the Principal Investigator, or PI) that should not correlate with the underlying scientific merit, it may indicate a bias in the review process.
Reid (2014) raised attention to possible biases in the proposal review process of the Hubble Space Telescope (HST) when he found that proposals led by women had a lower acceptance rate than proposals led by men for HST Cycles 11 through 21. While the difference in acceptance rate by gender is not significant in any given cycle, the persistent trend over time cannot be attributed to random noise. Reid (2014) speculated on possible causes of the gender-based systematic, but establishing the origin with any degree of certainty was difficult. One possibility is that unconscious bias is present among the reviewers that favor men over women in the scientific review. However, the data contained hints that demographic differences may also play a role. In response to these systematics, HST took the step of listing the investigators alphabetically on the proposal cover sheet so that reviewers could no longer identify the PI. Yet, women continued to have a lower acceptance rate than men until a double-anonymous review was instituted that hid the identity of all investigators to the reviewers (Strolger & Natarajan, 2019).
Following the study by Reid (2014), Patat (2016) analyzed the proposal statistics for ESO and found that women also have had a lower success rate than men when applying for observing time. He found that the difference in the acceptance rate can be largely attributed to demographic differences in the seniority of PIs that correlate with gender. Proposals led by senior astronomers have a higher acceptance rate than proposals from junior astronomers, and the fraction of senior astronomers that are women is lower than among junior applicants. After accounting for seniority, Patat (2016) found a residual systematic remained that could reflect either unaccounted demographic differences between women and men or potentially a true gender bias.
Lonsdale et al. (2016) analyzed the results from the proposal review process for four facilities operated in full or in part by the National Radio Astronomical Observatory (NRAO): the Jansky Very Large Array (JVLA), the Very Long Baseline Array (VLBA), the Green Bank Telescope (GBT) and ALMA. Analogous to the results for HST and ESO, they found that the proposal rankings favored men over women in ALMA Cycles 2-4, with the largest and most significant difference found in Cycle 3. The other NRAO telescopes showed similar trends, although the significance was lower than found for ALMA, and in some semesters, women had higher overall rankings than men. Hunt et al. (2019) extended the analysis by Lonsdale et al. (2016) to include more recent proposal rounds at the JVLA, VLBA, and the GBT. They found that when averaged over all proposal semesters between 2012A and 2019A for the JVLA, VLBA and GBT combined, men had a statistically significant advantage over women in the proposal scores.
The study presented here extends the analysis of the ALMA proposal rankings conducted by Lonsdale et al. (2016) in several aspects. First, the analysis is extended to include all cycles to date (Cycles 0-6). Second, since ALMA has a two-stage review process, the science rankings are evaluated for both the preliminary science assessments (Stage 1) and the final assessment resulting from the face-to-face review (Stage 2) to establish at which stage in the review process any systematics are introduced. Finally, the correlation of the proposal rankings with other variables in addition to gender, including experience level in submitting ALMA proposals and regional affiliation of the PIs, is investigated.
This paper is organized as follows. Section 2 describes the salient aspects of the two-stage proposal review process adopted by ALMA and the demographic data collected for this study. Section 3 explores any systematics in the proposal rankings introduced in the first stage of the review process. Section 4 compares the rankings between the first and second stages of the review process to investigate any systematics that result from the face-to-face discussion between reviewers. Section 4 also examines correlation between gender and the acceptance rate of proposals into the observing queue. Section 5 summarizes the results and briefly describes how the ALMA review process will evolve in the near future. An analysis of the acceptance rate of proposals submitted by ALMA reviewers is presented in the Appendix to investigate if the ALMA review process favors proposals submitted by the reviewers.
2 Proposal Review Process and Demographic Data
This section describes the ALMA proposal review process and how a list of scientific rankings is produced from the reviewer scores. The demographic data are then described that will be used to evaluate potential systematics in the proposal rankings against 1) the experience level of a PI in submitting ALMA proposals, 2) the regional affiliation of the PI, and 3) the gender of the PI.
2.1 The ALMA proposal review process
Similar to many other observatories, ALMA has adopted a peer-review, panel-based system to evaluate and rank the proposals based on scientific merit. This system has been used for seven proposal calls, starting with Cycle 0 in 2011 and continuing to Cycle 6 in 2018. Since Cycle 1, the ALMA review panels have been split across five scientific categories: 1) Cosmology and the high-redshift universe, 2) Galaxies and galactic nuclei, 3) Interstellar medium, star formation, and astrochemistry, 4) Circumstellar disks and the solar system, and 5) Stars and stellar evolution. Four categories were used in Cycle 0, where categories 4 and 5 were combined. The number of panels in each category has increased over the years in response to an increased number of submitted proposals. Cycles 4-6 each contained 18 panels split across the five categories.
Proposals are assigned to a panel by the JAO based on the science category selected by the PI at the time of proposal submission. Further refinement in the panel assignments can be done based on the scientific keywords selected by the PI such that proposals with similar keywords may be grouped in a single panel. For example, in Cycle 6, the category for Circumstellar disks and the solar systems contained four review panels, but planetary proposals were placed into two of the four panels. Proposals are assigned to and scored by a single review panel. The exception is proposals for Large Programs, which are assigned to all panels in the appropriate scientific category.
The review process proceeds in two stages. In Stage 1, panel members review their assigned proposals and provide preliminary numerical scores on a scale of 1 (best) to 10 (worst). Reviewers do not score proposals for which they have a conflict of interest. Conflicts of interest can be identified by either the JAO Proposal Handling Team (PHT) or self-declared by the reviewers. For this study, the average Stage 1 score is computed for each proposal111In the actual proposal review process, the JAO normalizes the composite Stage 1 scores for each reviewer to have the same mean and standard deviation before averaging the scores. The normalization is not done in this study to treat the Stage 1 and Stage 2 scores in a consistent manner.. Stage 2 of the review process consists of a face-to-face meeting of all reviewers at a common venue. The proposals are discussed and then re-scored by each non-conflicted reviewer. The individual scores are averaged to produce the final Stage 2 score.
The number of reviewers per panel has varied from six in Cycle 0, to seven in Cycles 1-2, and to eight in Cycles 4-6. In Cycle 0, panels in Category 4 had seven reviewers since additional expertise was needed to cover the broad range of topics since the category also included stellar evolution. Similarly, Category 5 had nine reviewers per panel in Cycles 5 and 6. In Cycles 0-3, each proposal was scored by four reviewers in Stage 1. Since Cycle 4, reviewers score all proposals in Stage 1 for which they do not have a conflict.
Starting in Cycle 1, approximately 25-35% of proposals that have poor scores in the Stage 1 reviews are “triaged” by the JAO. Unless a reviewer “resurrects” a triaged proposal, triaged proposals are not discussed at the face-to-face review to allow the review panels to focus their deliberations on the better ranked proposals. The triage level is adjusted on a regional basis in order to maintain at least a factor of two over-subscription in the requested observing time relative to the available time for each region. In particular, the percentage of Chilean proposals that is triaged is typically lower than other regions since Chile has had the lowest over-subscription rate. The non-triaged proposals are reviewed and scored by all non-conflicted reviewers in the panel in Stage 2.
2.2 Proposal ranks
The outcome of the review process is a merged list of proposal ranks for all panels combined. The JAO then determines which proposals are accepted into the observing queue using primarily the scientific rank from the review process, as well as the time available to each region, the over-subscription in array configurations and right ascension, and the required weather conditions needed to carry out the observations. Proposals that are accepted into the observing queue are assigned a priority grade (A, B, or C) while the remaining proposals are declined. Because of the operational considerations, the priority grades do not strictly follow the proposal rankings. Therefore, in searching for systematics, primarily the proposal rankings are considered (see, however, the analysis presented in Section 4.3 and the Appendix). Two lists of proposal rankings are created: i) the ranked list after the initial proposal assessments (Stage 1), and ii) the ranked list after the face-to-face review (Stage 2), which excludes triaged proposals. Large Program proposals, Director’s Discretionary Time proposals, and proposals submitted to the Cycle 4 Supplemental Call for the 7-m Array are excluded from the analysis since they are reviewed in a different manner.
In each stage, the average scores from the reviewers are used to rank the proposals within a panel between 1 (best) to (worst), where is the number of proposals under consideration in either Stage 1 or Stage 2. The panel rankings are then normalized by the number of proposals in the panel so that the rankings vary between 0 (best) and 1 (worst). The rankings from the individual panels are merged into a single list by sorting the normalized rankings. Any ties222In generating the ranked list of proposals used to assign priority grades, ties between proposal ranks are broken using the Stage 2 scores, and if a tie persists, by the proposal number. in the normalized rankings are broken using a random number generator. The final ranked list is then normalized from 0 (best) to 1 (worst) with steps of 1/(-1). A merged ranked list is created separately based on the scores in the Stage 1 and Stage 2 process. Since triaged proposals are not re-scored by the panels in Stage 2, these proposals are excluded from the merged Stage 2 ranked list.
2.3 Experience level in submitting ALMA proposals
Patat (2016) found that the proposal success rate in ESO was higher for “professional astronomers” than for less experienced PIs (classified into “postdocs” and “students”). The expertise of a PI may correlate with the success of a proposal if established PIs are able to write a more compelling science case based on experience or have a better understanding on how to use ALMA optimally. On the other hand, this assumption may lead to some element of “prestige” bias, where proposals led by a well-known PI are given more favorable scores in the review process based on reputation or standing in the community that is not based on the scientific merit of the actual proposal.
The experience factor consists of at least two components. One component is the overall experience level of the PI, for which one measure is the year since the PhD was obtained or the number of years as a professional astronomer. A second component is the experience of the PI in millimeter/submillimeter interferometry overall and with ALMA in particular, as one may expect such a PI to understand better the capabilities of the instrument and the current state of the field.
While ALMA users are requested to complete a demographic profile that includes the year of their PhD and a self-assessment of their expertise in submillimeter astronomy and other fields, most users do not complete their profiles. Therefore, as a surrogate for experience, the number of cycles in which a user has submitted an ALMA proposal as PI was determined, regardless if the proposal was ultimately accepted or not. The experience level is computed for each user and each cycle. For example, in Cycle 6, a user with an experience level of 1 indicates the user submitted an ALMA proposal as PI for the first time, while a user with an experience level of 7 has submitted at least one proposal as PI in all seven ALMA cycles and has considerable experience with ALMA. This metric best measures the experience that a user has in submitting ALMA proposals, but not their career standing.
The main advantage of this metric is that it can be computed in a straightforward and consistent manner for all users and a given cycle. However, it does not reflect the role co-investigators may have in formulating the proposal, especially faculty advisers to students. More subtly, this experience metric may be a biased measure in that success in one proposal cycle may encourage additional proposals in subsequent cycles, either as positive reinforcement or by collecting ALMA data that can be used to justify follow-up proposals. Conversely, having a proposal declined, especially in multiple proposal cycles, may discourage a user from submitting further proposals.
2.4 Regional affiliation
ALMA proposals can be submitted by anyone without regard to nationality or affiliation. Since ALMA operations are funded by three regions (East Asia, Europe, and North America) with cooperation of the Chilean government, there is an inherent diversity in the ALMA user base (see Section 2.6). All PIs self-identify their regional affiliation (Chile, East Asia, Europe, North America, or Other) when submitting their proposals. In this context, regional affiliation refers to the region of the host institution as opposed to the nationality of the PI. Chilean proposals are submitted by PIs with an affiliation at a Chilean research institute. Proposals assigned to East Asia consist of PIs with affiliations in Japan, Taiwan, or the Republic of Korea. Proposals assigned to Europe consists of PIs who have affiliations in one of the ESO member states. Proposals assigned to North America consist of PIs from the United States, Canada, or Taiwan. Since Taiwanese agencies contributed funding for ALMA in both East Asia and North America, Taiwan users are listed as having a joint East Asia and North America affiliation in the proposal process, but for the purpose of this study, they are assigned to East Asia. Proposals from any non-ALMA regions are grouped as “Other”.
2.5 Gender
ALMA does not collect the gender of PIs during the proposal submission process, although PIs can optionally enter this information as part of their demographic profile. As mentioned previously, most PIs do not complete their demographic profiles and therefore this information was gathered manually. Lonsdale et al. (2016) compiled genders for ALMA PIs in Cycles 2-4 and kindly provided their database for this analysis. In collaboration with C. Lonsdale, a small number of gender assignments were corrected, and genders were identified for PIs from Cycles 0, 1, 5, and 6 that were not in the database. Genders were determined by using information on the internet or familiarity with the PI by the author or by colleagues. Software tools to identify the gender based on the first name were also utilized, but corroborating information was sought. While recognizing that the subject of gender identity is complex, genders were classified as “male” or “female” for this study.
2.6 Demographic overview
Tables 1 and 2 summarize the regional and gender demographics of the proposal PIs for each proposal cycle. The regional distribution of proposals has been fairly constant throughout the first seven cycles in that Chilean PIs have submitted 6% of the proposals, East Asian PIs 20%, European PIs 42%, North America 29%, and non-ALMA regions 3%. The overall fraction of PIs who are women has been increasing with time and is now nearly 34%. Europe and especially East Asia have seen significant increases in the percentage of female PIs from Cycles 0 and 1. North America has seen increases in the fraction of female PIs in the past two cycles while Chile has seen fewer female PIs recently compared to earlier cycles.
Table 3 shows the regional demographics of the proposal reviewers for each cycle. By design, reviewers are represented from all regions in proportion to the regional shares of time (10% for Chile, 22.5% for East Asia, and 33.75% each for Europe and North America). Reviewers from non-ALMA regions have also participated in each cycle. Relative to the regional distribution of PIs indicated in Table 1, Chilean and North America reviewers are represented in greater proportion than their share of proposal submissions, Europe is represented less, and East Asia is about equal. Each review panel has representation from each region and women to the extent possible. The percentage of reviewers who are women (43% on average) has been consistently greater than the percentage of proposals led by women (31% on average).
The JAO requests that reviewers serve 3 consecutive cycles as panel members, which implies there is overlap in the reviewer membership from cycle to cycle. The turnover in the reviewer membership originates from reviewers completing three years of service, the increase in the number of reviewers in some years to accommodate a larger number of proposals, and reviewers who choose not to serve all three years or not in consecutive years. On average, about 45% of the reviewers in a given cycle did not serve in the previous cycle.
| Cycle | Number | Region | ||||
|---|---|---|---|---|---|---|
| Proposals | Chile | East Asia | Europe | North America | Other | |
| 0 | 919 | 3.8% | 19.9% | 43.5% | 30.5% | 2.3% |
| 1 | 1131 | 5.7% | 18.7% | 43.0% | 29.9% | 2.7% |
| 2 | 1381 | 6.9% | 19.7% | 40.8% | 30.1% | 2.5% |
| 3 | 1578 | 7.3% | 18.8% | 41.6% | 29.4% | 2.9% |
| 4 | 1571 | 6.1% | 21.6% | 42.3% | 27.1% | 2.9% |
| 5 | 1661 | 5.3% | 20.0% | 42.2% | 29.6% | 2.9% |
| 6 | 1836 | 5.8% | 20.0% | 42.6% | 28.5% | 3.1% |
Note. — Table shows the percentage of proposal PIs from each region.
| Cycle | Chile | East Asia | Europe | North America | Other | All |
|---|---|---|---|---|---|---|
| 0 | 28.6% | 16.9% | 30.5% | 32.1% | 23.8% | 28.1% |
| 1 | 24.6% | 14.6% | 30.2% | 32.2% | 16.7% | 27.2% |
| 2 | 25.3% | 24.6% | 35.7% | 33.7% | 17.1% | 31.7% |
| 3 | 14.8% | 26.3% | 36.2% | 32.3% | 33.3% | 31.6% |
| 4 | 19.8% | 24.7% | 36.7% | 30.5% | 33.3% | 31.4% |
| 5 | 20.5% | 25.2% | 36.9% | 35.8% | 22.9% | 33.0% |
| 6 | 19.8% | 26.6% | 36.8% | 37.5% | 23.2% | 33.6% |
Note. — Table lists the percentage of PIs who are women in each region.
| Cycle | Number | Region | Gender | |||||
|---|---|---|---|---|---|---|---|---|
| Reviewers | Chile | East Asia | Europe | North America | Other | Female | Male | |
| 0 | 49 | 10.2% | 20.4% | 36.7% | 28.6% | 4.1% | 40.8% | 59.2% |
| 1 | 77 | 10.4% | 22.1% | 32.5% | 32.5% | 2.6% | 39.0% | 61.0% |
| 2 | 77 | 10.4% | 22.1% | 33.8% | 32.5% | 1.3% | 40.3% | 59.7% |
| 3 | 96 | 10.4% | 21.9% | 33.3% | 33.3% | 1.0% | 44.8% | 55.2% |
| 4 | 145 | 9.7% | 21.4% | 33.1% | 33.1% | 2.8% | 47.6% | 52.4% |
| 5 | 146 | 9.6% | 19.9% | 35.6% | 31.5% | 3.4% | 47.9% | 52.1% |
| 6 | 146 | 10.3% | 22.6% | 32.9% | 29.5% | 4.8% | 41.8% | 58.2% |
Note. — Table shows the regional and gender distribution of the ALMA reviewers.
3 Analysis of the Stage 1 Rankings
This section analyzes the Stage 1 proposal rankings to identify any systematics based on experience level (Section 3.1), regional affiliation (Section 3.2), and gender (Section 3.3) that are introduced in the preliminary reviewer scores. Potential systematics are examined by analyzing the cumulative distribution of proposal ranks; e.g., comparing the cumulative distribution of proposal ranks for female and male PIs. This approach has the advantage that differences anywhere along the cumulative profiles can be captured. The number of cumulative distributions being compared can be as few as two when comparing by gender, to as many as five for regional comparisons, and seven for experience-level comparisons.
The Anderson-Darling -sample test (Scholz et al., 1987) as implemented in scipy was used to measure the difference between cumulative distributions. The Anderson-Darling test statistic was then used to compute the probability (, ) that the samples are drawn from the same (but unspecified) population using the pval function within the kSamples package designed for R. A low value of suggests that the samples are drawn from different distributions while a high value of suggests that the samples have similar distributions. Any differences in the cumulative ranks are arbitrarily defined as “significant” if the probability that the distributions are drawn from the same population is and “marginally significant” if the probability is .
3.1 Experience level
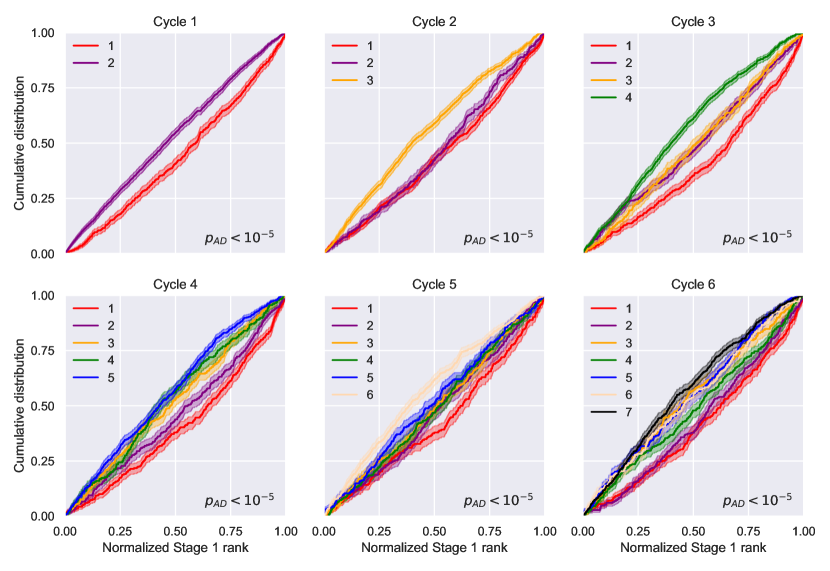
Figure 1 shows the cumulative distribution of Stage 1 proposal ranks by experience level for Cycles 1-6, where the experience level is at the time of the indicated cycle. Cycle 0 is not shown since all PIs submitted proposals for the first time. In this figure and all similar figures that follow, the solid line shows the cumulative distribution of ranks and the shaded region shows the 68.3% confidence interval (i.e., “1”) computed using the beta function. Since the best-ranked proposals have a normalized rank of 0 and the poorest-ranked proposals have a normalized rank of 1, curves shifted to the upper left have better overall ranks compared to curves shifted to the lower right. The probability () that the curves are drawn from the same population is indicated in the lower right of each panel.
As an example, the upper left panel in Figure 1 shows that in Cycle 1, PIs who submitted proposals in both Cycles 0 and 1 (experience level = 2) had better proposal ranks than first-time PIs in Cycle 1 (experience level = 1). The trend is present in each of the first, second, and third quartiles of the cumulative distributions. The difference in proposal ranks is significant in that the probability that the two distributions are drawn from the same population is . Each subsequent cycle shows the same trend in that PIs who have submitted proposals in more cycles tend to have better proposal ranks than PIs who have submitted proposals in fewer proposal cycles. The strongest and most persistent trend is that first-time PIs have the poorest proposal ranks, while PIs who submit proposals every cycle have the best proposal ranks. Proposal ranks for intermediate experience levels are also generally correlated with experience level. While not shown here, these basic trends are typically present within each region separately, although there are singular cycles where the trends are not strictly followed within a region.
3.2 Regional affiliation
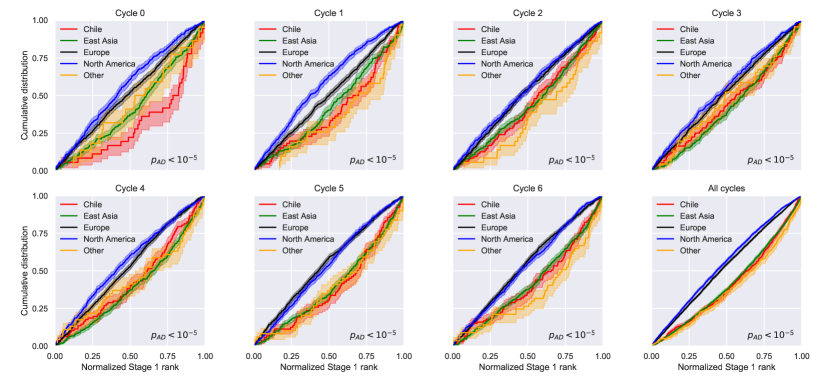
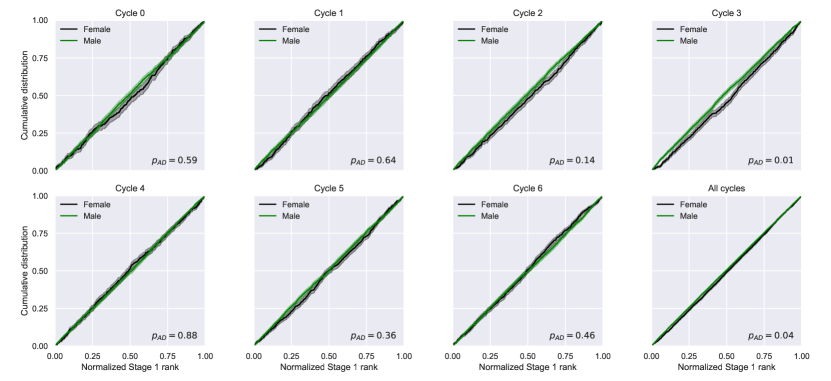
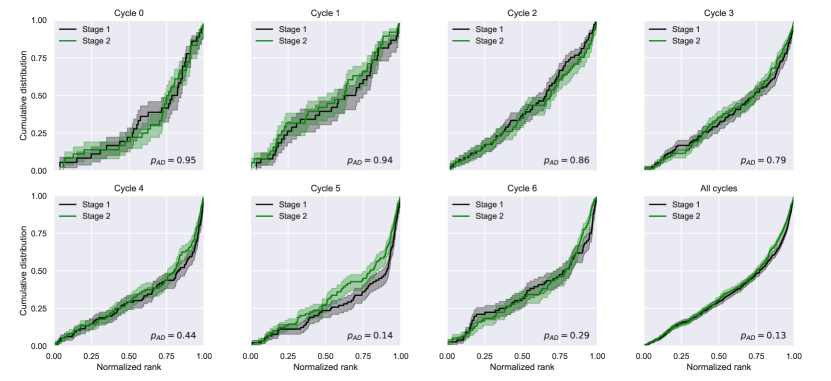
Figure 2 shows the cumulative distribution of Stage 1 proposal ranks by regional affiliation for Cycles 0–6. Each cycle exhibits the same trend in that PIs from North America and Europe have better proposal rankings overall than PIs from Chile, East Asia, and other regions. The trend is present and significant in each cycle. The differences appear to moderate somewhat in Cycles 2 and 3 but increase in Cycles 4-6.
In Cycles 0 and 1, North American PIs had better ranked proposals than European PIs. However, in later cycles, the differences diminished. Averaged over all cycles, there is a marginal tendency for North American proposals to have better ranks than European proposals, but the tendency vanishes if Cycles 0 and 1 are excluded. No significant difference in the proposals ranks are observed for Chilean and East Asian PIs within a cycle or when averaged over all cycles (=0.56).
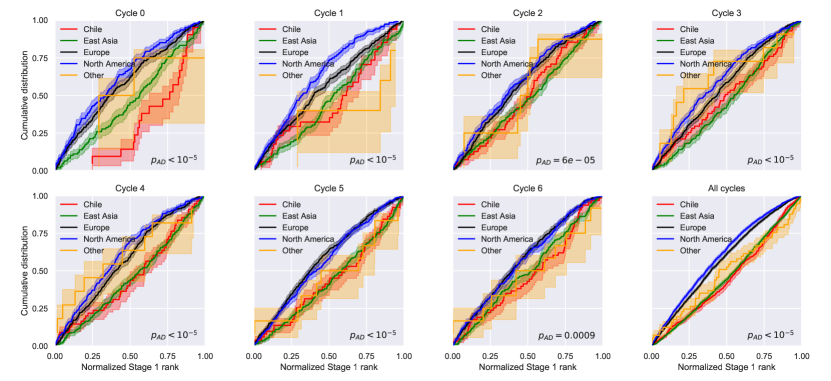
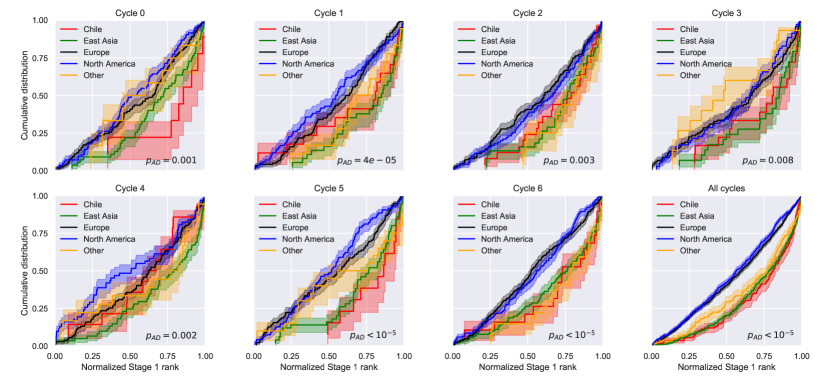
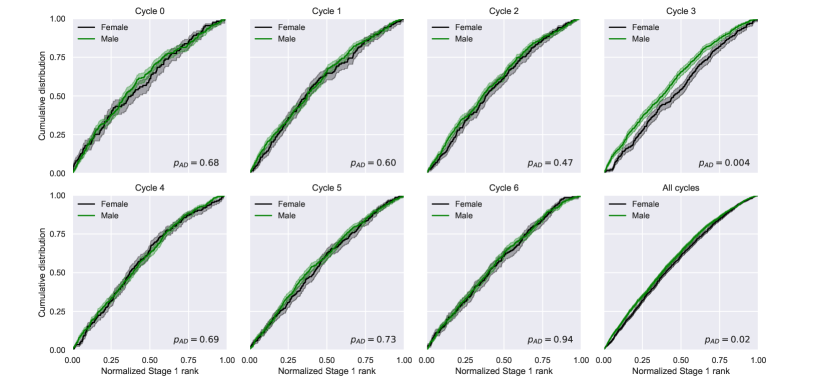
Differences in the relative proposal ranks by region transcend across the experience levels of the PIs. Figures 3 shows the cumulative proposal ranks by region for the most experienced PIs, defined as users who have submitted proposals in at least five of the seven cycles. Similarly, Figure 4 shows the results for PIs who have submitted proposals in only one or two cycles to select inexperienced ALMA users. In both subsamples, PIs from Europe and North America have significantly better proposal ranks than PIs from other regions.
3.3 Gender
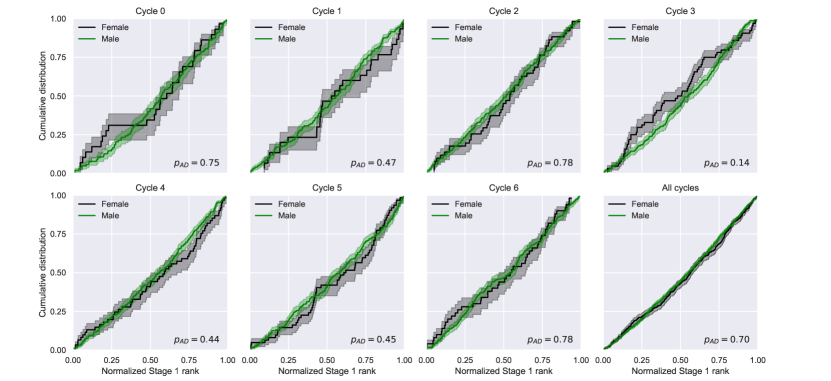
Figure 5 shows the cumulative distribution of Stage 1 proposal ranks by gender for each cycle. No significant difference between the proposal ranks for women or men exists in any individual cycle. Consistent with Lonsdale et al. (2016)333The Lonsdale et al. (2016) results differ in detail compared to this paper since they used a ranked list of proposals based on the Stage 2 results merged with the triaged proposals. This paper analyzes both the Stage 1 and Stage 2 results, but does not merge triaged proposals with the Stage 2 rankings., proposals led by men had better ranks than proposals led by women in Cycle 3 with marginal significance (=0.01) and to a lesser extent in Cycle 2 (=0.14). Averaged over all cycles, the probability that the distribution of proposal ranks are different based on gender is =0.04 and is marginally significant.
The results in Cycle 3 stand out in that men had better ranks than women when measured at the first, second, and third quartile points in the cumulative rankings. It is unclear why Cycle 3 would be noteworthy in this regard. No fundamental change was introduced in the review process itself, and the percentage of proposals from women and the percentage of women reviewers were in line with other cycles.
While the results of the Lonsdale et al. (2016) paper were posted after the Cycle 4 proposal review, preliminary results had been presented to the community before the Cycle 4 proposal review and the JAO communicated the results to the Cycle 4 reviewers at the Stage 2 orientation meeting. The Cycle 5 and 6 reviewers received guidance on the results and the role of unconscious bias in the written Stage 1 review instructions and at the Stage 2 orientation meeting. Once the presence of systematics began to be communicated (in Cycles 4-6), no discernible differences in the Stage 1 proposal rankings between women and men are evident in any individual cycle or when the three cycles are combined (=0.73). However, it is unclear that alerting the community after Cycle 3 actually contributed to reducing the gender-based systematic or if the results from Cycle 3 were just a statistical outlier.
One difficulty in interpreting Figure 5 is that any systematics between genders are much smaller than the systematics present by experience level and regional affiliation. Thus, changes in the underlying experience or regional demographics of the PIs can be responsible for the difference in the proposal ranks by gender (see also Patat, 2016). Given these considerations, subsets of the data are analyzed to further examine possible systematics in order to isolate the impact of gender alone.
Figure 6 shows the cumulative distribution of proposal ranks for PIs from Europe and North America who have submitted proposals in at least five cycles. Europe and North America were grouped together since they share similar proposal ranks overall. The most experienced PIs were selected since the fraction of women PIs has been increasing over time and first-time PIs typically have poorer proposal ranks. Figure 6 show that even among experienced PIs, women have had poorer ranked proposals than men when averaged over all cycles, but with marginal significance. The difference is driven by the significant difference found in Cycle 3. If Cycle 3 is excluded, any differences in the proposal rankings between experience female and male PIs are insignificant even when averaged over the other cycles (=0.25).
Figure 7 shows the difference in the proposal ranks for experienced PIs from Chile, East Asia, and non-ALMA regions. No significant difference in the proposal rankings are found even if averaged over all cycles (=0.70). Interestingly, in Cycle 3, women from Chile, East Asia, and non-ALMA regions had better proposal ranks than men, although the difference is not significant. Nonetheless, this is opposite of the trend found amount European and North American PIs. These different results suggests that any potential biases are complex and cannot be simply cast by gender alone.
4 Analysis of the Stage 2 Results
The analysis in Section 3 showed that systematics are introduced in the Stage 1 rankings, especially with respect to experience level and regional affiliation. In this section, any systematics in the Stage 2 results are analyzed. First, the triage proposals are analyzed to assess if any systematics are present with respect to gender (Section 4.1). Then the Stage 1 and Stage 2 rankings for the non-triaged proposals are compared to determine if any of the systematics identified in the Stage 1 rankings are amplified or reduced as a result of the face-to-face discussion (Section 4.2). Finally, the proposals added to the observing queue are analyzed to determine the acceptance rate of proposals with respect to gender (Section 4.3).
4.1 Triaged proposals
As described in Section 2.1, poorly ranked proposals are triaged after the Stage 1 review to reduce the number of proposals discussed at Stage 2. The JAO identifies the proposals that are triaged, but upon request the reviewers may resurrect a triaged proposal and have it discussed in the face-to-face review. Table 4 lists the fraction of triaged proposals that have a female PI. This triage fraction by gender should not be compared directly to the overall fraction of proposals led by women (see Table 2) to identify potential biases since the demographics of triaged proposals are not in general the same as the overall proposals. This is primarily because the gender balance differs between regions, and the fraction of proposals triaged per region will differ.
To account for the demographics of the triaged proposals, the expected number of triaged proposals with female PIs was estimated as the number of triaged proposals in a given demographic group multiplied by the fraction of all proposals with a female PI in that group. Formally, the expected fraction of triaged proposals with female PIs () is
| (1) |
where is the fraction of PIs with regional affiliation , experience level , and science category that are female; is the total number of triaged proposals in the demographic group, excluding proposals resurrected by reviewers. The uncertainties in the expected fraction were estimated assuming Poisson statistics on the number of female PIs used to compute .
The expected fraction of triaged proposals for female PIs is listed in of Table 4 by region and for all regions combined. In Cycles 1-5, female PIs across all regions had a larger fraction of the triaged proposals than expected based on the demographics and share of the proposals. The difference was largest in Cycle 3 as could have been anticipated based on the Stage 1 rankings (see Figure 5). Nonetheless, the differences are not statistically significant in any given cycle. Only in Cycle 6 did female PIs have a lower percentage of the triaged proposals than expected based on the model. These basic trends are seen in East Asia, Europe, and North America, although there are individual cycles where female PIs in East Asia (Cycles 1 and 2) and North America (Cycles 5 and 6) had fewer proposals triaged than expected. Notably in Europe, female PIs had a greater fraction of proposals triaged than expected in each cycle. The number of triaged proposals in Chile and non-ALMA regions are too small to identify any meaningful trends.
| Cycle | Chile | East Asia | Europe | North America | Other | All regions | ||||||
|---|---|---|---|---|---|---|---|---|---|---|---|---|
| 1 | 32.1% | 21.4% 6.2% | 12.9% | 15.0% 2.8% | 34.5% | 30.3% 2.6% | 30.9% | 33.3% 3.5% | 8.3% | 10.0% 7.1% | 27.8% | 26.0% 1.6% |
| 2 | 44.4% | 38.9% 8.7% | 23.3% | 25.8% 3.3% | 38.5% | 37.1% 2.8% | 41.9% | 34.8% 3.2% | 27.8% | 22.2% 9.4% | 35.2% | 32.9% 1.7% |
| 3 | 0.0% | 26.7% 12.5% | 27.6% | 23.2% 3.8% | 41.5% | 36.7% 2.5% | 41.5% | 32.9% 3.0% | 18.8% | 26.5% 8.0% | 39.3% | 34.2% 1.8% |
| 4 | 0.0% | 20.0% 20.0% | 29.8% | 25.5% 3.1% | 39.4% | 36.7% 2.6% | 32.7% | 31.6% 3.2% | 29.4% | 32.6% 12.1% | 34.5% | 32.0% 1.7% |
| 5 | 32.8% | 27.8% 3.3% | 43.2% | 38.0% 2.6% | 35.4% | 35.8% 3.0% | 25.0% | 22.4% 7.7% | 37.1% | 33.5% 1.7% | ||
| 6 | 22.6% | 24.6% 6.8% | 31.0% | 28.3% 3.1% | 38.0% | 37.3% 2.4% | 32.4% | 38.1% 3.0% | 14.7% | 16.2% 5.7% | 32.7% | 33.4% 1.5% |
Note. — The table lists the fraction of triaged proposals with a female PI () and the expected fraction () given the demographics of the triaged proposals, as described in the text. The results are given for each region and all regions combined. Cycle 0 is not listed since no proposals were triaged in that cycle.
4.2 Comparison of Stage 1 and Stage 2 rankings
This section compares the Stage 1 rankings with the Stage 2 rankings to determine if the systematics identified in Stage 1 change significantly as a result of the face-to-face discussion. The impact of the face-to-face discussions was assessed by comparing the cumulative Stage 1 and Stage 2 proposal rankings of the non-triaged proposals. The Stage 1 proposal rankings for the non-triaged proposals were extracted and then renormalized on a scale of 0 to 1 (see Section 2.2). This renormalization was needed to eliminate systematic differences between the Stage 1 and Stage 2 rankings since triaged proposals have preferentially poorer ranks by design.
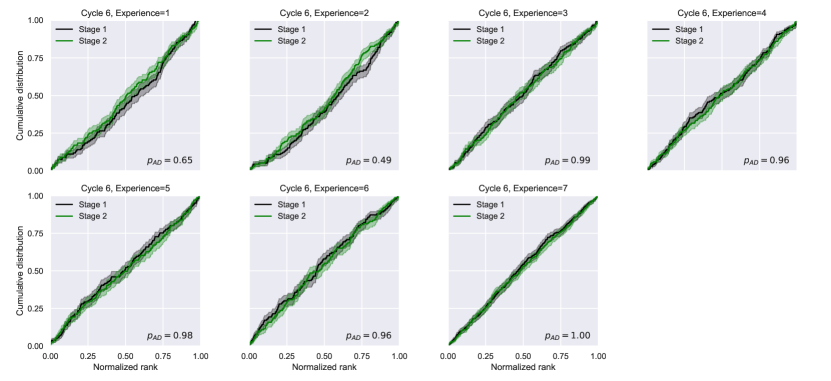
Figure 8 shows the cumulative distributions of Cycle 6 proposal rankings in Stage 1 and Stage 2 grouped by experience level. For each experience level, the cumulative distributions for the Stage 1 and Stage 2 normalized ranks are similar and none of the differences are considered even marginally significant. While not shown here, previous cycles have similar results. The ranks for individual proposals did in fact change between the Stage 1 and Stage 2 reviews, but Figure 8 indicates no systematic differences were introduced based on the experience level of the PI.
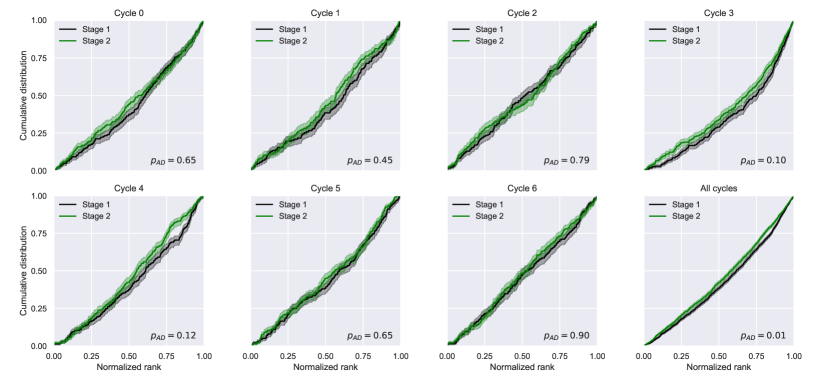
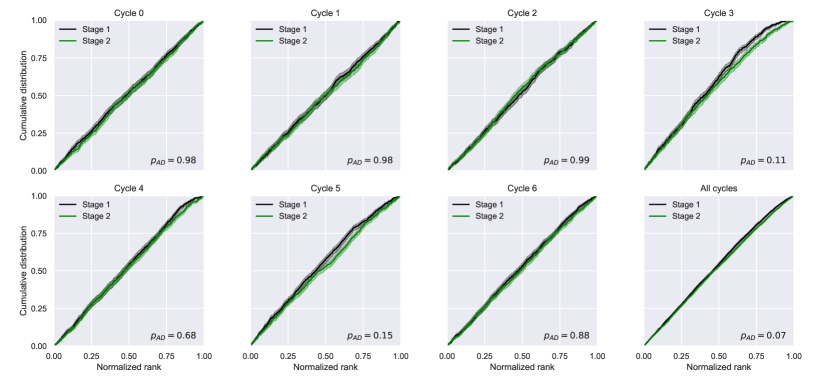
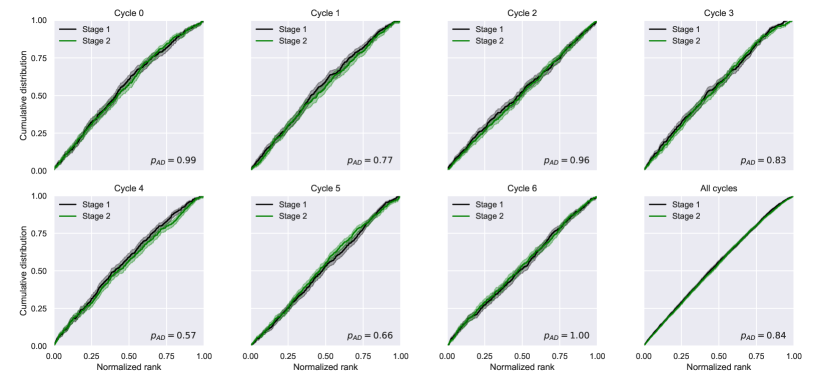
Figures 9, 10, 11, and 12 compare the Stage 1 and Stage 2 proposal ranks in all seven ALMA cycles for PIs from Chile, East Asia, Europe, and North America, respectively. Each figure also includes a plot that combines the results from all cycles. While none of the differences between the Stage 1 and Stage 2 ranks are significant in any given region or cycle, some tendencies are seen. Proposals from East Asia tend to be rated better as a result of the face-to-face discussions. This was most notable in Cycle 3 and to a less extent in Cycles 1, 4, and 6 (Figure 10). In contrast, European PIs (Figure 11) tended toward lower ranks after the face-to-face discussions in Cycle 3 (third and fourth quartiles) and Cycle 5 (second and third quartiles).
Combining all cycles, the probability that the Stage 1 and Stage 2 cumulative ranks for non-triaged proposals originate from the same population is 0.13 for Chile, 0.013 for East Asia, 0.07 for Europe, and 0.84 for North America. Thus there is a marginally significant tendency for the face-to-face discussion to improve the rankings of East Asian proposals while negatively impacting the overall European proposal ranks.

Figure 13 shows the cumulative Stage 1 and Stage 2 rankings for the non-triaged proposals led by women. No significant or marginally significant differences between the two distributions are seen in any cycle. When averaged over all cycles, the probability is 0.91 that the Stage 1 and Stage 2 ranks for non-triaged proposals led by women PIs share the same population. Thus the two distributions are indistinguishable.
In summary, the results shown in Figures 8-13 indicate that no significant systematics in the proposal rankings are introduced by the face-to-face review in terms of experience, regional affiliation, or gender in any given cycle. When averaged over all cycles, East Asian proposals tend to improve their rankings in the Stage 2 process relative to Stage 1.
4.3 Proposal priority grades
Priority grades for the observing queue are assigned to the proposals by the JAO based on the Stage 2 rankings and also the share of time per executive. In recent cycles, balancing the proposal pressure in the various array configurations, local sidereal time, and weather conditions have also been considered. Thus the systematic in the proposal rankings by region is partially compensated for when assigning priority grades by ensuring each region obtains their pre-determined share of time. However, any systematics with gender in the proposal rankings are not considered when assigning grades.
Similar to the analysis of the gender distribution of triaged proposals, demographics need to be considered when comparing the acceptance rate of proposals led by men and women. The expected acceptance rate, where an “accepted” proposal is defined as receiving a priority grade of A or B, was computed as
| (2) |
where is the fraction of the proposals in the demographic group that have gender , is the number of proposals awarded grade A or B, and is the total number of submitted proposals.
Table 5 lists the proposal acceptance rate by cycle for female and male PIs and the expected acceptance rate based on demographics. Because of the demographics, the overall acceptance rate of female PIs is expected to be lower than male PIs. This can be attributed primarily to regional differences in that Europe and North America have the highest regional fraction of female PIs and high oversubscription rates while Chile and East Asia have a lower fraction of female PIs and often lower oversubscription rates. In addition, an increasing fraction of the PIs in East Asia and Europe are female, and relatively inexperienced PIs have poorer proposal rankings.
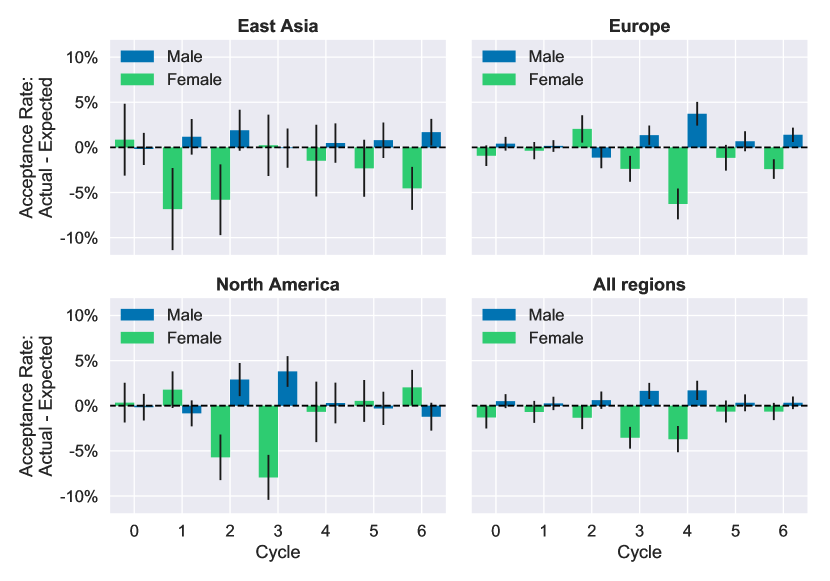
Figure 14 plots the difference between the actual and expected proposal acceptance rate by gender for East Asia, Europe, North American, and all regions combined, including Chile and non-ALMA regions. Plots are not shown for Chile and non-ALMA regions since these regions have relatively few proposals and have large uncertainties. Considering all regions, female PIs have had a smaller fraction of their proposals assigned priority Grade A or B than expected in each cycle, although the differences are not statistically significant in any given cycle. Conversely, male PIs have had a higher acceptance rate than expected in each cycle. The difference was largest is Cycles 3 and 4 and has diminished in Cycles 5 and 6. The Cycle 3 result was anticipated based on the Stage 1 rankings (see Figure 5). The Cycle 4 result is more surprising in that the Stage 1 rankings for female and male PIs in Cycle 4 are indistinguishable. However, in that cycle, female PIs tended to have lower proposal ranks after the Stage 2 process (see Figure 13). Even though the difference was not statistically significant, it was enough to lower the overall acceptance rate.
The trends are similar for individual regions. In East Asia, female PIs have had a lower acceptance rate than expected in 5 of the 7 cycles. In Europe, female PIs exceeded the expected acceptance rate in only one cycle. While female PIs in North America have exceeded expectations in 4 of the 7 cycles, the cycles where the acceptance rate is below expectations (Cycles 2 and 3 in particular) are more extreme than when the acceptance rate is higher than expected.
| Cycle | Female | Male | ||
|---|---|---|---|---|
| Chile | ||||
| 0 | 10.0% | 44.3% 16.2% | 56.0% | 42.3% 9.9% |
| 1 | 37.5% | 46.3% 13.6% | 34.7% | 31.8% 5.5% |
| 2 | 33.3% | 23.0% 5.5% | 36.6% | 40.1% 5.2% |
| 3 | 23.5% | 25.6% 8.1% | 39.8% | 39.4% 4.4% |
| 4 | 15.8% | 28.6% 7.1% | 44.2% | 41.0% 5.5% |
| 5 | 61.1% | 55.3% 13.8% | 52.9% | 54.3% 7.1% |
| 6 | 42.9% | 29.7% 8.2% | 31.8% | 35.0% 4.4% |
| East Asia | ||||
| 0 | 22.6% | 21.7% 4.0% | 21.1% | 21.2% 1.8% |
| 1 | 16.1% | 23.0% 4.5% | 24.9% | 23.7% 2.0% |
| 2 | 23.9% | 29.7% 3.9% | 32.7% | 30.8% 2.3% |
| 3 | 28.2% | 28.0% 3.4% | 29.7% | 29.8% 2.2% |
| 4 | 31.3% | 32.8% 4.0% | 32.4% | 31.9% 2.2% |
| 5 | 21.4% | 23.7% 3.2% | 28.0% | 27.3% 2.0% |
| 6 | 14.3% | 18.8% 2.4% | 22.3% | 20.6% 1.5% |
| Europe | ||||
| 0 | 11.5% | 12.4% 1.1% | 12.9% | 12.5% 0.8% |
| 1 | 10.2% | 10.6% 0.9% | 11.2% | 11.1% 0.6% |
| 2 | 21.9% | 19.9% 1.5% | 19.9% | 21.0% 1.2% |
| 3 | 18.1% | 20.4% 1.4% | 21.7% | 20.4% 1.1% |
| 4 | 18.7% | 24.9% 1.7% | 28.3% | 24.6% 1.3% |
| 5 | 20.0% | 21.2% 1.4% | 21.9% | 21.3% 1.1% |
| 6 | 14.1% | 16.5% 1.1% | 16.9% | 15.5% 0.8% |
| North America | ||||
| 0 | 21.1% | 20.8% 2.2% | 20.0% | 20.2% 1.5% |
| 1 | 22.0% | 20.2% 2.0% | 19.7% | 20.5% 1.4% |
| 2 | 21.4% | 27.1% 2.5% | 31.2% | 28.3% 1.8% |
| 3 | 20.7% | 28.6% 2.5% | 32.2% | 28.4% 1.7% |
| 4 | 35.9% | 36.6% 3.3% | 37.0% | 36.7% 2.2% |
| 5 | 28.7% | 28.2% 2.3% | 29.6% | 29.9% 1.8% |
| 6 | 25.8% | 23.7% 1.9% | 24.0% | 25.2% 1.5% |
| Other | ||||
| 0 | 20.0% | 7.3% 3.6% | 6.2% | 10.2% 3.5% |
| 1 | 20.0% | 20.0% 14.1% | 4.0% | 4.0% 2.8% |
| 2 | 0.0% | 8.3% 5.9% | 13.8% | 12.1% 6.1% |
| 3 | 20.0% | 19.6% 6.9% | 13.3% | 13.6% 4.8% |
| 4 | 40.0% | 29.0% 9.5% | 26.7% | 32.2% 8.1% |
| 5 | 9.1% | 14.4% 7.5% | 13.5% | 11.9% 3.0% |
| 6 | 30.8% | 25.6% 10.7% | 2.3% | 3.9% 1.6% |
| All regions | ||||
| 0 | 16.3% | 17.6% 1.2% | 18.3% | 17.8% 0.8% |
| 1 | 16.6% | 17.2% 1.2% | 17.7% | 17.5% 0.7% |
| 2 | 22.4% | 23.7% 1.3% | 27.0% | 26.4% 1.0% |
| 3 | 20.7% | 24.2% 1.2% | 27.8% | 26.1% 0.9% |
| 4 | 25.9% | 29.6% 1.5% | 32.8% | 31.1% 1.1% |
| 5 | 24.2% | 24.8% 1.2% | 27.2% | 26.8% 0.9% |
| 6 | 19.2% | 19.8% 1.0% | 20.5% | 20.2% 0.7% |
Note. — The table lists the fraction of proposals assigned priority grade A or B () with a female or male PI. Also listed is the expected fraction () given the demographics of the accepted proposals, as described in the text.
5 Summary and Conclusions
An analysis is presented of the outcomes of the proposal review process in ALMA Cycles 0-6 to identify systematics in the proposal rankings that may signify potential bias with respect to the experience level, regional affiliation, or gender of the PI. The analysis was conducted for both the Stage 1 rankings, which are based on the preliminary scores of the reviewers, and the Stage 2 rankings, which are based on the face-to-face panel discussions. The results show that systematics are introduced primarily in the Stage 1 process and not the face-to-face discussion.
One significant trend is that PIs who submit proposals every cycle have better proposal ranks than PIs who have submitted proposals for the first time. The trend is also present within intermediate levels of experience. One should not expect a completely random correlation of the proposal ranks with experience level since many expert PIs will have a detailed understanding on how best to use the ALMA and it would not be surprising if they can write compelling proposals. Also, PIs who resubmit previously declined proposals have feedback from the reviewers on how to improve the proposal. The question remains, however, to what degree reviewers give experienced PIs leeway in the proposal review on perceived prestige, but the data in hand cannot address that question directly.
A second significant trend is that proposals submitted by PIs from North America and Europe have better ranked proposals than PIs from East Asia and Chile, although a small improvement in the proposal rankings for East Asia are observed as a result of the Stage 2 discussions. This trend is not unique to ALMA. Reid (2014) reports that PIs from Europe and North America have a higher success rate on proposals submitted to the Hubble Space Telescope (HST) than PIs from the rest of the world.
While the origin of the trend in the ALMA proposal rankings with region is unclear, one speculation is that it can be attributed to differences in the proficiency in using the English language. ALMA proposals are mandated to be written in English, which is a second language for a large fraction of ALMA PIs. However, the proficiency level in English likely varies between regions and may cause reviewers to penalize proposals that are not as well written even if the underlying science is strong. Stylistic differences in how a proposal is structured may also potentially exist between regions. Hall (1976) introduced the concept of high- and low-context communication and indicated communication styles can vary between countries. High-context cultures rely heavily on non-verbal methods to convey information, while low-context cultures communicate information primarily through language. Hall (1976) indicated that Japan has high-context communication while the United States is low context. Since approximately two thirds of the ALMA reviewers are from Europe and North America, the proposal rankings could reflect preference toward proposal styles from those regions or that low-context styles are more suitable to proposal peer review. It is tempting to conclude that the improvement in the scientific rankings of East Asian proposals during the Stage 2 face-to-face discussions is a result of overcoming potential language biases or stylistic differences to select the best science, but that remains speculation for now.
As noted by Lonsdale et al. (2016), male PIs tend to have better ALMA proposal ranks than female PIs in Cycles 2-4. This was most apparent in Cycle 3, but since then, no measurable differences exist in the cumulative Stage 1 proposal rankings between women and men in Cycles 4-6 even when individual cycles are combined. Nonetheless, the proposal acceptance rates, which ultimately reflect what is scheduled on the telescope, show a similar trend as HST (Reid, 2014) and ESO (Patat, 2016) in that proposals with female PIs have had a lower success rate in receiving telescope time than proposals with male PIs, even after accounting for demographic differences by region, experience, and science category. The difference between the actual and expected proposal acceptance rate for women is not significant in any given cycle, but is present in each cycle when considering all regions combined. Whether the systematic differences in the acceptance rate represents a bias in the review process or an unaccounted for demographic difference between women and men (e.g., seniority; c.f. Patat, 2016) is unclear.
Identifying the underlying causes of the systematics in the proposal rankings is difficult. Multiple factors could plausibly contribute to the observed trends and limited ancillary demographic data (e.g., seniority of the PI) is present to test various hypotheses. A deeper and more sophisticated analysis than presented here may clarify some of the causes, including understanding to what extent any systematics depend on the regional affiliation of the proposal reviewers. Establishing an objective measure of any stylistic differences in the proposals by region in particular could yield important insights into the region-based systematics.
In Cycle 7, ALMA took steps to reduce the impact of potential biases in the review process. The investigators were listed in random order on the proposal coversheet such that reviewers will know the members of the proposal team but not the identity of the PI. Also, first names were listed only by the first initial so that the gender cannot be readily inferred. These steps are expected to reduce biases that may be triggered by simply knowing the name of the PI, but other systematics identified here could remain. For example, if the differences in proposal ranks by region are caused by language or style, the systematics in the proposal rankings by region should not change.
These steps to modify the proposal coversheet follow those taken by the HST after Reid (2014) identified a small but persistent effect where the acceptance rate of HST proposals was lower for women (19% on average) than men (23% on average). Similar steps have recently been taken at ESO. Interestingly, the difference in the acceptance rate of HST proposals by gender persisted even after anonymizing the PIs. Only after the list of investigators was completed hidden from the reviewers in a double-anonymous review did the acceptance rate for proposals led by women exceed that of men (Strolger & Natarajan, 2019). ALMA is following the HST experience and is considering implementing a double-anonymous review in future cycles.
References
- Astropy collaboration et al. (2018) Astropy collaboration, Price-Whelan, A. M., Sipőcz, B. M., et al. 2018, AJ, 156, 123
- Greaves (2018) Greaves, J. 2018, RNAAS, 2, 203
- Hall (1976) Hall E. T. 1976, Beyond Culture. New York: Anchor Books/Doubleday
- Hunt et al. (2019) Hunt, G., Schwab, F. R., & Ball, L. 2019, NRAO Telescope Time Allocation Report #3
- Jones et al. (2001) Jones, E., Oliphant, T., Peterson, P., et al. 2001, SciPy: Open Source Scientific Tools for Python, http://www.scipy.org/
- Lonsdale et al. (2016) Lonsdale, C. J., Schwab, F. R., & Hunt, G. 2016, arXiv:1611.04795
- Patat (2016) Patat, F. 2016, Messenger, 165, 2
- Reid (2014) Reid, N. I. 2014, PASP, 126, 923
- Scholz et al. (1987) Scholz, F. W & Stephens, M. A. 1987, Journal of the American Statistical Association, 82, 918
- Scholz & Zhu (2019) Scholz, F. & Zhu, A. 2019, kSamples: K-Sample Rank Tests and their Combinations v. 1.2-9, https://CRAN.R-project.org/package=kSamples
- Strolger & Natarajan (2019) Strolger, L., & Natarajan, P. 2019, Physics Today, Volume 72, issue 3
Appendix A Proposal Acceptance Rate for ALMA Reviewers
Greaves (2018) analyzed the proposal statistics for an anonymous observatory using published lists of reviewers and accepted proposals. Private communication with J. Greaves confirmed that the observatory is ALMA. The main result of the paper is that the Cycles 2-4 reviewers had a three-fold increase in the number of proposals accepted while serving on the panel compared to when they were not serving on a review panel. The inference was that there is a bias in the review process where reviewers preferentially favor proposals from the other review participants. Since the proposals submitted by a given reviewer are generally reviewed in a different panel, the implication is that reviewers are predisposed toward proposals from reviewers in other panels. A limitation of this analysis, however, is that Greaves (2018) did not have access to the total number of proposals submitted by the reviewers and could not compute the fraction of submitted proposals that were accepted.
This appendix investigates the result from Greaves (2018) by analyzing both the accepted and rejected proposals to examine the proposal acceptance rate of the reviewers and not just the number of accepted proposals. Table 6 presents the number of proposals submitted and accepted by cycle for reviewers while they served on the ALMA review panels in any cycle and when they were not on the review panels. Most reviewers serve for three consecutive cycles. For example, the Cycle 0 reviewers also typically served on the review panels in Cycles 1 and 2. The Cycle 0 reviewers submitted 130 proposals while serving on a panel in any cycle, and 48 were awarded Grade A or B for an overall acceptance fraction of 36.9%. By comparison, when the Cycle 0 reviewers were not serving on a panel, they have submitted 187 proposals and 60 have been awarded Grade A or B for an acceptance fraction of 32.1%. The uncertainties in each of the acceptance fractions is 4%, and therefore the difference in the acceptance rate between when on and off a panel is not significant.
Examining all cycles, reviewers serving on the panels in Cycles 0-4 tend to have a higher acceptance rate than when they are not on the panels. The trend reversed in Cycles 5 and 6 when the reviewers had a lower acceptance rate. When measured over all cycles, the acceptance of reviewers when serving on the panel is 36.9%1.1 compared to 34.5%0.9 when not present on the panels. None of these differences are statistically significant. Thus no discernible bias is present that favors ALMA reviewers when they are present on the panels versus when they are off the panels.
The second column in Table 6 shows the fraction of proposals accepted for all PIs in that cycle. The acceptance rate for all PIs varies between 17.4% and 30.2% depending on the oversubscription rate in a given cycle. Table 6 shows that reviewers consistently have a higher acceptance rate than the overall average by as much as a factor of two in some cycles. However, this trend is present when the reviewers are not on the panels. In conclusion, the astronomers selected to serve on the ALMA review panels do have an higher acceptance rate than the typical PI, but this is true even when they are not serving on a panel.
| Cycle | All PIs | Reviewers serving on a panel | Reviewers not serving on a panel | ||||
|---|---|---|---|---|---|---|---|
| Acceptance | Submitted | Accepted | Acceptance | Submitted | Accepted | Acceptance | |
| fraction | fraction | fraction | |||||
| 0 | 130 | 48 | 187 | 60 | |||
| 1 | 211 | 79 | 279 | 93 | |||
| 2 | 233 | 92 | 292 | 97 | |||
| 3 | 234 | 95 | 271 | 95 | |||
| 4 | 350 | 128 | 497 | 165 | |||
| 5 | 343 | 118 | 565 | 197 | |||
| 6 | 348 | 122 | 704 | 258 | |||
| All | 1849 | 682 | 2795 | 965 | |||