Mid-infrared evolution of Car from 1968 to 2018††thanks: Based on observations collected at ESO’s Very Large Telescope under Prog-IDs: 074.A-9016(A), 0101.D-0077(A). Based on observations made with ESO Telescopes at the La Silla Paranal Observatory under Prog-IDs: 60.A-9126(A,C,E,I), 69.D-0304(B),71.D-0049(A). ,
Eta Car is one of the most luminous and massive stars in our Galaxy and is the brightest mid-infrared (mid-IR) source in the sky, outside our solar system. Since the late 1990s the central source has dramatically brightened at ultraviolet and optical wavelengths. This might be explained by a decrease in circumstellar dust extinction. We aim to establish the mid-IR flux evolution and further our understanding of the star’s ultraviolet and optical brightening. Mid-IR images from m were obtained in 2018 with VISIR at the Very Large Telescope. Archival data from 2003 and 2005 are retrieved from the ESO Science Archive Facility and historical records are collected from publications. We present the highest angular resolution mid-IR images of Car to date at the corresponding wavelengths (). We reconstruct the mid-IR evolution of the spectral energy distribution of the spatially integrated Homunculus nebula from 1968 to 2018 and find no long-term changes. Eta Car’s bolometric luminosity has been stable over the past five decades. We do not observe a long-term decrease in the mid-IR flux densities that could be associated with the brightening at ultraviolet and optical wavelengths, but circumstellar dust must be declining in our line-of-sight only. Short-term flux variations within about 25% of the mean levels could be present.
Key Words.:
circumstellar matter – Stars: individual: eta Car – Stars: massive – Stars: mass-loss – Stars: variables: S Doradus – Stars: winds, outflows1 Introduction
Eta Car is the archetype of unstable massive stars, eruptive mass loss, supernova (SN) impostors, and a reference for understanding the precursor eruptions that lead to superluminous SNe. The star has a current mass of about and is in an eccentric binary system (Damineli et al. 1997, Davidson & Humphreys 2012 and references therein). During an eruptive event in the 19th century (see Frew 2004 for the historical lightcurve), the system ejected of material (Morris et al. 2017; see also Smith et al. 2003), forming the bipolar Homunculus nebula.
Eta Car is often described as an extreme case of a Luminous Blue Variable (LBV). LBVs are evolved massive stars with initial masses that exhibit instabilities that are not understood, resulting in enhanced mass loss (Conti 1984; 1997, Humphreys & Davidson 1994, Nota & Lamers 1997). They have been considered to be stars in transition to the Wolf-Rayet stage (e.g., Maeder 1983, Langer et al. 1994), but more recent observational and theoretical work suggests that some LBVs could be the immediate progenitors of SNe (e.g., Kotak & Vink 2006, Trundle et al. 2008, Gal-Yam & Leonard 2009, Smith et al. 2007, Groh et al. 2013).
A crucial parameter for understanding Car is the luminosity since this provides a mass estimate via the Eddington limit. Most of Car’s visible and ultraviolet (UV) light is absorbed by circumstellar dust and re-radiated in the infrared (IR; Davidson 1971, Davidson & Ostriker 1972, Pagel 1969, Westphal & Neugebauer 1969, Robinson et al. 1973, Sutton et al. 1974). The star’s luminosity can thus be obtained from the IR spectral energy distribution (SED). Eta Car is unparalleled as an IR radiation source and its brightness makes observations with sensitive IR satellite instrumentation impossible. Most of the of cool dust is located in the central region in a “disrupted” equatorial structure (Morris et al. 1999; 2017), also referred to as the “Butterfly” nebula (Chesneau et al. 2005). Early estimates of Car’s total luminosity are on the order of (Neugebauer & Westphal 1968, Westphal & Neugebauer 1969, Pagel 1969, Robinson et al. 1973, Sutton et al. 1974, Cox et al. 1995, Davidson & Humphreys 1997). Morris et al. (2017) conclude that Car’s total luminosity in the 1970s was , for the commonly adopted distance of 2.3 kpc. A distance revision to 2.6 kpc could imply a increase in luminosity (Davidson et al. 2018a). The luminosity of the secondary star is a factor of 10 lower (Mehner et al. 2010).
Some authors have suggested a change in the mid-IR flux since the 1970s. Russell et al. (1987) reported a 30% decrease in the m silicate emission compared to values for the 1970s. Smith et al. (1995) found a significant decrease in mid-IR flux in the 1990s compared to the 1970s. Morris et al. (2017) derive a total luminosity of for the 1990s, a decline of 25% in 20 yr. They argue that the decline in mid-IR flux indicates a reduction in circumstellar extinction either by the expansion of dust “shells” or dust destruction. This could cause the simultaneous brightening at UV and optical wavelengths (Davidson et al. 1999; 2005, Martin et al. 2006).
We present newly obtained and previously unpublished mid-IR observations, which are the basis of a re-evaluation of Car’s mid-IR evolution from 1968 to 2018. In Section 2 we describe the new mid-IR images. We present our findings and re-analyze Car’s SED over a period of 50 years in Section 3. In Section 4 we conclude that Car has not undergone any appreciable long-term luminosity changes during this period.
2 Mid-IR observations in 2005 and 2018 with VISIR and in 2003 with TIMMI2
| Filter | Wavelength | Date | Flux | Error flux |
| density | densitya | |||
| (m) | (Jy) | (Jy) | ||
| VISIR | ||||
| J7.9 | 7.78 | 2018-05-21 | 9648 | 30 |
| PAH1 | 8.59 | 2018-04-28 | 19280 | 40 |
| ArIII | 8.99 | 2018-12-10 | 31140 | 80 |
| SIV_1 | 9.82 | 2018-05-21 | 51030 | 220 |
| SIV | 10.49 | 2018-04-29 | 54520 | 160 |
| PAH2 | 11.25 | 2018-12-10 | 66660 | 210 |
| B12.4 | 12.47 | 2018-04-29 | 53930 | 230 |
| NeII | 12.81 | 2018-12-10 | 63120 | 470 |
| NeII_2 | 13.04 | 2018-12-10 | 58410 | 450 |
| Q1 | 17.65 | 2018-05-11 | 93040 | 2690 |
| Q2 | 18.72 | 2018-05-11 | 100810 | 3550 |
| Q3 | 19.50 | 2018-05-11 | 97380 | 9940 |
| PAH2 | 11.25 | 2005-01-23 | 61350 | 390 |
| NeIIb | 12.81 | 2005-01-23 | 44420 | 1050 |
| TIMMI2c | ||||
| M | 4.6 | 2003 | 3590 | 1230 |
| N7.9 | 7.9 | 2003 | 13260 | 3880 |
| N8.9 | 8.7 | 2003 | 23650 | 7810 |
| N9.8 | 9.6 | 2003 | 40590 | 2840 |
| N10.4 | 10.3 | 2003 | 47710 | 5060 |
| N11.9 | 11.6 | 2003 | 63360 | 6980 |
| N12.9 | 12.3 | 2003 | 60000 | 6100 |
| NeII | 12.8 | 2003 | 80960 | 8170 |
| Q1 | 17.8 | 2003 | 122190 | 15190 |
| a Formal errors from the flux calibration. Systematic | ||||
| uncertainties due to sky variability and detector artifacts can | ||||
| be larger than for band and for band. | ||||
| b Observations are strongly impacted by ghosts. | ||||
| c Average of observations in January, March, and May 2003. | ||||
| The data are badly affected by stripe patterns. | ||||
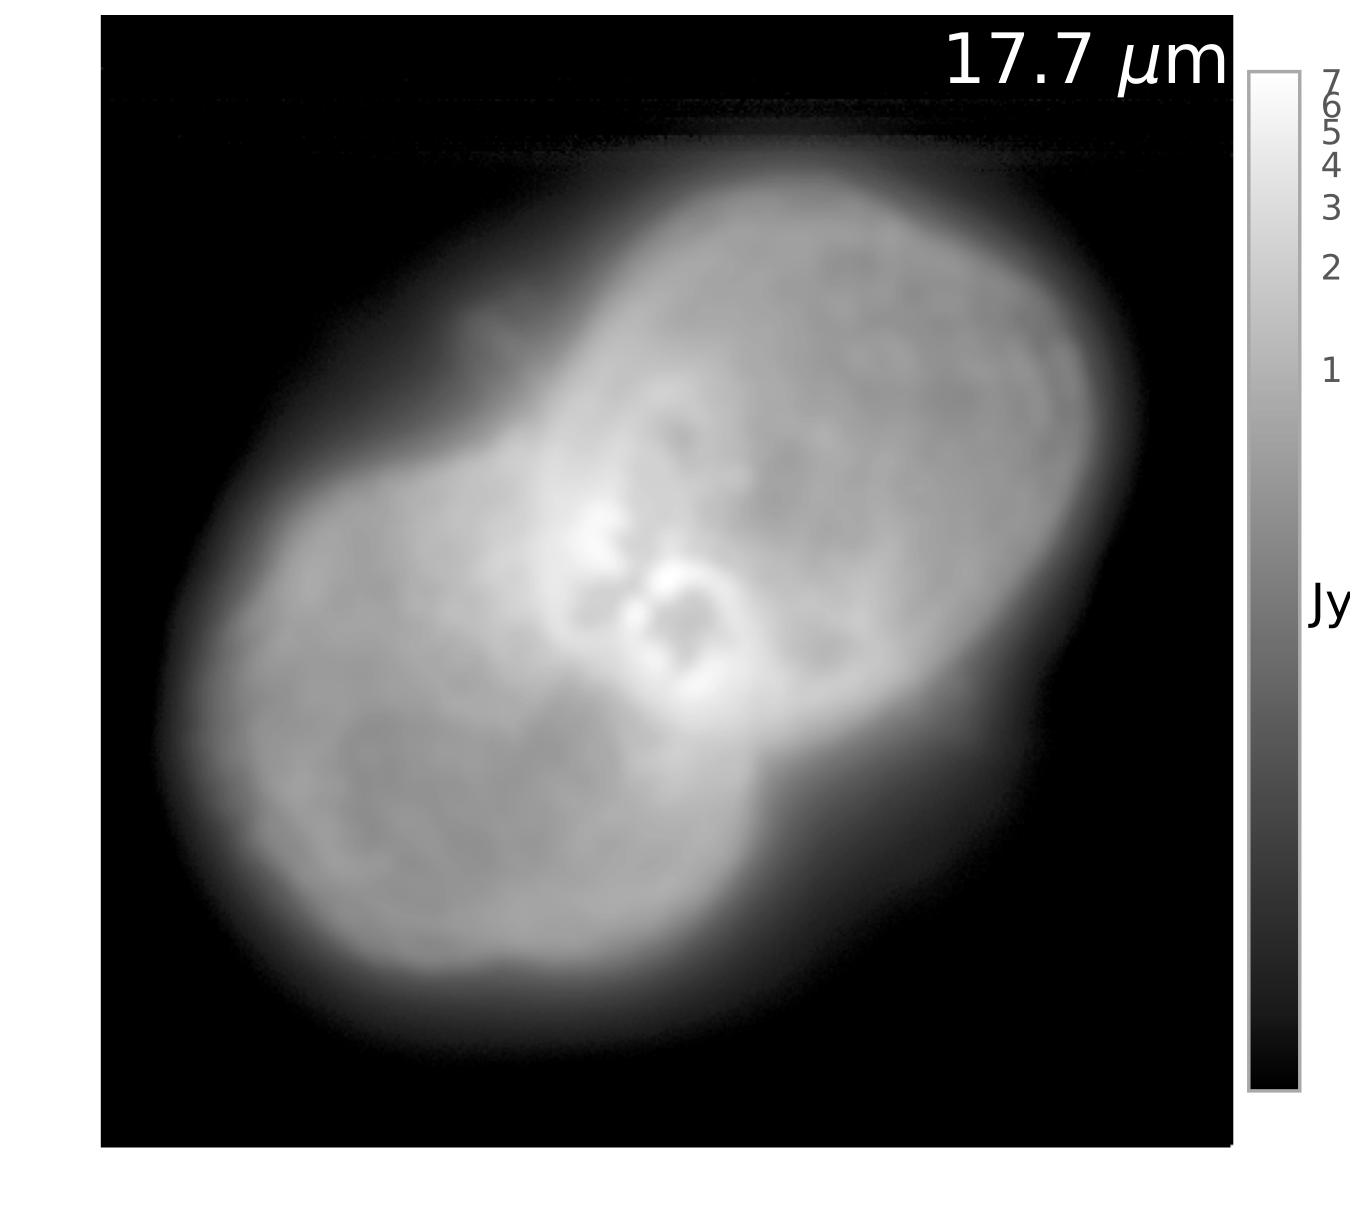
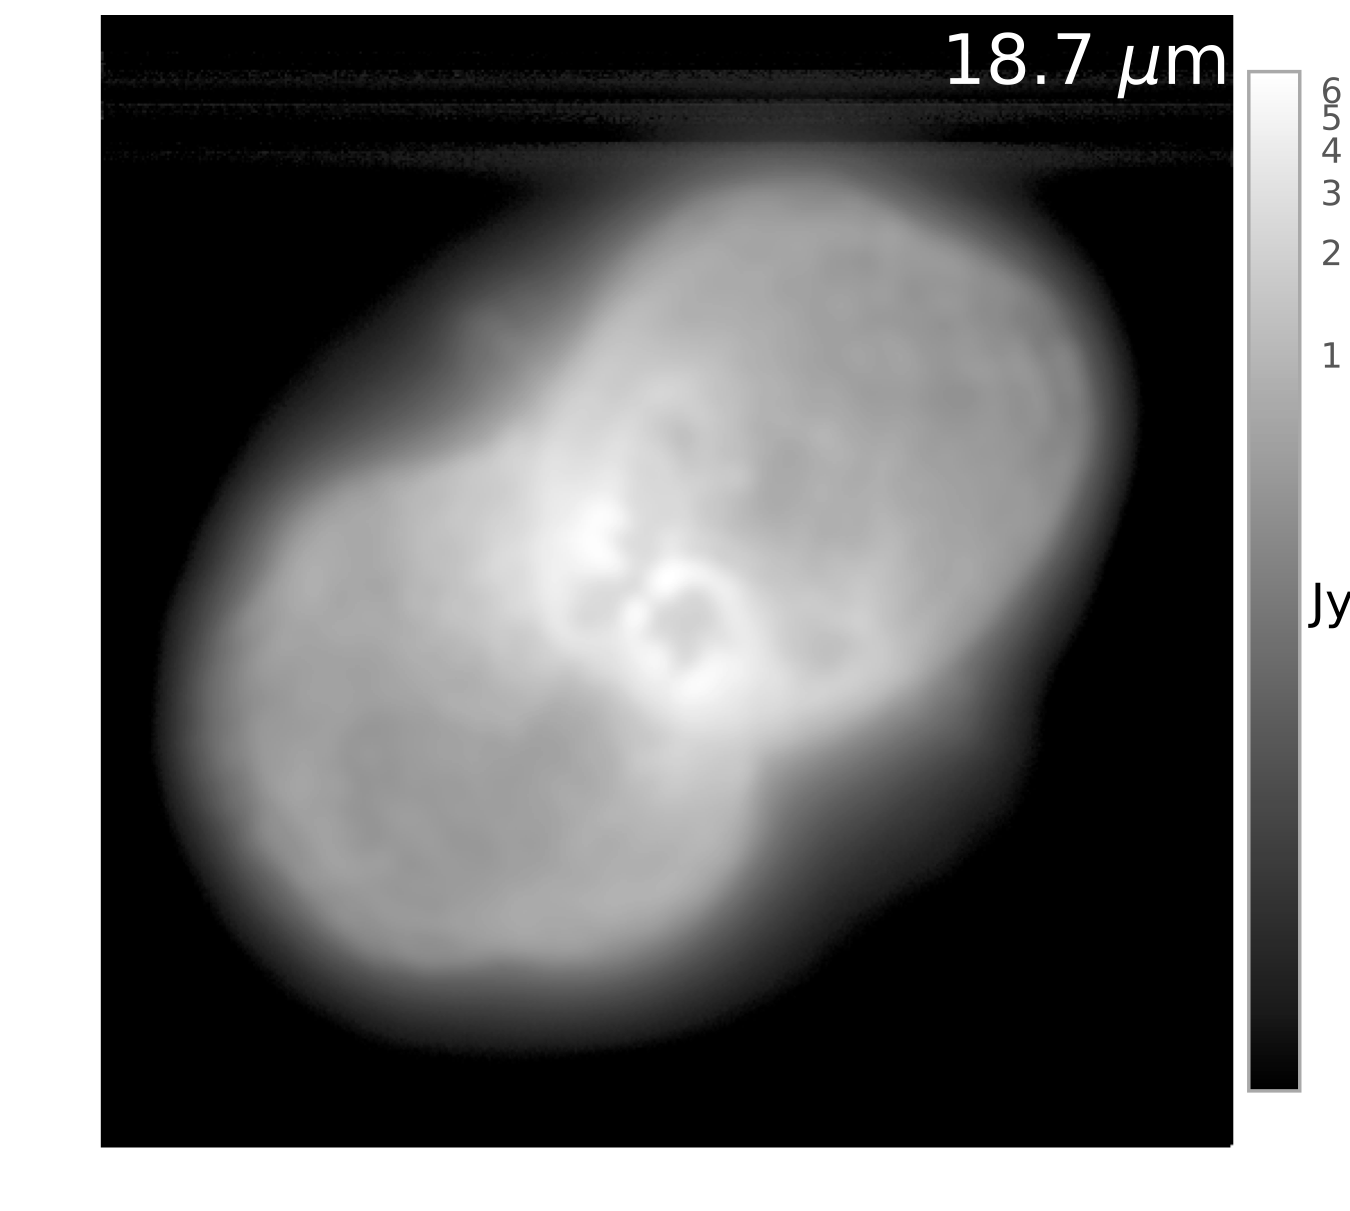
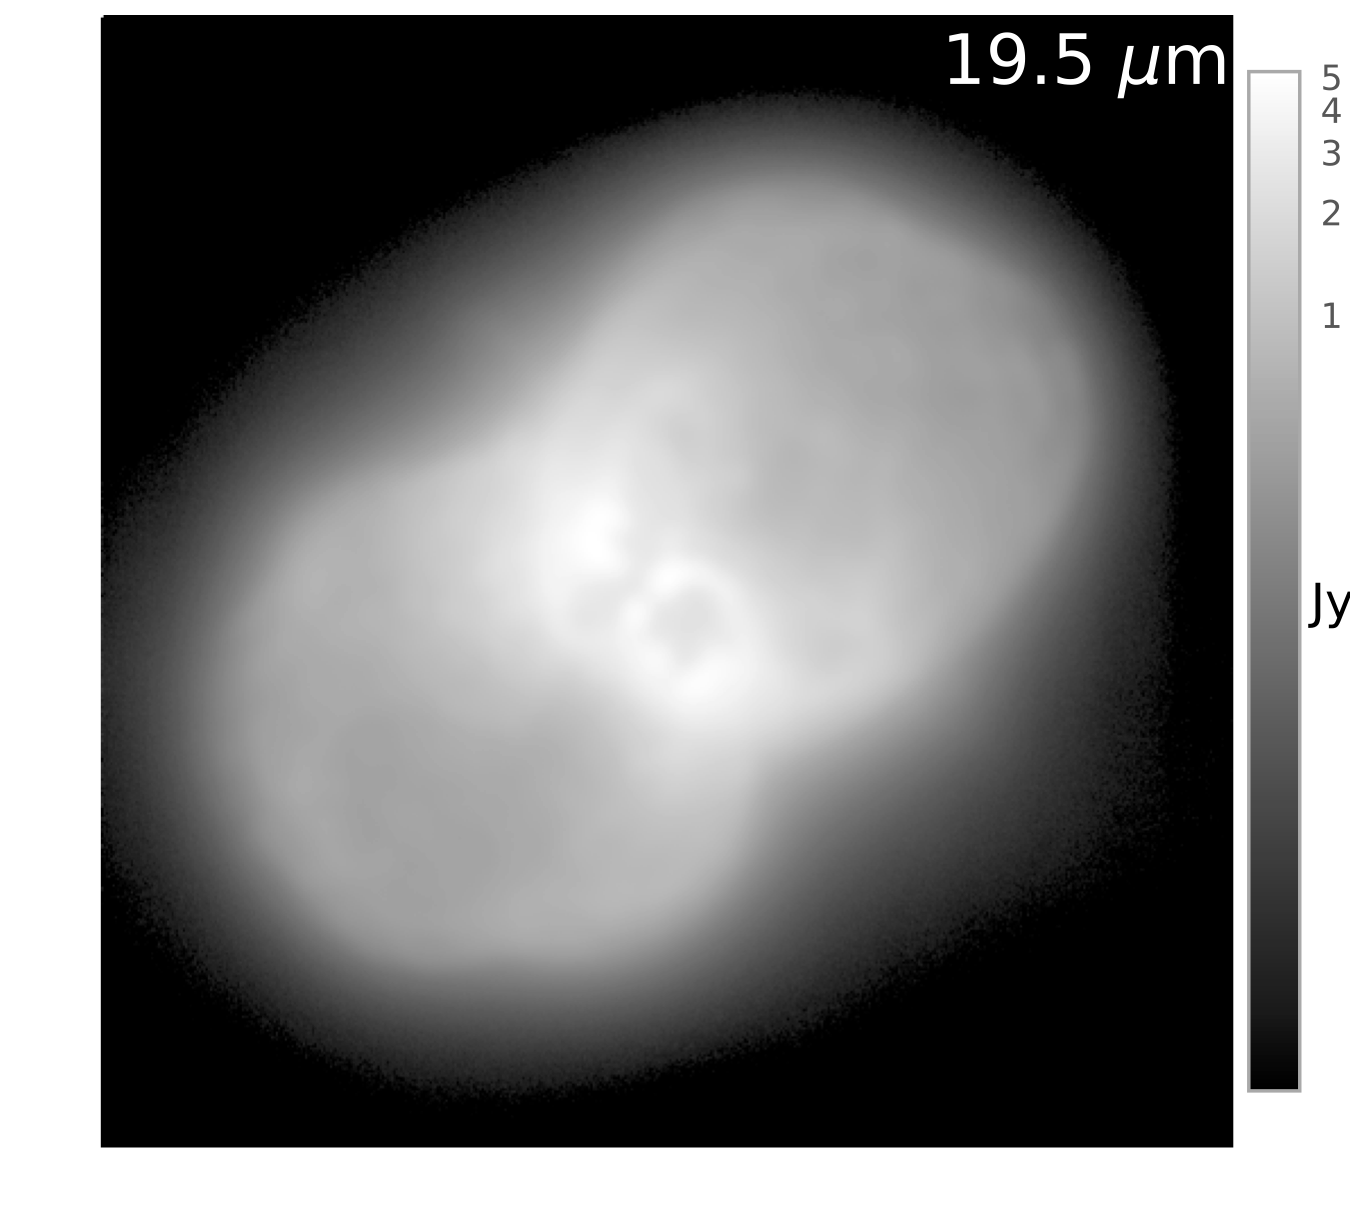
Eta Car was observed in 2018 with the upgraded VLT imager and spectrometer for the mid-IR (VISIR; Lagage et al. 2004, Käufl et al. 2015). The VISIR AQUARIUS detector provides a field of view of with a pixel scale of . We sampled the mid-IR wavelength range with several filters from m, see Table 1, Table B, and Figure 4. The observations were carried out at an airmass below 1.3 and at a precipitable water vapor between mm, ensuring good image quality. The burst read-out mode was used, which results in a large number of short exposure images with instantaneous point spread functions, corresponding to the momentary atmospheric turbulence. High spatial resolution images can be obtained by re-centering and adding the individual short-exposure images. We reach spatial resolutions close to the diffraction limits in the given filters, namely in band and in band. For the flux calibration, the science observations were either preceded or followed by a mid-IR standard star (HD89682; Cohen et al. 1999) obtained with the same setup as the science observations.
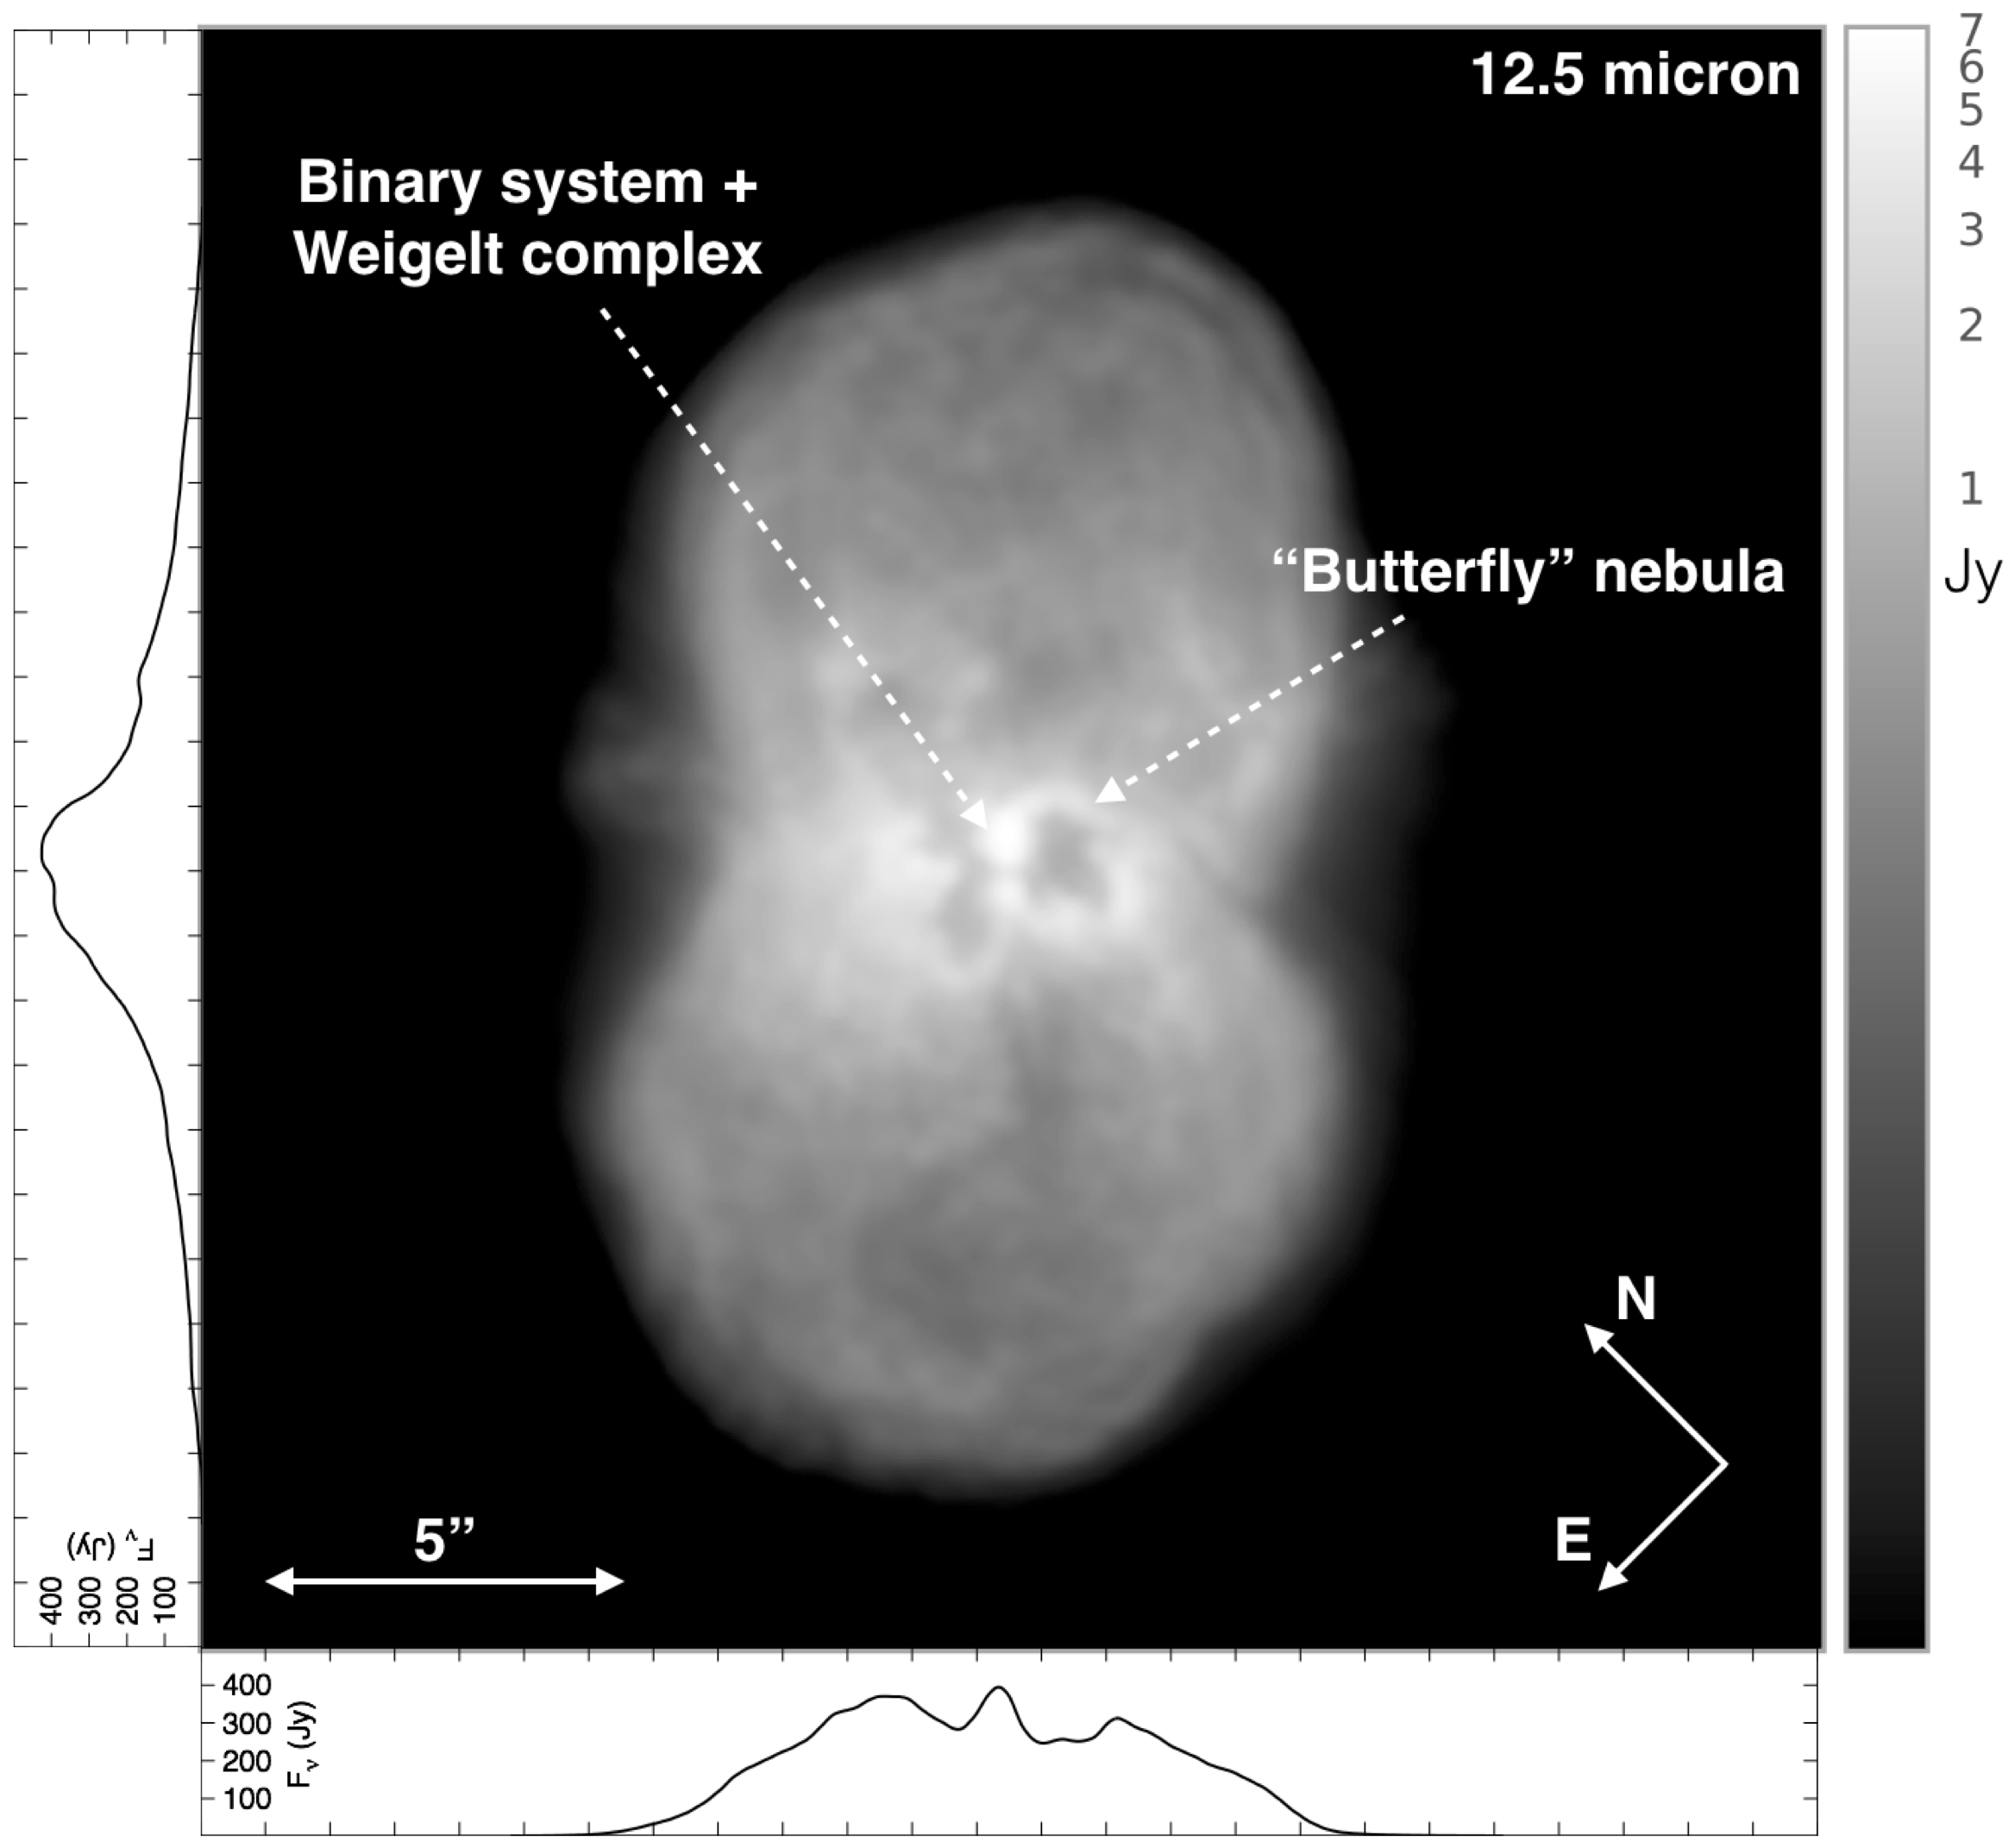
The data reduction was performed with a custom-made python pipeline. The photometry was determined using classical aperture photometry with an aperture radius of , which encompasses the entire Homunculus nebula. VISIR absolute flux calibration is accurate to 10% in the band and 20% in the band. The dominating source of uncertainty is the mid-IR sky variability. The count levels in the central bright core of the Homunculus nebula (1″ in diameter, see Figure 1) are outside the linear regime for most filters, which implies that we may be underestimating the total flux by a few percent. We do not attempt to correct for this, because longward of m less than 10% and longward of m less than 5% of the flux is produced by this central core. The resulting mid-infrared spectral flux densities and statistical uncertainties are listed in Table 1.
In what follows, we reconstruct the mid-IR SED with our 2018 observations and literature data (references are provided in the caption of Figure 2). In order to be as complete as possible, we also make use of mid-IR images in the ESO Science Archive Facility with unpublished photometry.111http://archive.eso.org Eta Car was observed with VISIR in 2005 in the filters PAH1, PAH2, NeII, and Q2 with the former Boeing detector. Standard star observations were only obtained in the filters PAH2 and NeII, see Table B. The pixel scale is 0.075″ and the images have spatial resolutions of . Detector artifacts, such as strong striping and ghosts, result in poor flux measurements. In January, March, and May 2003, Car was observed with the Thermal infrared Multi-Mode instrument (TIMMI2, Reimann et al. 2000) at the La Silla 3.6-m Telescope, see Table B. The TIMMI2 array shows smear and stripe patterns for bright sources, which lead to large errors in the flux calibration. We have averaged the flux values of all TIMMI2 observations and present the standard deviation as errors in Table 1. The TIMMI2 data should be interpreted with caution.
3 Results
3.1 Eta Car’s flux evolution in the mid-IR
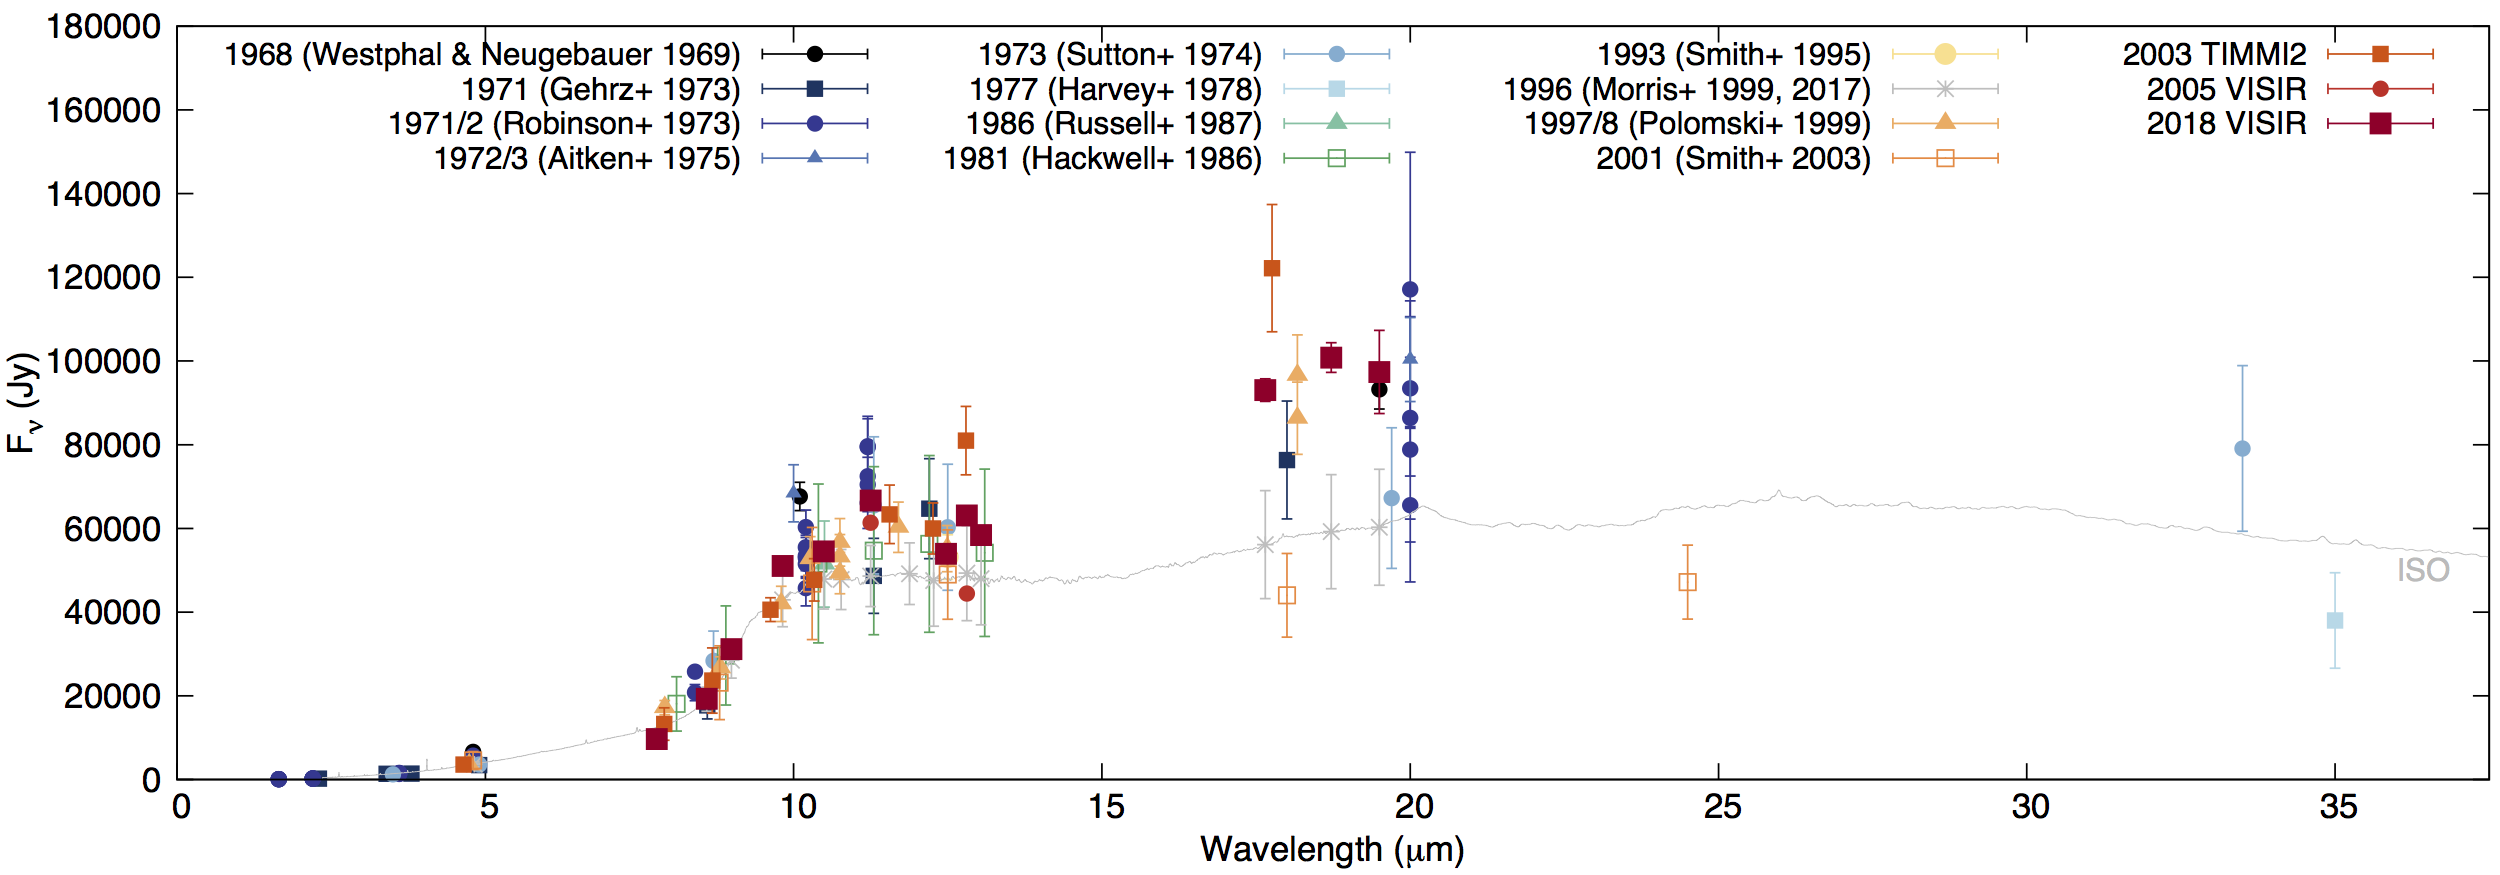
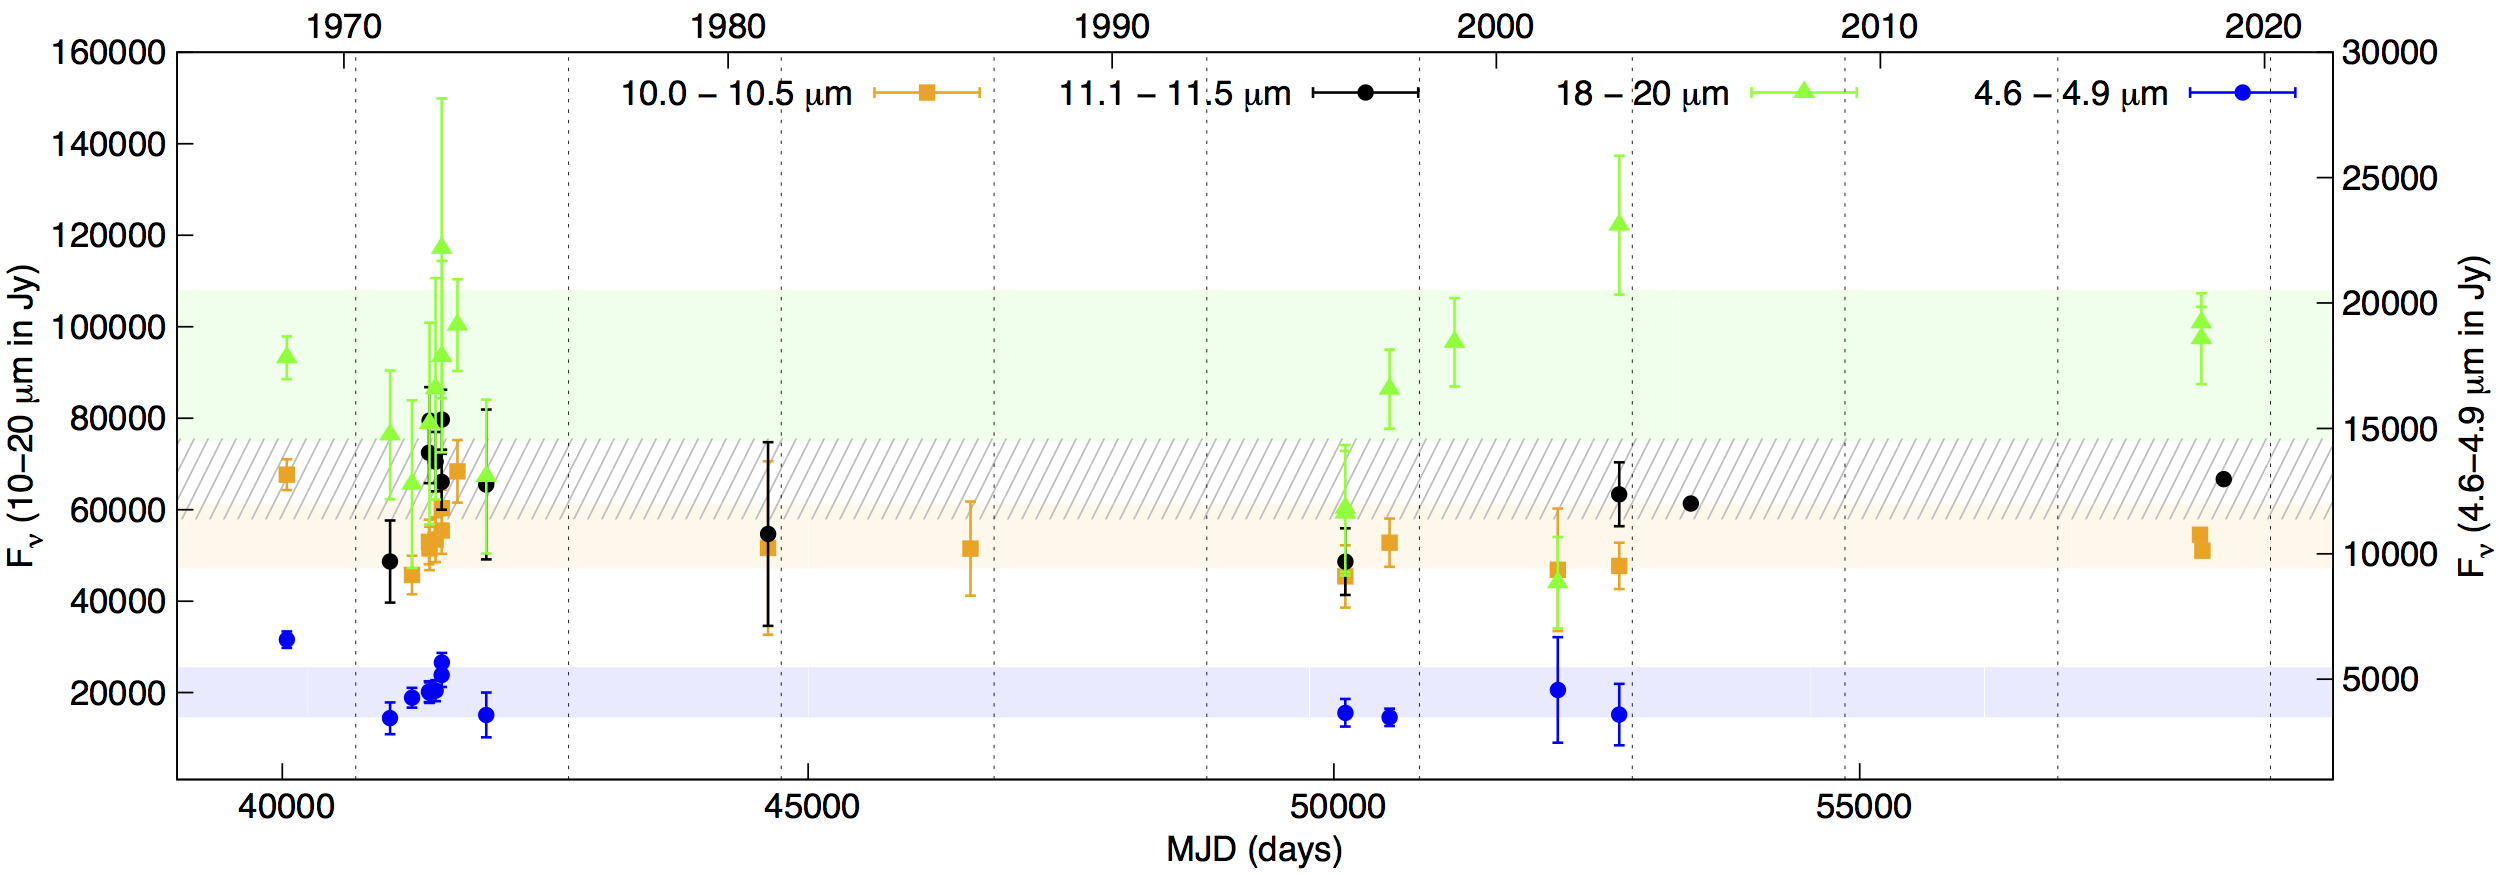
Figure 2 compares the 2018 mid-IR photometry from our VISIR images with previous observations in the period 1968–2005. Figure 3 displays the time evolution of four mid-IR wavelength regions over 50 years and their averages. With a few exceptions, individual values are consistent with each other within ( for band, for band, and for band) of the average. The figures demonstrate long-term stability of the mid-IR flux between 5 and 20 m over 50 years within the uncertainty of mid-IR flux calibration.
The timescales for the condensation and destruction of dust grains depend on the chemistry and shielding conditions, which are complex in Car’s Homunculus nebula. Ionizing UV and X-ray radiation escaping from the central binary vary with orbital phase, but we cannot confirm periodic changes in the mid-IR because the observations were obtained at a mix of orbital phases, the orbital coverage is sparse, and the calibration uncertainties are large. The observations in 1971/72 indicate a trend to higher flux values in mid-cycle, similar to what is observed in the radio (White et al. 2005), but Robinson et al. (1973) state that there is no evidence for variations from October 1971 to July 1972 larger than the measurement uncertainties. Polomski et al. (1999) find that the band and m flux density increase between March 1997 and November 1998, i.e., around periastron. The emission of the central bright core ( in diameter) contributes to less than 10% at m, 5% at m, 4% at m, and 2% at m. Any variations due to recent dust formation or destruction close to the star is hidden in the uncertainties of the nebula-encompassing photometry.
Morris et al. (2017) reported that Car’s mid-IR flux decreased by 25% over the last decades.222Morris et al. (2017) display too high values in their figure 7 for the m photometry by Gehrz et al. (1973) due to a transcription error. Gehrz et al. (1973) contains an inconsistency of a factor of about two between the flux values at m reported in their table 1 and figure 1. We use the values from their table 1. Their result was based on data obtained in 1996 with the spectrometers onboard the Infrared Space Observatory (ISO; Kessler et al. 1996). While the absolute spectro-photometric calibration of the ISO spectra was hampered by different detector materials with their own signal-dependent susceptibilities to non-linearities and memory effects (e.g., Van Malderen et al. 2004, Morris et al. 2017), the reported decline may be at least partly due to intrinsic orbital variations. A detailed color-temperature analysis with orbital phase will reveal the thermal characteristics of short-term variations, but such a study will require a more homogeneous set of spatial and temporal monitoring observations.
In contrast to Russell et al. (1987), Smith et al. (1995) and Morris et al. (2017), our SED re-construction and investigation of the time evolution does not reveal a noticeable long-term decrease in the mid-IR flux from m since the first available mid-IR photometry in the late 1960s (see Figures 2 and 3). The data support a rather stable mid-IR flux over 50 years, within the large uncertainties of ground-based mid-IR photometry and excluding variations within of the mean levels. As a consequence, the UV and optical brightening since the late 1990s does not correlate with the integrated mid-IR flux. This is an important finding as the lack of any systematic mid-IR flux change rules out large changes in Car’s luminosity. We derive a luminosity of about for Car, using the 2.3 m, 3.4 m, and 4.9 m photometry of Gehrz et al. (1973), the 2005 and 2018 VISIR mid-IR photometry, and the flux values at m by Harvey et al. (1978) and at 450 m and 850 m by Gomez et al. (2010).
3.2 On dust extinction
Ever since the 1940s, Car has brightened steadily at optical wavelengths (Frew 2004) and an accelerated brightening has been observed since the late 1990s (Davidson et al. 1999). Today, Car at UV and visual wavelengths is more than 2 mag brighter than in the 1990s and the change is remarkably gray (Davidson et al. 2018b, Damineli et al. 2019). Because Car is close to the Eddington Limit, in principle this cannot constitute an increase in bolometric luminosity. Davidson et al. (1999; 2005) and Martin et al. (2006) attribute this brightening to a rapid decrease of the circumstellar extinction. The material around Car is not spherically distributed. The central region is seen through a dust condensation, which strongly attenuates the central source (Hillier & Allen 1992, Weigelt et al. 1995). Davidson et al. (1999) argue that movement of a dusty condensation that intercepts our line-of-sight is unlikely, leaving dust destruction or a decrease of the dust formation rate close to the star as possible explanations. A possible cause may also be small changes in the stellar parameters, which alter the shape of the wind-wind shock cone such that we are no longer looking through the newly formed dust. Damineli et al. (2019) propose the dissipation of a dusty clump (“coronagraph”) in our line-of-sight.
The variability in the near-IR from 1972–2013 was studied by Whitelock et al. (2004) and Mehner et al. (2014). The star shows a long-term brightening in , whereas the -band emission remains basically constant. The m flux also shows no long-term variation (Russell et al. 1987; Figure 3). Given that longward of m thermal radiation dominates the SED rather than extinction, one would expect a significant decrease in flux in the m range only in case of a net destruction of warm ( K) dust grains. Nonetheless, Figure 3 indicates a short-term increase in emission levels during mid-cycle in the 1970s and during periastron in 1998.
The extinction of the UV and optical light is probably caused predominantly by dust within the inner core. In the VISIR J7.9 filter image, the central core is resolved in at least three knots (Figure 4). In the PAH2 and NeII filters, for which we have comparison VISIR images in 2005, this core is unresolved. For an aperture of 0.5″ radius around the central bright source, we derive Jy and Jy, compared with Jy and Jy. Additional systematic errors are about 10%. There appears to be no detectable change in mid-IR flux of the inner core in the last 13 yr. This implies either an equilibrium or very weak dust formation and destruction close to the star. If the geometry of this central knot would simply expand, then the optical depth would decline, depending on grain properties (chemistry, shape, size). In this case, and if , we would expect a small effect ( 2–10% depending on wavelength and hidden in the uncertainties) in the integrated mid-IR flux since the IR emission is determined by the larger nebula. Any stochastic increase or decrease in line-of-sight dust changes the UV and optical extinction instantly, but not the IR emission as the dust particles are heated and will radiate.
3.3 Resolved dusty circumstellar structures
Several authors have suggested a disk-, ring-, or torus-like structure of in diameter around the central star, which absorbs, scatters, and re-radiates the stellar radiation in the IR (Gehrz et al. 1973, Sutton et al. 1974, Hyland et al. 1979, Warren-Smith et al. 1978, Rigaut & Gehring 1995, Smith et al. 1995, Polomski et al. 1999). Morris et al. (1999) show that most of the dust in the equatorial region is located in toroidal structures, probably created in shock-heated gas of the 19th century eruption. Some dust may also be located in an inner unresolved torus or disk and/or pinwheel-like structures created by colliding winds in the orbital plane (Weigelt et al. 2016). Smith et al. (2002) present mid-IR images from m which support the presence of a circumstellar torus or disk. Artigau et al. (2011) argue that this “Butterfly” nebula (Chesneau et al. 2005) is not a coherent physical structure or equatorial torus but spatially separate clumps and filaments ejected at different times. Radial velocity information from ALMA observations support the general picture that the loops are a pinched torus in the orbital plane, perpendicular to the Homunculus lobes (Smith et al. 2018). The direction of the pinched material matches periastron/apastron orientation (Madura et al. 2013) and the companion may have played a role in disrupting the torus soon after its ejection.
The geometry of the dust surrounding Car is quite complex, see Figure 1 (also Smith et al. 2002). In the center, two bright ring-like structures form the “Butterfly” nebula. Most of the dust is located in this central region (50% of the flux originates within a 3″ radius from the central source, 80% within a 5″ radius). In the mid-IR, one can identify strong density or temperature gradients and knots along these loops, but also spatially coherent structures.
Comparison between the 2005 and 2018 VISIR images show that the two prominent loops are expanding at a rate of up to yr-1 projected on sky. This corresponds to projected velocities of km s-1 at a distance of 2.3 kpc, consistent with velocities in the equatorial plane (Davidson et al. 2001). The rings seem to expand without losing their overall appearance, in support of physically coherent structures. The furthest extent of the “Butterfly” nebula is about 2″ from the central source, which points toward an ejection during or in the decades before the 19th century eruption. We do not find any brightness changes of the inner loop-like structures between observations separated by 13 years. For an aperture of 3″ radius, we derive Jy and Jy, compared with Jy and Jy. The response time for the dust formation or destruction at these distances from the star is not clear. However, the constant flux and overall appearance of these loops may imply that there is no recent dust formation or destruction and the material is simply expanding, as these structures are likely optically thin.
Clues to the history and origin of Car’s mass ejection phases can be found in its circumstellar material. Hydrodynamical simulations show that a spherical mass ejection into a massive pre-existing torus of gas and dust could result in the present-day bi-polar geometry of the Homunculus nebula (Frank et al. 1995, Dwarkadas & Balick 1998). The massive torus may have been created shortly before the 19th century eruption, e.g., through non-conservative mass transfer, leaving an unstable core that then erupted.
4 Conclusions
The mid-IR flux densities of Car’s Homunculus nebula from m show no long-term decline since the first available mid-IR photometry in 1968. Eta Car’s luminosity has thus probably been stable over the last five decades (, adopting a distance of 2.3 kpc). Mid-IR observations were obtained irregularly and at different orbital phases. The large uncertainties of the mid-IR photometry (10% in band and 20% in band) prohibits the confirmation of smaller short-term fluctuations or variations with the orbital period.
Contrary to previous publications, we find no long-term decline of mid-IR photometric levels, which would have indicated a reduction in circumstellar extinction and could have explained the increase in UV and optical brightness. The most likely scenario to explain Car’s brightening at UV and optical wavelengths, and its stability in the mid-IR, is that the extinction caused by circumstellar dust is declining in our line-of-sight only.
Acknowledgements.
We thank the anonymous referee for the constructive feedback. MJB acknowledges support from ERC grant SNDUST 694520. We have used SketchAndCalc to calculate the areas in isophotal contour maps (E. M. Dobbs; www.SketchAndCalc.com).References
- Aitken & Jones (1975) Aitken, D. K. & Jones, B. 1975, MNRAS, 172, 141
- Artigau et al. (2011) Artigau, É., Martin, J. C., Humphreys, R. M., et al. 2011, AJ, 141, 202
- Chesneau et al. (2005) Chesneau, O., Min, M., Herbst, T., et al. 2005, A&A, 435, 1043
- Cohen et al. (1999) Cohen, M., Walker, R. G., Carter, B., et al. 1999, AJ, 117, 1864
- Conti (1984) Conti, P. S. 1984, in IAU Symposium, Vol. 105, Observational Tests of the Stellar Evolution Theory, ed. A. Maeder & A. Renzini, 233
- Conti (1997) Conti, P. S. 1997, in PASPC, Vol. 120, Luminous Blue Variables: Massive Stars in Transition, ed. A. Nota & H. Lamers, 387
- Cox et al. (1995) Cox, P., Mezger, P. G., Sievers, A., et al. 1995, A&A, 297, 168
- Damineli et al. (1997) Damineli, A., Conti, P. S., & Lopes, D. F. 1997, New Astronomy, 2, 107
- Damineli et al. (2019) Damineli, A., Fernández-Lajús, E., Almeida, L. A., et al. 2019, MNRAS, 484, 1325
- Davidson (1971) Davidson, K. 1971, MNRAS, 154, 415
- Davidson et al. (1999) Davidson, K., Gull, T. R., Humphreys, R. M., et al. 1999, AJ, 118, 1777
- Davidson et al. (2018a) Davidson, K., Helmel, G., & Humphreys, R. M. 2018a, RNAAS, 2, 133
- Davidson & Humphreys (1997) Davidson, K. & Humphreys, R. M. 1997, ARA&A, 35, 1
- Davidson & Humphreys (2012) Davidson, K. & Humphreys, R. M., eds. 2012, ASSL, Vol. 384, Eta Carinae and the Supernova Impostors
- Davidson et al. (2018b) Davidson, K., Ishibashi, K., Martin, J. C., & Humphreys, R. M. 2018b, ApJ, 858, 109
- Davidson et al. (2005) Davidson, K., Martin, J., Humphreys, R. M., et al. 2005, AJ, 129, 900
- Davidson & Ostriker (1972) Davidson, K. & Ostriker, J. P. 1972, Nature Physical Science, 236, 46
- Davidson et al. (2001) Davidson, K., Smith, N., Gull, T. R., Ishibashi, K., & Hillier, D. J. 2001, AJ, 121, 1569
- Dwarkadas & Balick (1998) Dwarkadas, V. V. & Balick, B. 1998, AJ, 116, 829
- Frank et al. (1995) Frank, A., Balick, B., & Davidson, K. 1995, ApJ, 441, L77
- Frew (2004) Frew, D. J. 2004, Journal of Astronomical Data, 10
- Gal-Yam & Leonard (2009) Gal-Yam, A. & Leonard, D. C. 2009, Nature, 458, 865
- Gehrz et al. (1973) Gehrz, R. D., Ney, E. P., Becklin, E. E., & Neugebauer, G. 1973, Astrophys. Lett., 13, 89
- Gomez et al. (2010) Gomez, H. L., Vlahakis, C., Stretch, C. M., et al. 2010, MNRAS, 401, L48
- Groh et al. (2013) Groh, J. H., Meynet, G., & Ekström, S. 2013, A&A, 550, L7
- Hackwell et al. (1986) Hackwell, J. A., Gehrz, R. D., & Grasdalen, G. L. 1986, ApJ, 311, 380
- Harvey et al. (1978) Harvey, P. M., Hoffmann, W. F., & Campbell, M. F. 1978, A&A, 70, 165
- Hillier & Allen (1992) Hillier, D. J. & Allen, D. A. 1992, A&A, 262, 153
- Humphreys & Davidson (1994) Humphreys, R. M. & Davidson, K. 1994, PASP, 106, 1025
- Hyland et al. (1979) Hyland, A. R., Robinson, G., Mitchell, R. M., Thomas, J. A., & Becklin, E. E. 1979, ApJ, 233, 145
- Käufl et al. (2015) Käufl, H. U., Kerber, F., Asmus, D., et al. 2015, The Messenger, 159, 15
- Kessler et al. (1996) Kessler, M. F., Steinz, J. A., Anderegg, M. E., et al. 1996, A&A, 315, L27
- Kotak & Vink (2006) Kotak, R. & Vink, J. S. 2006, A&A, 460, L5
- Lagage et al. (2004) Lagage, P. O., Pel, J. W., Authier, M., et al. 2004, The Messenger, 117, 12
- Langer et al. (1994) Langer, N., Hamann, W.-R., Lennon, M., et al. 1994, A&A, 290, 819
- Madura et al. (2013) Madura, T. I., Gull, T. R., Okazaki, A. T., et al. 2013, MNRAS, 436, 3820
- Maeder (1983) Maeder, A. 1983, A&A, 120, 113
- Martin et al. (2006) Martin, J. C., Davidson, K., & Koppelman, M. D. 2006, AJ, 132, 2717
- Mehner et al. (2010) Mehner, A., Davidson, K., Ferland, G. J., & Humphreys, R. M. 2010, ApJ, 710, 729
- Mehner et al. (2014) Mehner, A., Ishibashi, K., Whitelock, P., et al. 2014, A&A, 564, A14
- Morris et al. (2017) Morris, P. W., Gull, T. R., Hillier, D. J., et al. 2017, ApJ, 842, 79
- Morris et al. (1999) Morris, P. W., Waters, L. B. F. M., Barlow, M. J., et al. 1999, Nature, 402, 502
- Neugebauer & Westphal (1968) Neugebauer, G. & Westphal, J. A. 1968, ApJ, 152, L89
- Nota & Lamers (1997) Nota, A. & Lamers, H., eds. 1997, ASPC, Vol. 120, Luminous Blue Variables: Massive Stars in Transition
- Pagel (1969) Pagel, B. E. T. 1969, Astrophys. Lett., 4, 221
- Polomski et al. (1999) Polomski, E. F., Telesco, C. M., Piña, R. K., & Fisher, R. S. 1999, AJ, 118, 2369
- Reimann et al. (2000) Reimann, H.-G., Linz, H., Wagner, R., et al. 2000, in Proc. SPIE, Vol. 4008, Optical and IR Telescope Instrumentation and Detectors, ed. M. Iye & A. F. Moorwood, 1132–1143
- Rigaut & Gehring (1995) Rigaut, F. & Gehring, G. 1995, in RMxAA, vol. 27, Vol. 2, RMxAA Conf. Ser., ed. V. Niemela, N. Morrell, & A. Feinstein, 27–35
- Robinson et al. (1973) Robinson, G., Hyland, A. R., & Thomas, J. A. 1973, MNRAS, 161, 281
- Russell et al. (1987) Russell, R. W., Lynch, D. K., Hackwell, J. A., et al. 1987, ApJ, 321, 937
- Smith et al. (1995) Smith, C. H., Aitken, D. K., Moore, T. J. T., et al. 1995, MNRAS, 273, 354
- Smith et al. (2003) Smith, N., Gehrz, R. D., Hinz, P. M., et al. 2003, AJ, 125, 1458
- Smith et al. (2002) Smith, N., Gehrz, R. D., Hinz, P. M., et al. 2002, ApJ, 567, L77
- Smith et al. (2018) Smith, N., Ginsburg, A., & Bally, J. 2018, MNRAS, 474, 4988
- Smith et al. (2007) Smith, N., Li, W., Foley, R. J., et al. 2007, ApJ, 666, 1116
- Sutton et al. (1974) Sutton, E., Becklin, E. E., & Neugebauer, G. 1974, ApJ, 190, L69
- Trundle et al. (2008) Trundle, C., Kotak, R., Vink, J. S., & Meikle, W. P. S. 2008, A&A, 483, L47
- Van Malderen et al. (2004) Van Malderen, R., Decin, L., Kester, D., et al. 2004, A&A, 414, 677
- Warren-Smith et al. (1978) Warren-Smith, R. F., Scarrot, S. M., Murdin, P., & Bingham, R. G. 1978, Memorie della Societa Astronomica Italiana, 49, 589
- Weigelt et al. (1995) Weigelt, G., Albrecht, R., Barbieri, C., et al. 1995, in RMxAA, vol. 27, Vol. 2, RMxAA Conf. Ser., ed. V. Niemela, N. Morrell, & A. Feinstein, 11
- Weigelt & Ebersberger (1986) Weigelt, G. & Ebersberger, J. 1986, A&A, 163, L5
- Weigelt et al. (2016) Weigelt, G., Hofmann, K.-H., Schertl, D., et al. 2016, A&A, 594, A106
- Westphal & Neugebauer (1969) Westphal, J. A. & Neugebauer, G. 1969, ApJ, 156, L45
- White et al. (2005) White, S. M., Duncan, R. A., Chapman, J. M., & Koribalski, B. 2005, in ASP Conf. Ser., Vol. 332, The Fate of the Most Massive Stars, ed. R. Humphreys & K. Stanek, 129
- Whitelock et al. (2004) Whitelock, P. A., Feast, M. W., Marang, F., & Breedt, E. 2004, MNRAS, 352, 447
Appendix A Mid-IR images with VISIR in 2018
![[Uncaptioned image]](/html/1908.09154/assets/etaCar_IMG_J7_2018_fastgauss_meanall_Jy.png)
![[Uncaptioned image]](/html/1908.09154/assets/etaCar_IMG_PAH1_2018_fastgauss_meanall_Jy.png)
![[Uncaptioned image]](/html/1908.09154/assets/etaCar_IMG_ARIII_2018_fastgauss_meanall_Jy.png)
![[Uncaptioned image]](/html/1908.09154/assets/etaCar_IMG_SIV_1_2018_fastgauss_meanall_Jy.png)
![[Uncaptioned image]](/html/1908.09154/assets/etaCar_IMG_SIV_2018_fastgauss_meanall_Jy.png)
![[Uncaptioned image]](/html/1908.09154/assets/etaCar_IMG_PAH2_2018_fastgauss_meanall_Jy.png)
![[Uncaptioned image]](/html/1908.09154/assets/etaCar_IMG_B12_2018_fastgauss_meanall_Jy.png)
![[Uncaptioned image]](/html/1908.09154/assets/etaCar_IMG_NEII_2018_fastgauss_meanall_Jy.png)
![[Uncaptioned image]](/html/1908.09154/assets/etaCar_IMG_NEII_2_2018_fastgauss_meanall_Jy.png)
Appendix B Journal of VISIR and TIMMI2 observations
[x]lcccccc
Journal of VISIR observations.
Date MJD Target Filter Wavelength Image quality ESO PROG.ID
(m) (″)
\endfirstheadDate MJD Target Filter Wavelength Image quality ESO PROG.ID
(m) (″)
\endhead2005-01-23 53393.05 HD9138 PAH2 11.25 0.39 074.A-9016(A); PI: Lagage
2005-01-23 53393.10 HD59294 PAH2 11.25 0.36 074.A-9016(A)
2005-01-23 53393.18 HD30080 NEII 12.81 0.38 074.A-9016(A)
2005-01-23 53393.25 HD62902 NEII 12.81 0.38 074.A-9016(A)
2005-01-23 53393.37 eta Car NEII 12.81 0.38 074.A-9016(A)
2005-01-23 53393.37 eta Car PAH2 11.25 0.37 074.A-9016(A)
2018-04-28 58237.00 eta Car PAH1 8.59 0.23 0101.D-0077(A); PI: Mehner
2018-04-29 58237.00 eta Car SIV 10.49 0.27 0101.D-0077(A)
2018-04-29 58237.00 eta Car B12.4 12.47 0.31 0101.D-0077(A)
2018-04-29 58237.01 HD89682 PAH1 8.59 0.23 0101.D-0077(A)
2018-04-29 58237.02 HD89682 SIV 10.49 0.27 0101.D-0077(A)
2018-04-29 58237.02 HD89682 B12.4 12.47 0.31 0101.D-0077(A)
2018-05-11 58249.10 eta Car Q1 17.65 0.50 0101.D-0077(A)
2018-05-11 58249.11 eta Car Q2 18.72 0.50 0101.D-0077(A)
2018-05-11 58249.12 eta Car Q3 19.50 0.50 0101.D-0077(A)
2018-05-11 58249.13 HD89682 Q1 17.65 0.50 0101.D-0077(A)
2018-05-11 58249.13 HD89682 Q2 18.72 0.50 0101.D-0077(A)
2018-05-11 58249.14 HD89682 Q3 19.50 0.50 0101.D-0077(A)
2018-05-21 58259.97 eta Car J7.9 7.78 0.22 0101.D-0077(A)
2018-05-21 58259.98 eta Car SIV_1 9.82 0.31 0101.D-0077(A)
2018-05-21 58259.99 HD89682 J7.9 7.78 0.22 0101.D-0077(A)
2018-05-21 58260.00 HD89682 SIV_1 9.82 0.31 0101.D-0077(A)
2018-12-10 58462.31 eta Car ARIII 8.99 0.26 0101.D-0077(A)
2018-12-10 58462.31 eta Car PAH2 11.25 0.29 0101.D-0077(A)
2018-12-10 58462.32 eta Car NEII 12.81 0.33 0101.D-0077(A)
2018-12-10 58462.32 eta Car NEII_2 13.04 0.33 0101.D-0077(A)
2018-12-10 58462.33 HD89682 ARIII 8.99 0.26 0101.D-0077(A)
2018-12-10 58462.34 HD89682 PAH2 11.25 0.29 0101.D-0077(A)
2018-12-10 58462.34 HD89682 NEII 12.81 0.33 0101.D-0077(A)
2018-12-10 58462.35 HD89682 NEII_2 13.04 0.33 0101.D-0077(A)
[x]lccccc
Journal of TIMMI2 observations.
Date MJD Target Filter Wavelength ESO PROG.ID
(m)
\endfirstheadDate MJD Target Filter Wavelength ESO PROG.ID
(m)
\endhead2003-01-26 52665.26 HD81797 N10.4 10.3 60.A-9126(C); Engineering run
2003-01-26 52665.26 HD81797 N11.9 11.6 60.A-9126(C)
2003-01-26 52665.26 HD81797 N10.4 10.3 60.A-9126(C)
2003-01-26 52665.27 HD81797 N11.9 11.6 60.A-9126(C)
2003-01-26 52665.27 HD81797 Q1 17.8 60.A-9126(C)
2003-01-26 52665.29 eta Car N7.9 7.9 60.A-9126(C)
2003-01-26 52665.30 eta Car N8.9 8.7 60.A-9126(C)
2003-01-26 52665.30 eta Car N10.4 10.3 60.A-9126(C)
2003-01-26 52665.3 eta Car N11.9 11.6 60.A-9126(C)
2003-01-26 52665.31 eta Car N12.9 12.3 60.A-9126(C)
2003-01-26 52665.32 eta Car [NeII] 12.8 60.A-9126(C)
2003-01-26 52665.32 eta Car Q1 17.8 60.A-9126(C)
2003-01-26 52665.33 eta Car N9.8 9.6 60.A-9126(C)
2003-01-26 52665.33 eta Car N9.8 9.6 60.A-9126(C)
2003-01-26 52665.34 HD81797 N7.9 7.9 60.A-9126(C)
2003-01-26 52665.35 HD81797 N8.9 8.7 60.A-9126(C)
2003-01-26 52665.35 HD81797 N9.8 9.6 60.A-9126(C)
2003-01-26 52665.35 HD81797 N10.4 10.3 60.A-9126(C)
2003-01-26 52665.35 HD81797 N11.9 11.6 60.A-9126(C)
2003-01-26 52665.35 HD81797 N12.9 12.3 60.A-9126(C)
2003-01-26 52665.36 HD81797 [NeII] 12.8 60.A-9126(C)
2003-01-26 52665.36 HD81797 Q1 17.8 60.A-9126(C)
2003-03-19 52717.45 HD156277 N10.4 10.3 60.A-9126(E); Engineering run
2003-03-19 52717.45 HD156277 [NeII] 12.8 60.A-9126(E)
2003-05-14 52773.07 HD123139 N10.4 10.3 60.A-9126(A); Engineering run
2003-05-14 52773.07 HD123139 N9.8 9.6 60.A-9126(A)
2003-05-14 52773.08 HD123139 N8.9 8.7 60.A-9126(A)
2003-05-14 52773.08 HD123139 N7.9 7.9 60.A-9126(A)
2003-05-14 52773.08 HD123139 N12.9 12.3 60.A-9126(A)
2003-05-14 52773.09 HD123139 [NeII] 12.8 60.A-9126(A)
2003-05-14 52773.10 HD123139 M 4.6 60.A-9126(A)
2003-05-14 52773.12 eta Car N7.9 7.9 60.A-9126(I); Engineering run
2003-05-14 52773.12 eta Car N7.9 7.9 60.A-9126(I)
2003-05-14 52773.12 eta Car N8.9 8.7 60.A-9126(I)
2003-05-14 52773.13 eta Car N10.4 10.3 60.A-9126(I)
2003-05-14 52773.13 eta Car N12.9 12.3 60.A-9126(I)
2003-05-14 52773.13 eta Car [NeII] 12.8 60.A-9126(I)
2003-05-14 52773.14 eta Car M 4.6 60.A-9126(I)
2003-05-14 52773.14 eta Car N7.9 7.9 60.A-9126(I)
2003-05-14 52773.15 eta Car N8.9 8.7 60.A-9126(I)
2003-05-14 52773.15 eta Car N7.9 7.9 60.A-9126(I)
2003-05-14 52773.15 eta Car N8.9 8.7 60.A-9126(I)
2003-05-14 52773.15 eta Car N9.8 9.6 60.A-9126(I)
2003-05-14 52773.15 eta Car N10.4 10.3 60.A-9126(I)
2003-05-14 52773.16 eta Car N12.9 12.3 60.A-9126(I)
2003-05-14 52773.16 eta Car [NeII] 12.8 60.A-9126(I)
2003-05-14 52773.16 eta Car M 4.6 60.A-9126(I)
2003-05-14 52773.96 HD108903 N7.9 7.9 69.D-0304(B); PI: Gehrz
2003-05-14 52773.97 HD108903 N8.9 8.7 69.D-0304(B)
2003-05-14 52773.97 HD108903 N9.8 9.6 69.D-0304(B)
2003-05-14 52773.97 HD108903 N10.4 10.3 69.D-0304(B)
2003-05-14 52773.97 HD108903 N11.9 11.6 69.D-0304(B)
2003-05-14 52773.97 HD108903 Q1 17.8 69.D-0304(B)
2003-05-14 52773.98 HD108903 M 4.6 69.D-0304(B)
2003-05-14 52773.98 eta Car N7.9 7.9 69.D-0304(B)
2003-05-14 52773.98 eta Car N8.9 8.7 69.D-0304(B)
2003-05-14 52773.99 eta Car N9.8 9.6 69.D-0304(B)
2003-05-14 52773.99 eta Car N10.4 10.3 69.D-0304(B)
2003-05-14 52773.99 eta Car N11.9 11.6 69.D-0304(B)
2003-05-14 52773.99 eta Car N11.9 11.6 69.D-0304(B)
2003-05-14 52774.00 eta Car N11.9 11.6 69.D-0304(B)
2003-05-15 52774.00 eta Car Q1 17.8 69.D-0304(B)
2003-05-15 52774.01 eta Car M 4.6 69.D-0304(B)
2003-05-15 52774.01 eta Car N8.9 8.7 69.D-0304(B)
2003-05-15 52774.01 eta Car N11.9 11.6 69.D-0304(B)
2003-05-15 52774.02 eta Car Q1 17.8 69.D-0304(B)
2003-05-15 52774.94 HD108903 N8.9 8.7 69.D-0304(B)
2003-05-15 52774.94 HD108903 N11.9 11.6 69.D-0304(B)
2003-05-15 52774.95 HD108903 Q1 17.8 69.D-0304(B)
2003-05-15 52774.95 HD108903 M 4.6 69.D-0304(B)
2003-05-15 52774.99 eta Car N7.9 7.9 69.D-0304(B)
2003-05-15 52774.99 eta Car N8.9 8.7 69.D-0304(B)
2003-05-15 52775.00 eta Car N9.8 9.6 69.D-0304(B)
2003-05-15 52775.00 eta Car N10.4 10.3 69.D-0304(B)
2003-05-15 52775.00 eta Car N11.9 11.6 69.D-0304(B)
2003-05-16 52775.00 eta Car N12.9 12.3 69.D-0304(B)
2003-05-16 52775.00 eta Car [NeII] 12.8 69.D-0304(B)
2003-05-16 52775.01 eta Car Q1 17.8 69.D-0304(B)
2003-05-16 52775.01 eta Car M 4.6 69.D-0304(B)
2003-05-16 52775.02 HD108903 N7.9 7.9 69.D-0304(B)
2003-05-16 52775.02 HD108903 N8.9 8.7 69.D-0304(B)
2003-05-16 52775.02 HD108903 N9.8 9.6 69.D-0304(B)
2003-05-16 52775.02 HD108903 N10.4 10.3 69.D-0304(B)
2003-05-16 52775.02 HD108903 N11.9 11.6 69.D-0304(B)
2003-05-16 52775.02 HD108903 N12.9 12.3 69.D-0304(B)
2003-05-16 52775.02 HD108903 [NeII] 12.8 69.D-0304(B)
2003-05-16 52775.03 HD108903 Q1 17.8 69.D-0304(B)
2003-05-16 52775.03 HD108903 M 4.6 69.D-0304(B)
2003-05-27 52786.94 HD110458 N7.9 7.9 71.D-0049(A); PI: Zijlstra
2003-05-27 52786.94 HD110458 N11.9 11.6 71.D-0049(A)
2003-05-27 52786.95 HD110458 N12.9 12.3 71.D-0049(A)
2003-05-27 52786.96 eta Car N7.9 7.9 71.D-0049(A)
2003-05-27 52786.97 eta Car N11.9 11.6 71.D-0049(A)
2003-05-27 52786.97 eta Car N12.9 12.3 71.D-0049(A)