No evidence for critical slowing down prior to human epileptic seizures
Abstract
There is a ongoing debate whether generic early warning signals for critical transitions exist that can be applied across diverse systems. The human epileptic brain is often considered as a prototypical system, given the devastating and, at times, even life-threatening nature of the extreme event epileptic seizure. More than three decades of international effort has successfully identified predictors of imminent seizures. However, the suitability of typically applied early warning indicators for critical slowing down, namely variance and lag-1 autocorrelation, for indexing seizure susceptibility is still controversially discussed. Here, we investigated long-term, multichannel recordings of brain dynamics from 28 subjects with epilepsy. Using a surrogate-based evaluation procedure of sensitivity and specificity of time-resolved estimates of early warning indicators, we found no evidence for critical slowing down prior to 105 epileptic seizures.
A tipping point in a complex system is a threshold that, when exceeded, can lead to large and devastating changes in the state of the system. If the system is getting closer to a tipping point, the restoration to its normal state after some perturbation takes increasingly longer and is associated with an increase in the size of fluctuations. Both these aspects have been proposed as early warning signals of tipping, usually referred to as critical slowing down. Epileptic seizures have repeatedly been claimed as a potential field of application on constructing early warning signals through identifying characteristics of critical slowing down on the basis of electroencephalographic time series. We investigate whether there is evidence for critical slowing down prior to seizures by investigating long-lasting, multichannel electroencephalographic recordings from 28 subjects with epilepsy. Applying state-of-the-art statistical approaches that involve specifically designed surrogate tests, we do not find evidence for critical slowing down prior to more than 100 epileptic seizures.
I Introduction
The phenomenon of a stable equilibrium losing its stability as a slowly varying control parameter or some external forcing passes some critical value (tipping point) is referred to as a critical transition Afrajmovich et al. (1994); Thompson, Stewart, and Ueda (1994); Dakos et al. (2008); Scheffer et al. (2009); Kuehn (2011); Lenton et al. (2012); Sieber and Thompson (2012); Scheffer et al. (2012); Dai et al. (2012); Feudel, Pisarchik, and Showalter (2018); Kaszás, Feudel, and Tél (2019). A critical transition can be heralded by the phenomenon of critical slowing down (CSD), an increasingly slow recovery from small perturbations. In order to test whether a system undergoes CSD, one would ideally investigate its response to such small perturbations, although such an approach may not be feasible in general. An alternatively, data-driven approach consists of interpreting fluctuations in the state of a system as its responds to perturbations Dakos et al. (2008); Scheffer et al. (2009, 2012); Dai et al. (2012); Dakos et al. (2012); Lenton et al. (2012). With approaching the tipping point, the time needed for a system to recover from perturbations becomes longer and hence its dynamics becomes more correlated with its past, leading to an increase in the lag-1 autocorrelation estimated from time series of appropriate system observables. In addition, since perturbations accumulate – following Kubo’s fluctuation-dissipation theorem Kubo (1966) – one observes an increase in the size of the fluctuations (variance, or other higher-order statistical indicators) in such time series. These as well as other indicators for CSD (e.g., derived from Fourier-transformed time series of system observables Scheffer et al. (2012)) are related to each other via Wiener-Khinchin’s theorem and Parseval’s (or Plancherel’s) theorem. Although indicators were claimed to be generic early warning signals, they have been critically discussed from various perspectives Ditlevsen and Johnsen (2010); Boettiger and Hastings (2012); Boettiger, Ross, and Hastings (2013); Boettiger and Hastings (2013); Guttal, Jayaprakash, and Tabbaa (2013); Dakos et al. (2015); Dai, Korolev, and Gore (2015); Diks, Hommes, and Wang (2015); Wagner and Eisenman (2015); Zhang, Kuehn, and Hallerberg (2015); Milanowski and Suffczynski (2016); Qin and Tang (2018); O’Regan and Burton (2018); Romano and Kuehn (2018); Wen, Ciamarra, and Cheong (2018); Clements, McCarthy, and Blanchard (2019); Jäger and Füllsack (2019).
The human brain is among the many natural systems in which CSD has been repeatedly claimed to provide early warning signals for a variety of particularly pathophysiologic conditions Scheffer et al. (2009); Kramer et al. (2012); Meisel and Kuehn (2012); van de Leemput et al. (2014); Meisel et al. (2015); Bayani et al. (2017); Scheffer et al. (2018), most notably transitions into and out of epileptic seizures Scheffer et al. (2009); Kramer et al. (2012); Meisel and Kuehn (2012); Freestone, Karoly, and Cook (2017); Nazarimehr, Golpayegani, and Hatef (2018). Previous studies Mormann et al. (2005); Milanowski and Suffczynski (2016), however, could not identify clear cut indications for CSD in electroencephalographic data from the human epileptic brain. This discrepancy might have been caused by a data selection bias and/or the high variability of brain dynamics seen within and between subjects with epilepsy in between and prior to seizures Mormann et al. (2007); Kuhlmann et al. (2018). Here we address this issue and investigate retrospectively long-term, multichannel intracranial electroencephalographic (iEEG) recordings from 28 subjects with epilepsy. Using a surrogate-based evaluation procedure of sensitivity and specificity of time-resolved estimates of variance and lag-1 autocorrelation, we found no evidence for CSD prior to 105 epileptic seizures.
II Data and Methods
We investigated 2056 h iEEG data recorded from about 1650 brain sites in 28 subjects with epilepsy who underwent pre-surgical evaluation at the Department of Epileptology of the University of Bonn. These subjects suffered from pharmacoresistant focal seizures with different anatomical onset locations. The study was approved by the ethics committee of the University of Bonn, and all patients had signed informed consent that their clinical data might be used and published for research purposes.
These multi-day, multi-channel data were part of previous studies Dickten et al. (2016); Lehnertz et al. (2016); Rings et al. (2019); Rings, von Wrede, and Lehnertz (2019), were band-pass-filtered between 1 – 45 Hz, sampled at 200 Hz using a 16 bit analogue-to-digital converter, and were referenced against the average of two electrode contacts outside the presumed focal brain region. Reference contacts were chosen individually for each patient, and their data was disregarded in this study. About 30 % of electrode contacts were confined to the brain region(s) from which seizures originate and its (their) direct vicinity, while the other contacts sampled brain dynamics in different lobes on the same and the opposite brain hemisphere. The majority of investigated brain sites investigated here is usually deemed unaffected by the epileptic process.
In order to probe for indications of CSD prior to seizures, we proceeded as follows:
First, we estimated – for each subject – (unbiased sample) variance and lag-1 autocorrelation of iEEG data from each brain site (, where denotes the number of recording sites) in a sliding-window fashion Lehnertz et al. (2017) ( denotes the window number, and each window had a length of 20.48 s). For estimating the lag-1 autocorrelation , we chose the smallest time-delay (here ), for which the autocorrelation function is not dominated by spurious correlations induced by the applied low-pass filter. In order to not bias our analyses with effects stemming from occasional high-amplitude artifacts in the iEEG, we omitted the upper 0.5 % of all values. In addition, we estimated the local derivatives of and time series.
Second, we compared the distributions of values of indicators for CSD from an assumed pre-seizure period with the remaining data employing the receiver-operating-characteristics (ROC) Egan (1975). This allows us to assess the overall separability of distributions in terms of sensitivity and specificity of an indicator. We excluded, however, the 60 min interval after the onset of a seizure in order to not bias our analyses with effects from the seizure and particularly from the post-seizure period So and Blume (2010). Given that seizure generation is likely to take place over minutes to hours Mormann et al. (2007); Kuhlmann et al. (2018), we assumed a pre-seizure period to last for . Eventually, we calculated the area under the ROC curve relative to the case of identical distributions. The absolute value of is than confined to the interval , and a positive/negative value corresponds to indicators for critical slowing down to be increased/decreased during the pre-seizure periods.
Third, we assessed the statistical validity of our findings by employing the concept of seizure time surrogates Andrzejak et al. (2003). We designed for each subject a total of 19 different surrogate sets of randomized seizure onset times by randomly permutating the intervals between seizures including the interval between the first seizure and the beginning of the recording. An indication for CSD prior to seizures can be considered significant (), if for original seizure times and if exceeds the maximum one obtained with 19 the seizure time surrogates.
III Results
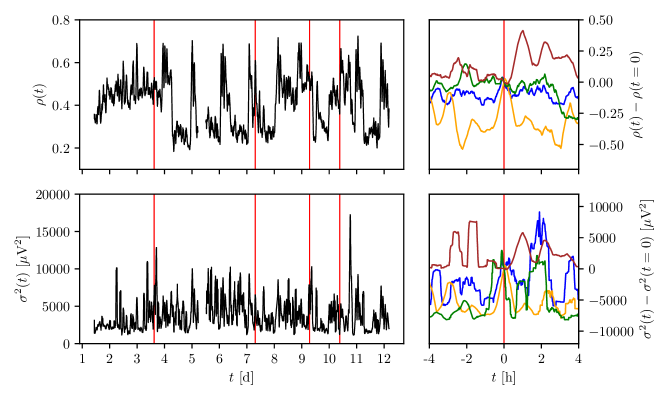
In the following, we present our findings for indicators lag-1 autocorrelation and variance evaluated for pre-seizure periods lasting 4 h. We obtained qualitatively similar findings for local derivatives of and time series and for pre-seizure periods with shorter duration. In Fig. 1, we show time series of indicators for CSD for an exemplary long-term recording covering twelve days. If we consider a time window of 4 h prior to seizures, we observe both indicators to either increase, to decrease, or to exhibit no clear-cut changes at all, on average. We observe, however, a similar behavior at times far off epileptic seizures, which already puts into perspective considering these indicators as generic early warning signals.
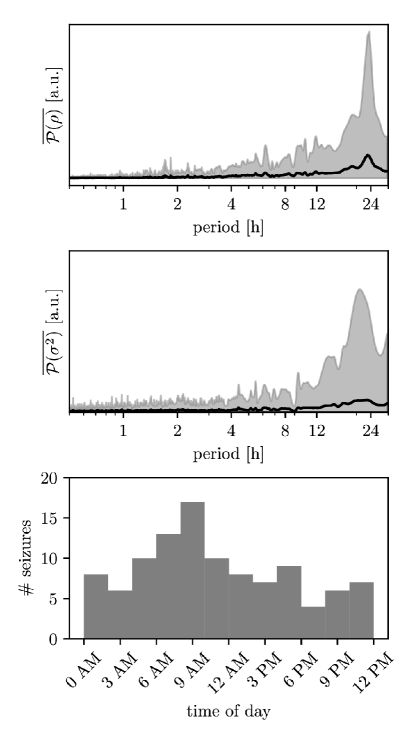
Interestingly, the dynamics of both indicators appears to be modulated on various timescales, most notably by daily rhythms such as the sleep-wake cycle. We therefore investigated the contribution of different timescales on the variability of indicators by estimating the power spectral density (Lomb-Scargle periodogram Press and Rybicki (1989)) of the unsmoothed time series of and from each electrode contact. We observe power spectral densities for the investigated subjects to be qualitatively similar, with strong contributions at about 24 h (Fig. 2 top and middle). Processes acting on shorter timescales (<4 h) contribute only marginally. Our findings indicate that a large fraction of the temporal variability of indicators for CSD can be attributed to processes acting on timescales of hours to days, with strong contributions of daily rhythms.
Currently, there is only weak evidence (mostly from modeling studies) for the wake-sleep/sleep-wake transition to represent a critical transition Steyn-Ross et al. (2005); Yang et al. (2016). Despite there being some studies that relate these physiologic transitions to the occurrence of seizures Stevens et al. (1971); Karoly et al. (2016); Baud et al. (2018); Karoly et al. (2018), the exact mechanisms underlying a possible relationship between sleep and epilepsy remain largely unknown Takagi (2017). We note that the seizures investigated here are not closely related to transitions into or out of sleep. Despite an increased incidence of seizures in the morning, which can be related to clinical investigations, seizures occurred equally distributed over the 24 h cycle (Fig. 2 bottom).
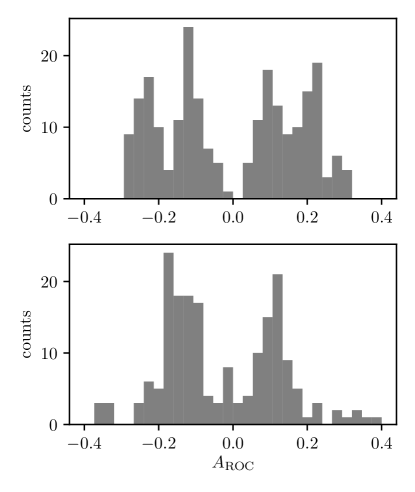
In order to demonstrate extendability of these observations beyond exemplary data, we show for indicators and in Fig. 3 the respective distributions of values of (area under the ROC curve) considered significant using our surrogate test. Of the 1647 brain sites, about one-seventh passed the test. From their corresponding values, we conclude that in the majority of cases both and rather point to a “critical speeding up” than to a critical slowing down. Although comparably high values can occasionally be observed, it is important to note that absolute values of for the original seizure times exceeded the maximum one of the seizure time surrogates by, on average, 7 %. These findings indicate significant sensitivity and specificity of indicators for CSD for only a small number of brain sites.
Eventually, we investigated whether changes of indicators observed so far are spatially confined to the brain region(s) from which seizures originate. This was the case for 48 sites using , resp. 31 sites using , and there were indications for CSD at about half these sites (22 resp. 17). This could be traced back to the data from six subjects. We checked whether these observations may result from the strongly varying number of electrode contacts that sample the various brain regions (hypergeometric tests; ). This was the case for all six subjects when using as an indicator for CSD, and in four subjects when using . In addition, a closer inspection of electrode types and locations in these subjects, however, revealed a spatial oversampling at about 50 % of these sites.
This leaves us with two to three subjects for which our chain of analysis indicates critical slowing down prior to seizures (based on lag-1 autocorrelation) at about 1-2% of their sampled brain sites, similar to what has been described before Mormann et al. (2005); Milanowski and Suffczynski (2016). We could not identify any peculiarities for these subjects.
IV Conclusion
Addressing a number of claims for critical slowing down prior to epileptic seizures, we investigated long-lasting, multichannel invasive electroencephalographic (iEEG) recordings that captured more than 100 seizures from 28 subjects with epilepsy. We estimated the often-used early warning indicators for critical slowing down, namely variance and lag-1 autocorrelation, from iEEG time series, and – in contrast to many previous studies – utilized state-of-the-art statistical approaches to evaluate (temporal and spatial) sensitivity and specificity of indicators that involve specifically designed surrogate tests.
We found no clear-cut evidence for critical slowing down prior to epileptic seizures in humans. We identified the sleep-wake cycle as a potential confounding variable – among others – that might obscure detection of critical slowing down prior to seizures. It is important to note that we lack clear-cut evidence for the wake-sleep/sleep-wake transition to represent a (physiologic) critical transition, and that the exact mechanisms underlying a possible sleep-induced occurrence of seizures remain largely unknown Takagi (2017); Khan et al. (2018).
Also, we found no clear-cut evidence for critical slowing down to be confined to the brain region from which epileptic seizures appear to originate. The lack of a spatial sensitivity and specificity of indicators for critical slowing down not only supports the current notion of a network mechanism to underlie the transition to the pre-seizure state Lehnertz et al. (2014); Geier et al. (2015); Lehnertz et al. (2016); Kuhlmann et al. (2018); Spencer, Gerrard, and Zaveri (2018); Rings, von Wrede, and Lehnertz (2019) but also indicates that the mechanism behind the critical transition assumed here (bifurcation-induced tipping) may be too simplistic for the human epileptic brain. There are other mechanisms behind tipping phenomena, such as noise-induced and rate-dependent tipping Ashwin et al. (2012). Neither of these require any change of stability, and there may be no easy-identifiable early warning signals for such cases Ashwin et al. (2012); Ritchie and Sieber (2016, 2017).
Research into seizure prediction Mormann et al. (2007); Kuhlmann et al. (2018) has evaluated a large number of analysis concepts and methods to identify early warning signals for seizures, also with respect to clinical applicability. Univariate linear time series analysis techniques, such as the ones employed here, and also some univariate nonlinear techniques McSharry, Smith, and Tarassenko (2003) have been known to be insufficient for quite some time Mormann et al. (2005, 2007). We consider it a more promising approach to investigate how seizures emerge from large-scale brain networks taking into account their time-varying structure and function.
Acknowledgements
We are grateful to Timo Bröhl for interesting discussions and for critical comments on earlier versions of the manuscript.
References
- Afrajmovich et al. (1994) V. Afrajmovich, Y. S. Il’yashenko, L. Shil’nikov, V. Arnold, V. Arnold, and N. Kazarinoff, Dynamical Systems V: Bifurcation Theory and Catastrophe Theory (Springer, 1994).
- Thompson, Stewart, and Ueda (1994) J. M. T. Thompson, H. B. Stewart, and Y. Ueda, “Safe, explosive, and dangerous bifurcations in dissipative dynamical systems,” Phys. Rev. E 49, 1019 (1994).
- Dakos et al. (2008) V. Dakos, M. Scheffer, E. H. van Nes, V. Brovkin, V. Petoukhov, and H. Held, “Slowing down as an early warning signal for abrupt climate change,” Proc. Natl. Acad. Sci. U.S.A. 105, 14308–14312 (2008).
- Scheffer et al. (2009) M. Scheffer, J. Bascompte, W. A. Brock, V. Brovkin, S. R. Carpenter, V. Dakos, H. Held, E. H. Van Nes, M. Rietkerk, and G. Sugihara, “Early-warning signals for critical transitions,” Nature 461, 53 (2009).
- Kuehn (2011) C. Kuehn, “A mathematical framework for critical transitions: Bifurcations, fast-slow systems and stochastic dynamics,” Physica D 240, 1020–1035 (2011).
- Lenton et al. (2012) T. Lenton, V. Livina, V. Dakos, E. Van Nes, and M. Scheffer, “Early warning of climate tipping points from critical slowing down: comparing methods to improve robustness,” Phil. Trans. Roy. Soc. A: Mathematical, Physical and Engineering Sciences 370, 1185–1204 (2012).
- Sieber and Thompson (2012) J. Sieber and J. M. T. Thompson, “Nonlinear softening as a predictive precursor to climate tipping,” Phil. Trans. Roy. Soc. A: Mathematical, Physical and Engineering Sciences 370, 1205–1227 (2012).
- Scheffer et al. (2012) M. Scheffer, S. R. Carpenter, T. M. Lenton, J. Bascompte, W. Brock, V. Dakos, J. van de Koppel, I. A. van de Leemput, S. A. Levin, E. H. van Nes, M. Pascual, and J. Vandermeer, “Anticipating critical transitions,” Science 338, 344–348 (2012).
- Dai et al. (2012) L. Dai, D. Vorselen, K. S. Korolev, and J. Gore, “Generic indicators for loss of resilience before a tipping point leading to population collapse,” Science 336, 1175–1177 (2012).
- Feudel, Pisarchik, and Showalter (2018) U. Feudel, A. N. Pisarchik, and K. Showalter, “Multistability and tipping: From mathematics and physics to climate and brain—minireview and preface to the focus issue,” Chaos 28, 033501 (2018).
- Kaszás, Feudel, and Tél (2019) B. Kaszás, U. Feudel, and T. Tél, “Tipping phenomena in typical dynamical systems subjected to parameter drift,” Sci. Rep. 9, 8654 (2019).
- Dakos et al. (2012) V. Dakos, S. R. Carpenter, W. A. Brock, A. M. Ellison, V. Guttal, A. R. Ives, S. Kéfi, V. Livina, D. A. Seekell, E. H. van Nes, and M. Scheffer, “Methods for detecting early warnings of critical transitions in time series illustrated using simulated ecological data,” PLOS ONE 7, 1–20 (2012).
- Kubo (1966) R. Kubo, “The fluctuation-dissipation theorem,” Rep. Prog. Phys. 29, 255 (1966).
- Ditlevsen and Johnsen (2010) P. D. Ditlevsen and S. J. Johnsen, “Tipping points: early warning and wishful thinking,” Geophys. Res. Lett. 37, L19703 (2010).
- Boettiger and Hastings (2012) C. Boettiger and A. Hastings, “Early warning signals and the prosecutor’s fallacy,” Proc Roy Soc. B: Biol. Sci. 279, 4734–4739 (2012).
- Boettiger, Ross, and Hastings (2013) C. Boettiger, N. Ross, and A. Hastings, “Early warning signals: the charted and uncharted territories,” Theor. Ecol. 6, 255–264 (2013).
- Boettiger and Hastings (2013) C. Boettiger and A. Hastings, “No early warning signals for stochastic transitions: insights from large deviation theory,” Proc. Roy. Soc. B: Biol. Sci. 280, 20131372 (2013).
- Guttal, Jayaprakash, and Tabbaa (2013) V. Guttal, C. Jayaprakash, and O. P. Tabbaa, “Robustness of early warning signals of regime shifts in time-delayed ecological models,” Theor. Ecol. 6, 271–283 (2013).
- Dakos et al. (2015) V. Dakos, S. R. Carpenter, E. H. van Nes, and M. Scheffer, “Resilience indicators: prospects and limitations for early warnings of regime shifts,” Phil. Trans. R. Soc. B: Biol. Sci. 370, 20130263 (2015).
- Dai, Korolev, and Gore (2015) L. Dai, K. S. Korolev, and J. Gore, “Relation between stability and resilience determines the performance of early warning signals under different environmental drivers,” Proc. Natl. Acad. Sci. (U.S.A.) 112, 10056–10061 (2015).
- Diks, Hommes, and Wang (2015) C. Diks, C. Hommes, and J. Wang, “Critical slowing down as an early warning signal for financial crises?” Empirical Economics , 1–28 (2015).
- Wagner and Eisenman (2015) T. J. Wagner and I. Eisenman, “False alarms: How early warning signals falsely predict abrupt sea ice loss,” Geophys. Res. Lett. 42, 10–333 (2015).
- Zhang, Kuehn, and Hallerberg (2015) X. Zhang, C. Kuehn, and S. Hallerberg, “Predictability of critical transitions,” Phys. Rev. E 92, 052905 (2015).
- Milanowski and Suffczynski (2016) P. Milanowski and P. Suffczynski, “Seizures start without common signatures of critical transition,” Int. J. Neural Syst. 26, 1650053 (2016).
- Qin and Tang (2018) S. Qin and C. Tang, “Early-warning signals of critical transition: Effect of extrinsic noise,” Phys. Rev. E 97, 032406 (2018).
- O’Regan and Burton (2018) S. M. O’Regan and D. L. Burton, “How stochasticity influences leading indicators of critical transitions,” Bull. Math. Biol. 80, 1630–1654 (2018).
- Romano and Kuehn (2018) F. Romano and C. Kuehn, “Analysis and predictability of tipping points with leading-order nonlinear term,” Int. J. Bifurcation Chaos 28, 1850103 (2018).
- Wen, Ciamarra, and Cheong (2018) H. Wen, M. P. Ciamarra, and S. A. Cheong, “How one might miss early warning signals of critical transitions in time series data: A systematic study of two major currency pairs,” PloS one 13, e0191439 (2018).
- Clements, McCarthy, and Blanchard (2019) C. F. Clements, M. A. McCarthy, and J. L. Blanchard, “Early warning signals of recovery in complex systems,” Nat. Commun. 10, 1681 (2019).
- Jäger and Füllsack (2019) G. Jäger and M. Füllsack, “Systematically false positives in early warning signal analysis,” PloS one 14, e0211072 (2019).
- Kramer et al. (2012) M. A. Kramer, W. Truccolo, U. T. Eden, K. Q. Lepage, L. R. Hochberg, E. N. Eskandar, J. R. Madsen, J. W. Lee, A. Maheshwari, E. Halgren, et al., “Human seizures self-terminate across spatial scales via a critical transition,” Proc. Natl. Acad. Sci. (U.S.A.) 109, 21116–21121 (2012).
- Meisel and Kuehn (2012) C. Meisel and C. Kuehn, “Scaling effects and spatio-temporal multilevel dynamics in epileptic seizures,” PLoS One 7, e30371 (2012).
- van de Leemput et al. (2014) I. A. van de Leemput, M. Wichers, A. O. Cramer, D. Borsboom, F. Tuerlinckx, P. Kuppens, E. H. van Nes, W. Viechtbauer, E. J. Giltay, S. H. Aggen, et al., “Critical slowing down as early warning for the onset and termination of depression,” Proc. Natl. Acad. Sci. (U.S.A.) 111, 87–92 (2014).
- Meisel et al. (2015) C. Meisel, A. Klaus, C. Kuehn, and D. Plenz, “Critical slowing down governs the transition to neuron spiking,” PLoS Comput. Biol. 11, e1004097 (2015).
- Bayani et al. (2017) A. Bayani, F. Hadaeghi, S. Jafari, and G. Murray, “Critical slowing down as an early warning of transitions in episodes of bipolar disorder: A simulation study based on a computational model of circadian activity rhythms,” Chronobiol. Int. 34, 235–245 (2017).
- Scheffer et al. (2018) M. Scheffer, J. E. Bolhuis, D. Borsboom, T. G. Buchman, S. M. Gijzel, D. Goulson, J. E. Kammenga, B. Kemp, I. A. van de Leemput, S. Levin, C. M. Martin, R. J. F. Melis, E. H. van Nes, L. M. Romero, and M. G. M. Olde Rikkert, “Quantifying resilience of humans and other animals,” Proc. Natl. Acad. Sci. (U.S.A.) 115, 11883–11890 (2018).
- Freestone, Karoly, and Cook (2017) D. R. Freestone, P. J. Karoly, and M. J. Cook, “A forward-looking review of seizure prediction,” Curr. Opin. Neurol. 30, 167–173 (2017).
- Nazarimehr, Golpayegani, and Hatef (2018) F. Nazarimehr, S. M. R. H. Golpayegani, and B. Hatef, “Does the onset of epileptic seizure start from a bifurcation point?” Eur. Phys. J. ST 227, 697–705 (2018).
- Mormann et al. (2005) F. Mormann, T. Kreuz, C. Rieke, R. G. Andrzejak, A. Kraskov, P. David, C. E. Elger, and K. Lehnertz, “On the predictability of epileptic seizures,” Clin. Neurophysiol. 116, 569–587 (2005).
- Mormann et al. (2007) F. Mormann, R. Andrzejak, C. E. Elger, and K. Lehnertz, “Seizure prediction: the long and winding road,” Brain 130, 314–333 (2007).
- Kuhlmann et al. (2018) L. Kuhlmann, K. Lehnertz, M. P. Richardson, B. Schelter, and H. P. Zaveri, “Seizure prediction—ready for a new era,” Nat Rev. Neurol. , 618–630 (2018).
- Dickten et al. (2016) H. Dickten, S. Porz, C. E. Elger, and K. Lehnertz, “Weighted and directed interactions in evolving large-scale epileptic brain networks,” Sci. Rep. 6, 34824 (2016).
- Lehnertz et al. (2016) K. Lehnertz, H. Dickten, S. Porz, C. Helmstaedter, and C. E. Elger, “Predictability of uncontrollable multifocal seizures – towards new treatment options,” Sci. Rep. 6, 24584 (2016).
- Rings et al. (2019) T. Rings, M. Mazarei, A. Akhshi, C. Geier, M. R. R. Tabar, and K. Lehnertz, “Traceability and dynamical resistance of precursor of extreme events,” Sci. Rep. 9, 1744 (2019).
- Rings, von Wrede, and Lehnertz (2019) T. Rings, R. von Wrede, and K. Lehnertz, “Precursors of seizures due to specific spatial-temporal modifications of evolving large-scale epileptic brain networks,” Sci. Rep. 9, 10623 (2019).
- Lehnertz et al. (2017) K. Lehnertz, C. Geier, T. Rings, and K. Stahn, “Capturing time-varying brain dynamics,” EPJ Nonlin. Biomed. Phys. 5, 2 (2017).
- Egan (1975) J. P. Egan, Signal detection theory and ROC-analysis (Academic press, 1975).
- So and Blume (2010) N. K. So and W. T. Blume, “The postictal EEG,” Epilepsy Behav. 19, 121–126 (2010).
- Andrzejak et al. (2003) R. G. Andrzejak, F. Mormann, T. Kreuz, C. Rieke, A. Kraskov, C. E. Elger, and K. Lehnertz, “Testing the null hypothesis of the nonexistence of a preseizure state,” Phys. Rev. E 67, 010901(R) (2003).
- Press and Rybicki (1989) W. H. Press and G. B. Rybicki, “Fast algorithm for spectral analysis of unevenly sampled data,” Astrophys. J. 338, 277–280 (1989).
- Steyn-Ross et al. (2005) D. A. Steyn-Ross, M. L. Steyn-Ross, J. W. Sleigh, M. T. Wilson, I.-P. Gillies, and J. J. Wright, “The sleep cycle modelled as a cortical phase transition,” J. Biol. Phys. 31, 547–569 (2005).
- Yang et al. (2016) D.-P. Yang, L. McKenzie-Sell, A. Karanjai, and P. A. Robinson, “Wake-sleep transition as a noisy bifurcation,” Phys. Rev. E 94, 022412 (2016).
- Stevens et al. (1971) J. Stevens, H. Kodama, B. Lonsbury, and L. Mills, “Ultradian characteristics of spontaneous seizures discharges recorded by radio telemetry in man,” Electroencephalogr. Clin. Neurophysiol. 31, 313–325 (1971).
- Karoly et al. (2016) P. J. Karoly, D. R. Freestone, R. Boston, D. B. Grayden, D. Himes, K. Leyde, U. Seneviratne, S. Berkovic, T. O’Brien, and M. J. Cook, “Interictal spikes and epileptic seizures: their relationship and underlying rhythmicity,” Brain 139, 1066–1078 (2016).
- Baud et al. (2018) M. O. Baud, J. K. Kleen, E. A. Mirro, J. C. Andrechak, D. King-Stephens, E. F. Chang, and V. R. Rao, “Multi-day rhythms modulate seizure risk in epilepsy,” Nat. Commun. 9, 88 (2018).
- Karoly et al. (2018) P. J. Karoly, D. M. Goldenholz, D. R. Freestone, R. E. Moss, D. B. Grayden, W. H. Theodore, and M. J. Cook, “Circadian and circaseptan rhythms in human epilepsy: a retrospective cohort study,” Lancet Neurol. 17, 977–985 (2018).
- Takagi (2017) S. Takagi, “Sleep and epilepsy,” Sleep Biol. Rhythms 15, 189–196 (2017).
- Khan et al. (2018) S. Khan, L. Nobili, R. Khatami, T. Loddenkemper, C. Cajochen, D.-J. Dijk, and S. H. Eriksson, “Circadian rhythm and epilepsy,” Lancet Neurol. 17, 1098–1108 (2018).
- Lehnertz et al. (2014) K. Lehnertz, G. Ansmann, S. Bialonski, H. Dickten, C. Geier, and S. Porz, “Evolving networks in the human epileptic brain,” Physica D 267, 7–15 (2014).
- Geier et al. (2015) C. Geier, S. Bialonski, C. E. Elger, and K. Lehnertz, “How important is the seizure onset zone for seizure dynamics?” Seizure 25, 160–166 (2015).
- Spencer, Gerrard, and Zaveri (2018) D. D. Spencer, J. L. Gerrard, and H. P. Zaveri, “The roles of surgery and technology in understanding focal epilepsy and its comorbidities,” Lancet Neurol. 17, 373–382 (2018).
- Ashwin et al. (2012) P. Ashwin, S. Wieczorek, R. Vitolo, and P. Cox, “Tipping points in open systems: bifurcation, noise-induced and rate-dependent examples in the climate system,” Phil. Trans. Roy. Soc. A: Mathematical, Physical and Engineering Sciences 370, 1166–1184 (2012).
- Ritchie and Sieber (2016) P. Ritchie and J. Sieber, “Early-warning indicators for rate-induced tipping,” Chaos 26, 093116 (2016).
- Ritchie and Sieber (2017) P. Ritchie and J. Sieber, “Probability of noise- and rate-induced tipping,” Phys. Rev. E 95, 052209 (2017).
- McSharry, Smith, and Tarassenko (2003) P. E. McSharry, L. A. Smith, and L. Tarassenko, “Prediction of epileptic seizures: Are nonlinear methods relevant?” Nat. Med. 9, 241 (2003).