From Monolithic Systems to Microservices: A Decomposition Framework based on Process Mining
TASE - Tampere Software Engineering Research Group
Tampere University. Tampere Finland
davide.taibi@tuni.fi, kari.systa@tuni.fi
Abstract
Decomposition is one of the most complex tasks during the migration from monolithic systems to microservices, generally performed manually, based on the experience of the software architects. In this work, we propose a 6-step framework to reduce the subjectivity of the decomposition process. The framework provides software architects with a set of decomposition options, together with a set of measures to evaluate and compare their quality. The decomposition options are identified based on the independent execution traces of the system by means of the application of a process-mining tool to the log traces collected at runtime. We validated the process, in an industrial project, by comparing the proposed decomposition options with the one proposed by the software architect that manually analyzed the system. The application of our framework allowed the company to identify issues in their software that the architect did not spot manually, and to discover more suitable decomposition options that the architect did not consider. The framework could be very useful also in other companies to improve the quality of the decomposition of any monolithic system, identifying different decomposition strategies and reducing the subjectivity of the decomposition process. Moreover, researchers could extend our approach increasing the support and further automating the decomposition support.
1 INTRODUCTION
Software evolves through its life-time, and often a large part the effort and costs is spent on software maintenance [Lehman1980]. Furthermore, the incremental development practices in modern software development makes the nature of all the development processes to resemble a maintenance one [TommiKari2014]. A major obstacle to efficient maintenance is the tight coupling between the internal components of the software. In monolithic systems, most changes require modifications to several parts of the systems, and often size and complexity of the modification is hard to estimate in advance.
One approach to tackle the maintenance problem is to decompose the system into small and independent modules [Parnas1972] [SOLDANI2018]. Often, at the same time, companies want to utilize benefits of service-oriented architectures and even microservices, such as independent development, scaling and deployment [TaibiIEEECloud].
Microservices are an adaptation service-oriented architecture but focuses on of relatively small and independently deployed services, with a single and clearly defined purpose [fowler2014microservices]. The independent development and deployment bring several advantages. Different microservices can be developed in different programming languages, they can scale independently from other services, and each microservice can be deployed on the most suitable the hardware. Moreover, small services are easier to maintain and the split to independent responsibilities increases fault-tolerant since a failure of one service will not break the whole system. From the architectural perspective a well-designed microservice encapsulates its data and design choices. Thus, the internal logic of a microservice can be changed without affecting the external interface. This reduces the need for interaction between the teams [TaibiCommunication] [TaibiRequirements].
However, decomposing a monolithic system into a set of independent microservices is a very difficult and complex tasks [TaibiIEEECloud][TaibiXP17]. Decomposition of a system into separately maintained services is difficult as such, but microservice architecture adds further challenges related to performance. Calls inside a microservice are significantly lighter than calls between microservices. Still, the quality of the decomposition – the optimal slicing of the monolith to services – is critical for gaining the assumed benefits of using microservices. The software architects usually perform the decomposition manually but the practitioners have claimed that a tool to support identification different possible slicing solutions [SOLDANI2018][TaibiIEEECloud] [TaibiCLOSER] would greatly help the task. Typically, the only helping tools for the software architects have been based on the static analysis of dependencies such as Structure 101111Structure101 Software Architecture Environment - http://www.structure101.com. The actual discovery of slicing options has still been done by experienced software architects. In microservices, the dynamic behavior of the system is important too since it affects the performance and maintainability. Since static dependency analysis tools are not able to capture the dynamic behavior we decided to explore slicing based on runtime behavior instead of only considering static dependencies.
In our previous work work, we proposed a microservice decomposition framework [DavideKari2019] based on process-mining to ease the identification of splitting candidates for decomposing a monolithic system into separate microservices. The framework is based on logs produced by process mining of the original monolithic system. The decomposition framework has been also validated in our previous study [DavideKari2019] in collaboration with an SME. The results of [DavideKari2019] shows that dynamic call history can be effectively used in the decomposition of microservices. This approach can also identify architectural issues in monolithic systems. The approach can be used by companies to proposed different slicing options to the software architects and to provide additional analysis of the software asset. This would reduce the risk of wrong slicing solutions.
In this paper, we extend the previous decomposition framework [DavideKari2019] proposing a new measurement framework to objectively compare two decomposition options. The measurement framework can be used independently from the decomposition strategy adopted.
The remainder of this paper is structured as follows. Section LABEL:sec:background presents the background on processes for migrating and splitting monolithic systems into microservices. Section LABEL:sec:measurementFramework presents the measurement framework. Section 2 describes our proposed decomposition approach. Section LABEL:sec:discussion discusses the results. Section LABEL:sec:related presents related works while, finally Section LABEL:sec:conclusions draws conclusions.
2 Background and Related Work
Decomposing a system into independent subsystems is a task that has been performed for years in software engineering. Parnas [Parnas1972] proposed the first approach for modularizing systems in 1972. After Parnas’s proposal, several works proposed different approaches [LenarduzziICSE2017]. Recently, the decomposition of systems took on another dimension thanks to cloud-native systems and especially microservices. In microservices, every module is developed as an independent and self-contained service.
2.1 The Microservice Decomposition Process
Taibi et al. [TaibiIEEECloud] conducted a survey among 21 practitioners who adopted microservices at least two years ago in order to collect their motivation for, as well as the evolution, benefits, and issues of the adoption of microservices. Based on the results, they proposed a migration process framework composed of two processes for the redevelopment of the whole system from scratch and one process for creating new features with a microservice architecture on top of the existing system. They identified three different processes for migrating from a monolithic system to a microservices-based one. The goal of the first two processes is to support companies that need to migrate an existing monolithic system to microservices by re-implementing the system from scratch. The aim of the third approach is to implement new features only as microservices, to replace external services provided by third parties, or to develop features that need important changes and therefore can be considered as new features, thus gradually eliminating the existing system. All three of the identified processes are based on four common steps but differ in the details.
-
•
Analysis of the system structure. All processes start by analyzing dependencies mainly with the support of tools (Structure101, SchemaSpy 222http://schemaspy.sourceforge.net/, or others)
-
•
Definition of the new system architecture. Architectural guidelines or principles, and proposal of a decomposition solution into small microservices are defined. The decomposition is always done manually.
-
•
Prioritization of feature/service development. In this step, all three processes identify and prioritize the next microservices to be implemented. Some processes prioritize microservices based on customer value; others according to components with more bugs; and yet others prioritize the development of new features as microservices, expecting that, in the long run, the new ecosystem of microservices will gradually replace each feature of the existing monolith.
-
•
Coding and Testing are then carried out like any other software development project. Developers adopt the testing strategy they prefer. However, in some cases, testing of the different microservices is performed by doing unit testing at the microservices level and black-box testing at the integration level.
In this work, we focus mainly on the first two steps, supporting companies in the analysis of the system structure and in the identification of decomposition alternatives. The architectural guidelines should be defined by the company based on their internal policies.
2.2 Proposed Approaches for Identifying Microservices
Only a limited set of research works propose approaches aimed at supporting developers in decomposing their systems into an optimal set of microservices.
Abbott and Fischer [Abbott2015] proposed a decomposition approach based on the ”scalability cube”, which splits an application into smaller components to achieve higher scalability. Richardson [Richardson2017] also mentioned this approach in his four decomposition strategies:
-
•
”Decompose by business capability and define services corresponding to business capabilities”;
-
•
”Decompose by domain-driven design sub-domain”;
-
•
”Decompose by verb or use ‘cases’ and define services that are responsible for particular actions”;
-
•
”Decompose by nouns or resources by defining a service that is responsible for all operations on entities/resources of a given type”.
The first two strategies are mostly abstract patterns of human decisions [Yourdon1979] while the others are based on predefined criteria. Kecskemeti et al. [Kecskemeti2016] proposed a decomposition approach based on container optimization. The goal is to increase the elasticity of large-scale applications and the possibility to obtain more flexible compositions with other services.
Arndt and Guercio suggest decomposing a monolith system using a layered architecture style, with the outcome being highly cohesive and loosely coupled services, such as representation and business services. Another possibility is to start from a monolithic system and progressively move towards a microservices-based architecture [Zimmermann2017] or delivering separate microservices by splitting a development team into smaller ones responsible for a limited group of microservices.
Vresk et al. [VreskC16] defined an IoT concept and platform based on the orchestration of different IoT system components, such as devices, data sources, data processors, and storage. They recommend combining verb-based and noun-based decomposition approaches. The proposed approach hides the complexity stemming from the variation of end-device properties thanks to the application of a uniform approach for modeling both physical and logical IoT devices and services. Moreover, it can foster interoperability and extensibility using diverse communication protocols into proxy microservice components. Gysel et al. [Gysel16] proposed a clustering algorithm approach based on 16 coupling criteria derived from literature analysis and industry experience. This approach is an extensible tool framework for service decomposition as a combination of a criteria-driven methods. It integrates graph clustering algorithms and features priority scoring and nine types of analysis and design specifications. Moreover, this approach introduces the concept of coupling criteria cards using 16 different instances grouped into four categories: Cohesiveness, Compatibility, Constraints, and Communications. The approach was evaluated by integrating two existing graph clustering algorithms, combining actions research and case study investigations, and load tests. The results showed potential benefits to the practitioners, also confirmed by user feedback.
Chen et al. [Chen2017] proposed a data-driven microservices-oriented decomposition approach based on data flow diagrams from business logic. Theyr approach could deliver more rational, objective, and easy-to-understand results thanks to objective operations and data extracted from real-world business logic. Similarly, we adopt process mining to analyze the business processes of a monolithic system.
Alwis et al. [Alwis2018] proposed a heuristic to slice a monolithic system into microservices based on object subtypes (i.e., the lowest granularity of software based on structural properties) and functional splitting based on common execution fragments across software (i.e., the lowest granularity of software based on behavioral properties). This approach is the closer to our work. However, they analyzed the system by means of static analysis without capturing the dynamic behavior of the system and they did not propose measures to evaluate the quality of the slicing solution proposed.
Taibi et al., proposed a set of patterns and anti-patterns that should be carefully considered during the microservice decomposition [TaibiIEEEsw] [TaibiBOOK] recommending to avoid a set of harmful practices such as cyclic dependencies and hard-coded endpoints but also to consider critical anti-patterns and code smells [TaibiJL17] that can be generated into the monolithic system.
3 THE DECOMPOSITION FRAMEWORK
In this Section, we describe a decomposition framework that uses the data from the execution path analysis to discover the optimal split to micro services. A top-level description of the framework is given Figure 4.
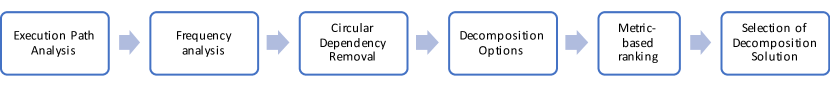
When the log files are available, the decomposition process defined in (Figure 4) can be started. The process consists of six steps that are outlined in the following subsections.
3.1 Step 1: Execution Path Analysis.
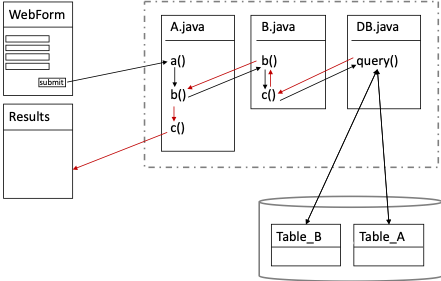
As our approach aims to optimize the system for the often used call sequences, the first step of our approach is to identify the most frequently executed call paths from the log files. One way to do that is use of a process-mining tool. In our case, we used DISCO 333https://fluxicon.com/disco/ to graphically represent the business processes found in the log files. Other similar tools can be used instead. The outcome of step 1 is a graphical representation of the processes and call graphs. One example of such graphical diagram is presented in Figure 5. The diagram shows the call paths between classes, methods and data bases with arrows. This figure provides the user with the following information:
-
•
The actually executed call paths in the system. Possible but never executed paths are not shown in this figure.
-
•
Inter-class dependencies in the system. The dependencies are visualized with arrows between methods and classes. The external dependencies to libraries or web-services are also visualized.
-
•
The usage frequency of each path. Process mining tools may present the frequency with thickness of the arrows or in a separate table as in Table 4.
-
•
Branches and circular dependencies. If the system has circular dependencies or branches in the call path, those can easily be found from the visualization.
The call paths, shown with chains of arrows in Figure 5, form candidates for business processes that are later used in the decomposition to microservices. For example, the path documented in Table LABEL:tab:Trace is visualized in a business process shown in Figure 5.
| Path | Freq. |
|---|---|
| A.a(); A.b(), B.b(), C.c(), DB.query, Table A, Table B, … | 1000 |
| A.b(); A.c(), B.a(), C.c(), DB.query, Table A, Table B, … | 150 |
3.2 Step 2: Frequency Analysis of the Execution Paths.
In our approach, the call frequency is a major contributor for the produced recommendations. Thus the frequency should be studied and analyzed. For visual inspection, the process analysis tools can provide help. For instance, in the DISCO tool, the thickness of the arrows reflect the call frequency. In addition to visual inspection, we use concrete numeric data for all execution paths with their usage frequency. So, the output of this step is a table similar to Table 4.
The Frequency Analysis step helps the architect to select the potential decomposition options. The numbers are used to calculate the measures presented in Section LABEL:sec:measurementFramework and used in step 6 (see Subsection 3.5).
3.3 Step 3: Removal of Circular Dependencies
In this step, we first find circular dependencies by analyzing the execution paths reported in the table generated in the first Step (e.g. Table 4). This can be done with a simple algorithm to discover cycles in the execution paths. In the case of circular dependencies, software architects should discuss with the development team how to break these cycles. One example of the patterns that can be applied to break the cycles is Inversion of Control [Martin2003]. However, every cyclic dependency could need a different breaking solution that must be analyzed carefully. The result is a refined version of the execution path table (see Table 4 as example).
Although this step is not part of the decomposition, it is important to consider cyclic dependencies to avoid possible deadlocks , and to better architect the system.
3.4 Step 4: Identification of Decomposition Options
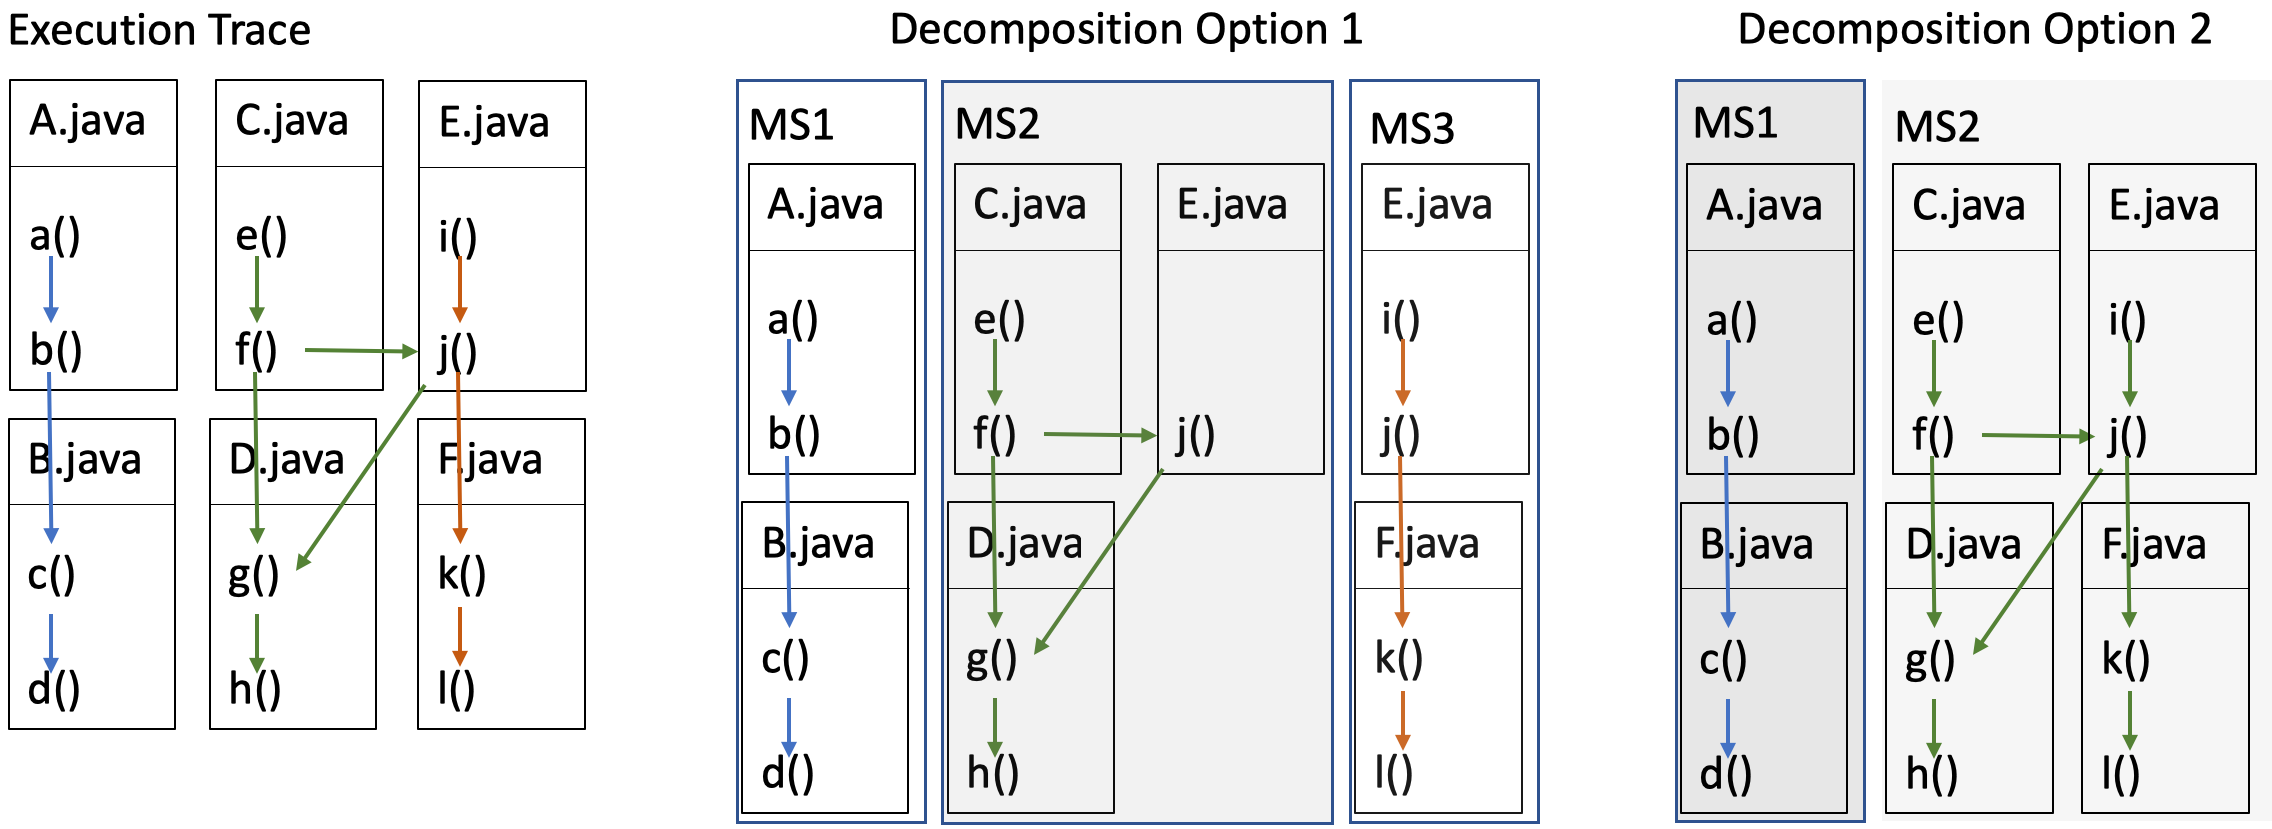
In this step the execution paths from Step 3 are used to identity different decomposition opportunities. Visual inspection of the call graphs like those shown in Figure 6 is used. We have relied on manual expert-based decomposition, but an algorithm to create different decompositions could be developed.
The execution paths may merge to common sub-paths or split into several branches. This leads to alternative decomposition solutions. This is demonstrated in Figure 6. If the six source files each providing implementation of a class are assigned to three different microservices as A.java+B.java, C.java+D.java and E.java+F.java, the calls form C.f() to E.j() and E.j() to D.g() are inter-service calls. These calls are heavier operations than local calls and expand the external interfaces of the microservices. If use of external calls is not feasible, there are two other alternatives that can be proposed. The first option is to use three microservices so that class E (or at least function j() of it) is duplicated in two microservices. The other option is to decompose into two microservices as shown in the rightmost part of Figure 6. Obviously, there is also the alternative to allow external calls and have three microservices with no duplications.
All these options have their advances and disadvantages, and the team should discuss the alternatives is from multiple view points. The consideration could include both functionality of the software – if the paths belong logically together, and development process – what are the consequences of duplication to the development team(s). In addition, the call frequency has to be taken into account. For example in above split and merge case, the team has to consider both the development effort and run-time cost of making the two call external. The metrics discussed LABEL:sec:measurementFramework help in analysing the run-time costs.
3.5 Step 5: Metric-based ranking of the decomposition options
In this step, we apply the measures identified in the Measurement Framework (Section LABEL:sec:measurementFramework), to help software architects to assess the quality of the decomposition options.
Sometimes optimization of the measures contradict with each other. Currently, we propose use of judgment of the team, but in the future approaches like Pareto[deb99] optimization could be used.
3.6 Step 6: Selection of the decomposition solution
In final step, the decomposition alternatives identified in Step 4 and the measures collected in Step 5 are used by the software architects to decide which solution to take.
Our approach does not automatically rank the solutions to any order. The software architects should consider the provided recommendations and measurements before selecting the solution. The team should discuss the relevance of the differences in their case.
| Solution 1 | Solution 2 | Solution 3 | ||||||||||
|---|---|---|---|---|---|---|---|---|---|---|---|---|
| CBM | CLA | DUP | FEC | CBM | CLA | DUP | FEC | CBM | CLA | DUP | FEC | |
| MS1 | 0.08 | 75 | 2 | 0.08 | 0.26 | 27 | 0 | 0.26 | 0.13 | 39 | 2 | 0.13 |
| MS2 | 0.29 | 31 | 4 | 0.29 | 0.33 | 33 | 2 | 0.33 | 0.26 | 27 | 0 | 0.26 |
| MS3 | 0.08 | 25 | 0 | 0.08 | 0.06 | 33 | 1 | 0.06 | 0.32 | 31 | 4 | 0.32 |
| MS4 | 0.16 | 43 | 2 | 0.16 | 0.08 | 50 | 3 | 0.08 | 0.17 | 41 | 3 | 0.17 |
| MS5 | 0.17 | 30 | 0 | 0.17 | 0.18 | 56 | 0 | 0.18 | 0.14 | 28 | 0 | 0.14 |
Applications built from microservices should be as decoupled and as cohesive as possible [fowler2014microservices]. In the case of loosely coupled services, changes to one service should not require changes to other services. Therefore, the developers of microservices can change and deploy their microservices independently. As reported by Sam Newman [Newman2015], “a loosely coupled service knows as little as it needs to about the services with which it collaborates.”. Therefore, developers should limit the number of different types of calls from one service to another.
Cohesion is the degree to which the elements of a certain class belong together. It is a measure of how strongly related each piece of functionality of a software module is [Fenton2014]. High cohesion makes the reasoning easy and limits the dependencies [Kramer2004]. Low coupling is commonly correlated with high cohesion [Kramer2004] [Jabangwe2015]. In microservices-based systems, low cohesion is achieved by grouping common business processes together, so that, if developers need to change the behavior, they need to change only a single microservice [Newman2015]. Practitioners commonly analyze dependencies with tools such as Structure 101. However, while dependency analysis tools can support the identification of static dependencies, they do not enable the identification of the full execution path. Our approach combines process mining techniques and dependency analysis to recommend alternative slicing solutions. In the next sub-sections, we report the underlying assumptions of our approach and the different steps that compose the decomposition process.
3.7 Assumptions
The approach requires the availability of an extended version of a log trace collected at runtime. For each user operation performed from the user interface (e.g., clicking on a button), or from any entry point of a system (e.g., APIs or command line), all the activities must be traced from the log files. Information about each class and method that is traversed for the execution of the operation must be included. The complete execution must be traced completely from the entry point (a click on a submission form or the beginning of an operation) to the access to the database (if any) and to the results returned to the client. An example of data reported in the log file is shown in Table 2. In this step, we instrument the software to produce a log. The log trace must include events that indicate entrance and exit of functions as well as database accesses. Each entry in the log also has a timestamp and a session ID, to distinguish between the usage of the same class or method from different users. The log trace could be collected by instrumenting the source code with Aspect Oriented Programming, by adding the log trace into each method or with existing applications such as the Elastic APM 444The Elastic APM Libraries. https://www.elastic.co/solutions/apm or similar, or adopting an approach similar to the one applied in [Sampo]. In case the data collection is not yet in place, we recommend to use Elastic APM, since it allows to easily instrument the code with a minor effort. For some languages (e.g. Java and Node.js) the instrumentation requires the addition of one line of code to the application configuration, specifying the type of log trace required and the logging server URL.
3.8 The decomposition Process
Once the log files are created, companies can start the decomposition following our 6-step process (Figure 4).
Step 1: Execution Path Analysis
In the first step, we identify the most frequently used execution paths with a process-mining tool. In our case, DISCO 555https://fluxicon.com/disco/ was used to graphically represent the business processes by mining the log files. The same result can be obtained by any other alternative process-mining tool. The result is a graphical representation of the processes, reporting each class and database table used in the business processes, with a set of arrows connecting each class based on the log traces. The result of this first step produces a figure similar to the one presented in Figure 5, \karior more like the basis in 7 ? that allows to understand:
-
•
Runtime execution paths of the system. Paths never used, even if possible, are not represented in the figure.
-
•
Dependencies between the classes of the system. The arrows represent the dependencies between methods and classes. External dependencies to libraries or web-services are also represented.
-
•
The frequency of usage of each path. Process mining tools present the most used processes with thicker arrows
-
•
Branches and Circular Dependencies. The graphical representation allows easy discovery of circular dependencies or branches (e.g., conditional statement that led to different path based on the input provided), in case they exist.
The complete chain of arrows forms a candidate of a process, and Figure 5. represents a simplified example of one business process representing the data reported in Table 4.
| Path | Freq. |
|---|---|
| A.a(); A.b(), B.b(), C.c(), DB.query, Table A, Table B, … | 1000 |
| A.b(); A.c(), B.a(), C.c(), DB.query, Table A, Table B, … | 150 |
| Start Time | End Time | Sess.ID | Class | Method |
|---|---|---|---|---|
| 00:00 | 00:36 | S1 | Form.jsp | btnClick() |
| 01:00 | 01:39 | S1 | A.java | a() |
| 01:40 | 01:45 | S1 | A.java | b() |
| 01:45 | 01:55 | S1 | B.java | b() |
| 01:56 | 02:05 | S1 | B.java | c() |
| 02:05 | 02:13 | S1 | DB.java | query() |
| 02:14 | 02:21 | S1 | DB | TABLE A |
| 02:22 | 03:28 | S1 | DB | TABLE B |
| 02:29 | 02:36 | S1 | B.java | c() |
| 02:36 | 02:45 | S1 | vB.java | b() |
| 02:46 | 02:55 | S1 | A.java | b() |
| 02:56 | 03:03 | S1 | A.java | c() |
| 03:04 | 03:16 | S1 | Results.jsp | render() |
Step 2: Frequency analysis of the execution paths
The thickness of the arrows created by the DISCO tool indicates the frequency of the calls between classes. This makes it possible to clearly understand which execution path are used most frequently and which classes are rarely or never used during runtime. The output of this step is a table representing all the different execution paths with the frequency of their usage.
Step 3: Removal of Circular Dependencies
In this step, we first find circular dependencies by analyzing the execution paths reported in the table generated in the first Step (e.g. Table 4). This can be done with a simple algorithm to discover cycles in the execution paths. In the case of circular dependencies, software architects should discuss with the development team how to break these cycles. One example of the patterns that can be applied to break the cycles is Inversion of Control [Martin2003]. However, every cyclic dependency could need a different breaking solution that must be analyzed carefully. The result is a refined version of the execution path table (see Table 4 as example).
Step 4: Identification of decomposition options
Starting with the execution paths without cyclic dependencies obtained from Step 3, we identify different decomposition alternatives by visually inspecting the generated graphs. The candidate processes may have common sub-paths, i.e., the processes may merge or split. Thus, different decomposition solutions are possible. This process could also be automated by developing an algorithm that provides all different decompositions based on the paths with fewer intersections. However, in this case, we rely on the expert-based decomposition. As highlighted in Figure 6, the decomposition options need to deal with the duplication of some classes or methods. As example, the execution traces reported in Figure 6 show that both the green and the orange execution traces use j(). Therefore, software architects could propose two decomposition alternatives. The first option includes the creation of three microservices where class E.java() is duplicated in microservice MS2 and MS3. The second option includes the creation of two microservices, merging MS2 and MS3. Both options have pros and cons, but the decision of merging two execution traces or splitting into different microservices must be discussed with the team. If two microservices candidates for the splitting have different purposes, it is reasonable to consider the splitting. If they are doing the same thing, then it would be better to merge them into one single microservice.
Step 5: Metric-based ranking of the decomposition options
In this step, we identify three measures to help software architects to assess the quality of the decomposition options identified in Step 4: Coupling, Number of classes per microservices, Number of classes that need to be duplicated.
Coupling
The decomposition to microservices should minimize coupling and maximize cohesion. Coupling and cohesion can be calculated with different approaches. While coupling can be obtained from our log traces, for all the cohesion measures we also need to know about the access to the local variables of each class, which makes it impossible to calculate them from the data reported in the log traces. However, coupling is commonly considered as inversely proportional to cohesion [Jabangwe2015]. Therefore, a system with low coupling will have a high likelihood of having high cohesion [Jabangwe2015]. We define the Coupling Between Microservice (CBM) extending the well-known Coupling Between Object (CBO) metric proposed by Chidamber and Kemerer [Chidamber1994]. CBO represents the number of classes coupled with a given class (efferent couplings and afferent couplings). This coupling can occur through method calls, field accesses, inheritance, arguments, return types, and exceptions.
We calculate the relative CBM for each microservice as follows:
where “Number Of External Links” represents the number of calls to external services used in each class of microservice. An external service linked several times by different classes of the same microservice is only counted once. External services could be other microservices, external APIs, etc.
CBM is calculated for each microservice independently and presented in a table for the next step.
Number of classes per microservice
This measure helps to understand how big the microservice identified is and to identify if there are microservices that are too big compared to others. the number of classes should be minimized since the smaller the number of classes the more independent its development can be. Considering the example reported in Figure 6, the decomposition option 1 has 7 classes while option 2 has six classes.
Number of classes that need to be duplicated
In some cases, several classes will be in common between two execution traces. As example, the method j in Class E (Figure 6) is used by two execution traces. In the example depicted in Figure 6, decomposition option 1 has one class that needs to be duplicated, while option 2 requires no classes to be duplicated.
This measure helps to reason about the different slicing options, considering not only the size of the microservices but also the number of duplications, that will be then reflected in the development of the microservices. Duplicated classes should be avoided since the duplication adds to the size of the system and its maintenance.
Step 6: Selection of the decomposition solution
This is the final step where, based on the different decomposition alternatives identified in Step 4, and on the measures collected in Step 5, software architects can decide which solution to adopt by merging or splitting existing processes. Software architects could consider the recommendation provided by our decomposition process and discuss with the team which solution is most suitable for them, considering the organizational structure. Our process does not recommend the best decomposition solution, but provides a reasoning framework on the possible decomposition options.
4 Validation: Industrial Case study
In this section, we validate the decomposition framework proposed in Section III. With this study, we aim to understand whether our approach can support developers in easily identifying different slicing options. For this purpose, we performed an industrial case study to compare the ad-hoc decomposition solution proposed by the software architect with the solutions proposed by our approach.
According to our expectations, we formulated the goal of the case study as:
Analyze the proposed decomposition solutions
for the purpose of evaluating and comparing
with respect to the perceived slicing easiness and usefulness
in the context of the migration of a monolithic system to microservices
from the point of view of software architects.
We formulated the questions of the case study as follows and further derived questions and metrics from them:
| RQ1 | Q1: Does adopting the proposed decomposition framework ease the identification of different microservices? |
| RQ2 | Q2: What do the developers, software architects, and project manager think about the applicability of this approach? |
| RQ3 | Q3: Are the developers willing to use the approach in the future? |
We answered our questions by surveying the project manager and the software architect who first manually applied the decomposition process as usual and then evaluate the decomposition options proposed by our framework. The measures identified for the questions were derived from the Technology Acceptance Model [Venkatesh00]. All questions were evaluated based on a 5-point ordinal Likert scale with the following options: 1 = strongly disagree, 2 = disagree, 3 = neither agree nor disagree, 4 = agree, 5 = strongly agree.
Q1 – Perceived ease of use: Here we aim to compare the perceived easiness of our approach with that of the experience-based (ad-hoc) approach. We adopted the Technology Acceptance Model [Venkatesh00] to collect measures about the ease of use of our approach, identifying the following metrics:
-
•
The process-mining approach would be easy for me to use during the decomposition phase.
-
•
It would be easy for me to become skillful at using the process-mining approach to decompose a monolithic system.
Q2 - Applicability: What do the participants think about the applicability of our approach? To answer this question, we collected the time overhead needed to perform the process-mining approach. Perceived usefulness: measures the degree to which the participants considered the approach useful for making project decisions. The evaluated criteria were:
-
•
I am sure that I was able to better decompose the system with this approach.
-
•
I was able to find alternative decomposition strategies.
-
•
I was able to better decompose the system, but the time required with the new approach is too much compared to its benefits.
-
•
I was able to better decompose the system, but the effort needed to trace the information on the log file is too much compared to the benefits of the approach.
-
•
The approach helped me to understand existing architectural issues in the existing monolithic system
Perceived understandability: measures the effort needed by the subject to understand the approach built or whether the participants will need to exert little effort to understand the relationship with the system concepts.
-
•
It was easy for me to understand how the approach works. Perceived easiness: measures the degree to which the subject believed that he or she was able to make project decisions easier than without the approach.
-
•
It was easy for me to identify decomposition options with the support of this approach.
-
•
I was able to identify decomposition options with less effort compared to the ad-hoc manual decomposition.
-
•
I was able to identify decomposition options more accurately.
Self-efficacy by applying the technique: The perceived ability to decompose a monolithic system into microservices by means of our proposed approach.
-
•
It was easy for me to keep an overview of the project and of the different decomposition options.
-
•
The approach helped me to increase the quality of the decompositions.
Q3 - Willingness to use our approach in the future: With this question, we aim to understand whether the company would be willing to use our system in the future. We collected this measure with the following question:
-
•
I will adopt this approach in the future.
Table 5 report the list of questions and the results of this study.
![[Uncaptioned image]](/html/1908.08513/assets/x7.png)
4.1 Study Context
The approach was applied in an SME in Milan (Italy). The company develops a document management system for bookkeeping, for Italian tax accountants. The goal of the system is to make it possible to manage the whole bookkeeping process, including management of the digital invoices, sending the invoice to the Ministry of Economic Development, and fulfilling all the legal requirements, which usually change every year.
The system is developed by two teams of 4 developers, plus two part-time developers following the moonlight scrum process [TaibiMoonlight], the software architect and a project manager. currently being used by more than 2000 tax accountants, who need to store more than 20M invoices per year. The system has been developed for more than 12 years and is now composed of more than 1000 Java classes.
The Italian government usually updates the bookkeeping process between December and January of every year, which involves not only changing the tax rate but also modifying the process of storing the invoices. However, tax declarations can be made starting in March/April of each year. Therefore, in the best case, the company has between two to four months to adapt their software to the new rules in order to enable tax accountants to work with the updated regulations from March/April.
Up to now, the company used to hire a consultancy company to help them during these three months of fast-paced work. However, since the system is growing year after year, they decided to migrate to microservice to facilitate maintenance of the system [Nyyti19] and to distribute the work to independent groups, reducing communication needs and supporting fast delivery [TaibiRequirements][TaibiCommunication].
4.2 Study Execution
We performed this study in three steps:
| Step 1 | Q1: The software architect manually identified the different microservices and a decomposition strategy. |
| Step 2 | Q2: We applied our 6-steps process to identify different decomposition solutions and then we compared them to the solution proposed by the software architect. |
| Step 3 | Q3: The software architect and the project manager provided feedback on the usefulness of our approach. |
4.3 Case Study Results
With the support of the development team, the software architect manually identified a set of microservices. He first drew the dependency graph with Structure 101.
Then we applied our approach to mine their log files. The company already logged all the operations of their systems with Log4J 666https://logging.apache.org/log4j, tracing all the information reported in Table 4, together with other information such as the user involved in the process, the ID of the customer with which the tax accountant is currently working, and other information related to the current invoices.
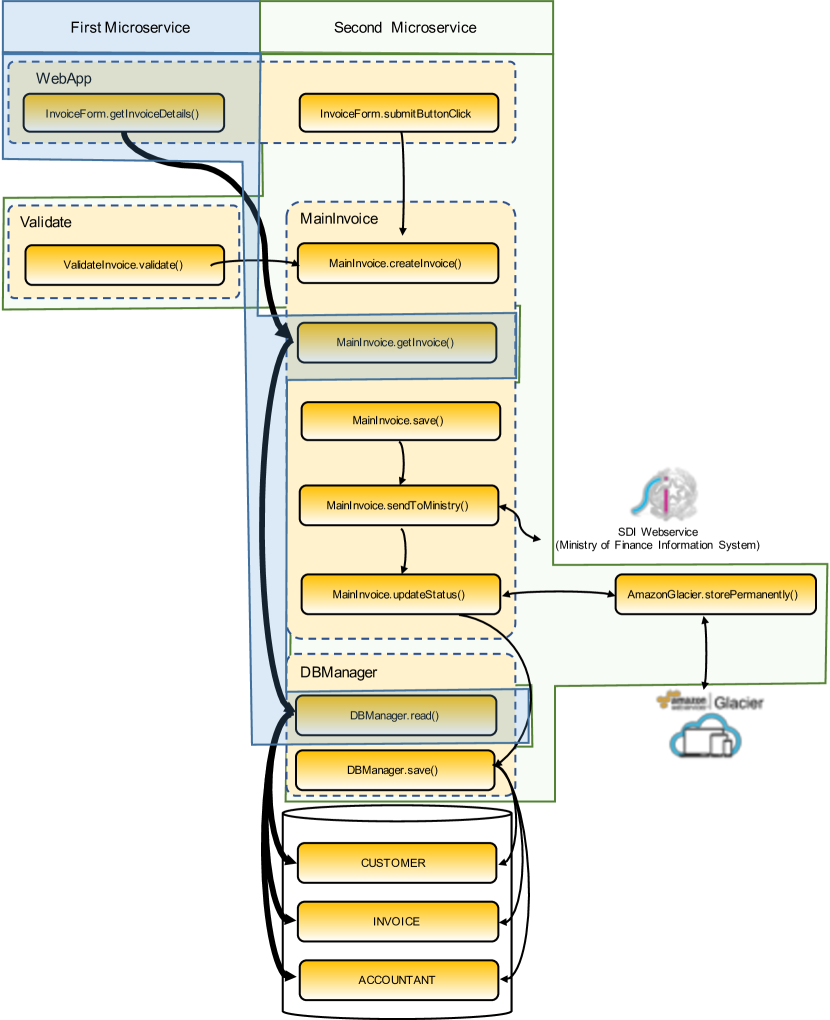
From this information, we identified 39 different business processes with DISCO. For confidentiality reasons, we can only disclose a high-level and anonymized portion of the system. Figure 7 depicts an example of two business processes (save invoice and view invoice). We then calculated the frequency of each process. DISCO can automatically draw thicker arcs between processes, thereby simplifying the approach.
Of 39 processes, three processes had been used only three times during one year of logging, 17 processes less than 1000 times, and 12 processes between 1000 and 10K times; five processes had been used more than 60B times. This distribution was initially expected for most of the processes. The most frequently used processes were due to the submission of the invoices from each tax accountant.
| MS | Decomposition Solutions | |||||||||||
|---|---|---|---|---|---|---|---|---|---|---|---|---|
| Solution 1 | Solution 2 | Solution 3 | ||||||||||
| CBM | #Links | #Classes | #Dupl. Classes | CBM | #Links | #Classes | #Dupl. Classes | CBM | #Links | #Classes | #Dupl. Classes | |
| MS1 | 0.08 | 6 | 75 | 2 | 0.26 | 7 | 27 | 0 | 0.13 | 5 | 39 | 2 |
| MS2 | 0.29 | 9 | 31 | 4 | 0.33 | 11 | 33 | 2 | 0.26 | 7 | 27 | 0 |
| MS3 | 0.08 | 2 | 25 | 0 | 0.06 | 2 | 33 | 1 | 0.33 | 10 | 31 | 4 |
| MS4 | 0.16 | 7 | 43 | 2 | 0.08 | 4 | 50 | 3 | 0.17 | 7 | 41 | 3 |
| MS5 | 0.17 | 5 | 30 | 0 | 0.18 | 10 | 56 | 0 | 0.14 | 4 | 28 | 0 |
Based on the previous step, the software architect, together with the project manager, identified three slicing options, taking care to avoid circular dependencies between services, especially in the case of the three classes that suffered from an existing circular dependency. Therefore, we proceeded with the calculation of cohesion and coupling of the different slicing options. The CBM was counted from the outgoing calls reported in the output of DISCO tool.
The first solution was composed of 25 microservices (19 classes duplicated) with an average CBM of 0.16; the second solution was composed of 27 microservices (21 classes duplicated) with an average CBM of 0.16; while the third solution was composed of 21 microservices (14 classes duplicated) with an average CBM of 0.22. Table 6 shows the measures collected for five microservices of each decomposition solution.
The first initial result is the list of classes, methods, and database tables used in the different processes together with their frequency of usage. Moreover, the solution proposed by the software architect had higher coupling and was more complex than the ones identified with the process-mining approach. The analysis of log files also shows that some processes were used much more than expected while one process traverses an unexpected set of classes performing an incorrect process. Moreover, they also discovered three unexpected circular dependencies and the presence of two harmful code smells [TaibiJL17].
One of the most important decision drivers that lead to the selection of one of the three identified solutions, was the type of decomposition. One of the selected decomposition options proposed to slice the system based on the need of creating more shared libraries. Shared libraries commonly increase the complexity of the migration, and increase the maintenance complexity. The other reason was related to the developer’s knowledge and the code ownership. The selected solution allowed to split the systems reducing the need of re-organizing the teams and re-allocating the responsibility of the code. The developers preferred to migrate the code they have written in the past, instead of migrating the code written by other developers.
5 Discussion
In this work we proposed a decomposition process to slice monolithic systems into microservices based on their runtime behavior.
The main benefit of analyzing runtime information is the availability of the data on the usage of each component, together with the dynamic analysis of dependencies. We identified several dead methods and classes that were never used at runtime and we also spotted some cyclic dependencies. The static analysis of dependencies would have spotted the circular dependencies but not all the dead code. Moreover, thanks to the information obtained from the frequency of usage of each method, we also better understood which feature is used more, we prioritized the development and the slicing of the monolithic system differently. Without the information on the frequency of usage of methods, we could have created a microservice that would have done most of the computational tasks.
We are aware about possible threats to validity. We tried to reduce them by applying a common process mining tool (DISCO), that has been developed for several years and has been adopted by several companies and universities. However, the tool could have identified some processes incorrectly. Moreover, we are aware about the complexity related to the data collection, since to adopt our process, companies need to instrument their code to collect the log files at the method level. About the generalizability of the results, the validation case study was based on an analysis of the processes of one company. The project manager and the software architect had a limited experience decomposing systems into microservices but the authors of this paper have more than four years of experience in supporting companies in decomposing systems into microservices and closely followed them during the migration.
Companies could benefit from our lessons learned, by applying this process to decompose their monolithic system, but also monitoring the runtime behaviors or existing microservices to continuously understand possible issues. However, despite this approach being very beneficial in our company, the results could have a different impact on other companies. Researchers can benefit from this approach and extend it further. New optimization metrics could be defined, and in theory, it would be possible to propose an automated decomposition approach that would identify the slices by maximizing the metrics identified. Genetic algorithms could be a possible solution for this idea.
6 Conclusion
The decomposition of monolithic systems into microservices is a very complex and error-prone task, commonly performed manually by the software architect.
In our work, we demonstrated the usefulness of existing process-mining approaches for decomposing monolithic systems based on business processes identified from the process-mining approach.
Our goal is not to create a tool to support the automated slicing, but to provide an extra support to software architect, to help them in identifying different slicing options reducing the subjectivity.
We first proposed a simple process-mining approach to identify business processes in an existing monolithic solution based on three steps. In the first step, a process-mining tool (DISCO or similar) is used to identify the business processes. In the second step, processes with common execution paths are clustered and a set of microservices is proposed based on business processes with similar behavior, paying attention to not include circular dependencies. In the third step, we propose a set of metrics to evaluate the decomposition quality.
We validated our approach in an industrial case study. The software architect of the SME together with the project manager identified a decomposition solution and asked our consultancy to assess it and to identify other possible decomposition options. This enabled us to compare our process-mining approach with the decomposition solution they proposed.
As a result, we found that our process simplified the identification of alternative decomposition solutions, and provided a set of measures for evaluating the quality of the decomposition. Moreover, our process-mining approach keeps track of the classes and methods traversed by each process, which does not only help to identify business processes but also makes it possible to discover possible issues in the processes, such as unexpected behavior or unexpected circular dependencies.
In case log data is available, or in case it is possible to collect logs, we highly recommend that companies planning to migrate to microservices should use it, considering the very low effort needed to identify alternative solutions with our approach (less than two working days) and the possible benefits that can be achieved.
Future works include the development of a tool to facilitate the identification of the process, the automatic calculation of the metrics, and identification of other measures for evaluating the quality of the decomposition. We are also planning to further empirically validate this approach with other companies and to include dynamic measures for evaluating the quality of the system at runtime [LenarduzziECISM2017] [TosiDynamic]. In the future, we are also planning to adopt mining software repositories techniques to identify the areas that changed simultaneously in the past, to help developers to understand pieces of code connected to each other.
Another possible future work is to include identification of partial migration, i.e., migration of a limited set of processes from a monolithic system. Finally, we are also considering to extend this work by proposing not only different decomposition options but also a set of patterns for connecting microservices based on existing common microservices patterns [Newman2015] [TaibiCLOSER] and anti-patterns [TaibiIEEEsw][TaibiBOOK].