What Determines the Sizes of Bars in Spiral Galaxies?
Abstract
I use volume- and mass-limited subsamples and recently published data from the Spitzer Survey of Stellar Structure in Galaxies (S4G) to investigate how the size of bars depends on galaxy properties. The known correlation between bar semi-major-axis and galaxy stellar mass (or luminosity) is actually bimodal: for , bar size is almost independent of stellar mass (), while it is a strong function for higher masses (). Bar size is a slightly stronger function of galaxy half-light radius and (especially) exponential disc scale length (). Correlations between stellar mass and galaxy size can explain the bar-size– correlation – but only for galaxies with ; at higher masses, there is an extra dependence of bar size on itself. Despite theoretical arguments that the presence of gas can affect bar growth, there is no evidence for any residual dependence of bar size on (present-day) gas mass fraction. The traditional dependence of bar size on Hubble type (longer bars in early-type discs) can be explained as a side-effect of stellar-mass–Hubble-type correlations. Finally, I show that galaxy size ( or ) can be modeled as a function of stellar mass and both bar presence and bar size: barred galaxies tend to be more extended than unbarred galaxies of the same mass, with larger bars correlated with larger sizes.
keywords:
galaxies: structure – galaxies: bulges – galaxies: spiral1 Introduction
The majority of massive disc galaxies in the local universe possess stellar bars (e.g., Erwin, 2018, and references therein), which are important for understanding the evolution of disc galaxies for a number of reasons. The mere presence of a bar can be taken as an indication of certain key developments in galaxy evolution, such as the appearance of dynamically cool discs (e.g., Sheth et al., 2012). Bars themselves have also been implicated as possible – even essential – mechanisms for the quenching of star formation in discs (e.g., Gavazzi et al., 2015; Spinoso et al., 2017; Khoperskov et al., 2018), the growth of pseudobulges, transformations of dark matter halos (e.g., Weinberg & Katz, 2002; Holley-Bockelmann et al., 2005; Weinberg & Katz, 2007; Dubinski et al., 2009), and the source of variations in the – correlations of supermassive black holes (e.g., Brown et al., 2013).
The simplest, least ambiguous, and most easily measured characteristic of bars is their size. (Other important characteristics, such as “strength” and rotational pattern speed, are harder to define unambiguously or much more difficult to measure.) Models of bar evolution can make at least semi-quantitative predictions about how much bars should grow after they form, depending on factors such as the gas content of discs and the degree of interaction with dark-matter halos. For example, a number of studies have shown that bars can slow down and grow in length, especially if they exchange angular momentum with bulges and dark-matter halos (e.g., Hernquist & Weinberg, 1992; Debattista & Sellwood, 1998, 2000; Athanassoula, 2002, 2003; Algorry et al., 2017). The latter effect can in turn significantly reshape the halos.
Conversely, several models have found that even moderate amounts of gas in discs (e.g., gas mass % of the disc mass) can lead to delayed bar formation and slower growth (e.g., Berentzen et al., 1998, 2007; Bournaud et al., 2005; Villa-Vargas et al., 2010; Athanassoula et al., 2013), in part because bars can gain angular momentum from gas located within corotation, with the gas driven in towards the center of the galaxy, possibly fuelling bulge or pseudobulge growth and nuclear activity. These studies suggest that, all other things being equal, we might expect shorter bars in more gas-rich galaxies, either because the bars formed more recently and have had less time to grow, or because their growth has been reduced or suppressed. (Of course, there is the complicating factor of how much present-day gas content might or might not reflect the gas content several Gyr ago, when the bar was forming or (trying) to grow.)
Finally, the sizes of bars turn out to be important for interpreting studies of bar frequency in large samples, including those at intermediate and high redshifts. This is for the simple reason that physically smaller bars are harder to detect at larger distances. If there are differences in bar sizes as a function of some host-galaxy parameter, then differential visibility may produce a false signal of differential bar presence. In Erwin (2018, hereafter Paper I), I argued that just such an effect was responsible for claims of low bar frequencies – and a bar frequency that monotonically decreased to lower masses – in most large, SDSS-based samples. Specifically, if bar size correlates with stellar mass (as indeed it does; Section 3.1), then in resolution-limited samples, bars will be more easily detected in higher-mass galaxies, and will thus appear to be less common in lower-mass galaxies than is actually the case. I also pointed out that this could affect attempts to measure bar frequency as a function of redshift, since constant-angular-resolution images (e.g., from Hubble Space Telescope observations in a given filter) potentially make it harder to detect bars at higher redshifts.
The preceding argument about bar size and bar detectability in imaging studies was made in part by looking briefly at the trend of bar size with stellar mass in the S4G sample (e.g., Section 4.2 of Paper I), but also by simply using the S4G sample as an empirical “parent distribution” for simulating SDSS-based (and high-redshift) surveys. In this paper, I return to the question of how bar size relates to galaxy parameters in a more general sense, by looking more carefully at how bar size in the S4G sample does (or does not) depend on stellar mass, galaxy size (half-light radius ), disc size (exponential scale length ), gas mass fraction, and Hubble type.
After reviewing the definition of the S4G-based sample and the additional data sources I use in Section 2, I discuss the strong – and curiously bimodal – dependence of bar size on stellar mass in Section 3.1, followed by discussions of the (even stronger) dependence on galaxy size and (strongest of all) on disc size in Section 3.2. Since galaxy and disc size are correlated with stellar mass, Section 3.3 looks at the question of whether any of these individual bar-size relations are merely side effects of the stellar-mass–galaxy/disc-size correlation. The answer, interestingly, is that both galaxy size and stellar mass help determine bar size: more massive galaxies have larger bars than less massive galaxies of the same size. Section 4 turns to the issue of whether bar size is related to (present-day) gas content or Hubble type, finding no evidence for any correlation of bar size with either of those parameters – once their correlations with stellar mass are corrected for. Finally Section 6 discusses some implications for models of bar and disc formation, and Section 7 summarizes things.
To aid in reproducibility, there is a Github repository containing data files, code, and Jupyter notebooks for creating the figures and fits from this paper; the repository is available at https://github.com/perwin/s4g_barsizes and also at https://doi.org/10.5281/zenodo.86151029.
2 Sample and Data Sources
The best local sample for assessing general bar properties is the Spitzer Survey of Stellar Structure in Galaxies (S4G; Sheth et al., 2010), both because of its size and because of its use of near-infrared imaging, which minimizes the possibility of missing or mismeasuring bars due to the confusion introduced by dust extinction and star formation. Díaz-García et al. (2016a) defined a subsample of non-edge-on disc galaxies, which takes the version of S4G with morphological classifications by Buta et al. (2015) and then removes both elliptical galaxies and disc galaxies with inclinations – the second step being crucial for maximizing the detectability of bars – leaving a total of 1344 galaxies. Ten galaxies are missing distances and stellar masses in Muñoz-Mateos et al. (2015), and an additional twelve have very uncertain distances (redshifts of with no alternate distance measurements) and/or optical diameters smaller than the S4G limit. Removing these leaves a total of 1322 galaxies in what I call the Parent Disc Sample.
As discussed in Paper I, S4G suffers from incompleteness in three ways. First, since the sample is magnitude-limited, lower-luminosity (and thus lower-mass) galaxies drop out as the distance increases (see, e.g., Figure 1 of Paper I). I deal with this by adopting a distance- and mass-limited subsample, using galaxies with –11 and distances Mpc. S4G is also incomplete in terms of Hubble types – specifically, it is incomplete when it comes to S0 galaxies (and ellipticals), since H i radial velocities were used for determining whether or not galaxies met the redshift limit for the sample. (Additional Spitzer observations of gas-poor elliptical and S0 galaxies have been made – e.g., Knapen et al. 2014 – but the relevant analysis of these galaxies is not yet publicly available.) The simplest way to deal with this is to exclude the S0 galaxies and concentrate on spirals (and the small number of irregulars in the sample). The end result is the Parent Spiral Sample (623 galaxies), with a total of 387 barred galaxies. (The Parent Spiral Sample is equivalent to “Sample 2m” in Paper I, except that the latter included galaxies with .) The identification of galaxies as barred or unbarred is based on the classifications and measurements of Buta et al. (2015) and Herrera-Endoqui et al. (2015); see Section 2.1.1.
As explained below, I use galaxy size measurements – half-light radius and exponential disc scale length – from the 2D decompositions of Salo et al. (2015). These do not exist for all the galaxies in the Parent Spiral Sample, so for most of the comparisons, I use a subset containing those galaxies which do have valid and measurements; this is the Main Spiral Sample (588 galaxies), with 367 barred galaxies making up the Main Barred Spiral Sample. A summary of the various samples and subsamples is given in Table 1.
| Name | Notes | ||
|---|---|---|---|
| Parent Disc | 1322 | 744 | |
| Parent Spiral | 623 | 387 | , –11 |
| Main Spiral | 588 | 367 | valid and only |
The main samples used in this paper. The Parent Disc Sample is based on the low- and moderate-inclination disc-galaxy subsample of S4G defined by Díaz-García et al. (2016a). The Parent Spiral Sample is a subset with distances Mpc and –11. The Main Spiral Sample excludes galaxies which do not have valid and measurements; see Section 2 for more details.
2.1 Data Sources
Details for most of the data sources are given in Paper I; I summarize things briefly here. Distances and stellar masses are taken from Muñoz-Mateos et al. (2015),111These distances are based on redshift-independent NED distances for 79% of the total sample, and on Hubble-flow distances for the rest, assuming Mpc-1. overall galaxy orientations (disc position angles and inclinations) are from Salo et al. (2015), and bar-size and position-angle measurements are from Herrera-Endoqui et al. (2015). Atomic (hydrogen) gas masses are based on systematized Hyperleda H i measurements; both the Parent and Main Barred Spiral Samples are about 99% complete in terms of H i measurements.222The gas masses do not include any corrections for helium or metals.
2.1.1 Bar and Galaxy Sizes
Bar sizes for S4G barred galaxies (as identified by Buta et al., 2015) were measured by Herrera-Endoqui et al. (2015). These include multiple different measures of bar size; I use their “visual” semi-major axes , since these are available for all the barred galaxies, while other measurements are missing for some galaxies based on factors such as low S/N or strong star-formation in the images. (Note that Díaz-García et al. 2016a find that the and maximum-ellipticity-based sizes are consistent for galaxies that have both.) Since deprojected sizes are given in Herrera-Endoqui et al. 2015 only for galaxies with ellipse-fit measurements, I derive a consistent set of intrinsic bar sizes by deprojecting the measurements using their bar position angle values and the disc position angles and inclinations from Muñoz-Mateos et al. (2015).
To help in the comparison of different fits, I assume a constant fractional uncertainty of 10% for bar sizes (0.044 in logarithmic terms). As a partial justification for this, I note that Hoyle et al. (2011) found that different GZ2 participants reproduced each other’s (visual) bar measurements to %.
Finally, I use two galaxy size estimates, both from the 2D fits to the S4G 3.6µm images by Salo et al. (2015). The first is a global half-light radius that comes from single-Sérsic fits. The second is an exponential-disc scale length from their multi-component fits. When multiple exponential components were used in the fit, I take the largest scale length. (As noted above, there are a total of 588 galaxies with both and measurements, making up the Main Spiral Sample.)
3 The Sizes of Local Bars in S4G
3.1 Bar Size as a Function of Stellar Mass
The oldest association between bar size and galaxy properties is the observation that bar size scales with galaxy luminosity, as originally pointed out by Kormendy (1979). It makes sense to assume that such a correlation reflects a more fundamental correlation with galaxy stellar mass, and Díaz-García et al. (2016a) demonstrated this was indeed the case for S4G galaxies (see their Fig. 20 and Table 5).
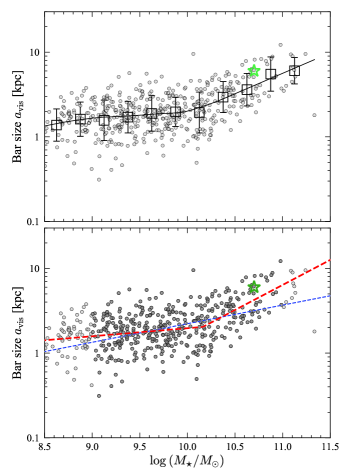
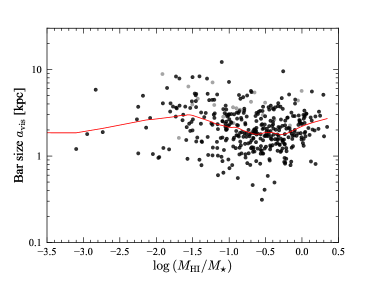
Figure 1 shows how (deprojected) bar size behaves as a function of stellar mass for S4G galaxies in the Parent Barred Spiral Sample. Close inspection suggests the trend actually has a bimodal quality: bar size is almost constant (but increases slightly with stellar mass) for stellar masses , and then increases more rapidly for higher masses.333This can also be seen in the bottom panel of Fig. 20 of Díaz-García et al. (2016a). In the upper panel of Figure 1, I include the result of a LOESS (locally weighted regression) fit to the data (using the code of Cappellari et al., 2013; Cappellari, 2014) as a thin black line. (This fit is inevitably biased near the ends of the distribution, because there are fewer galaxies with masses below or above the limits.) This reinforces the suggestion that the trend is bimodal: almost flat for , then changing to a steeper linear relation for higher masses. (I also include in this figure a point for the Galaxy’s bar, which can be seen to have a length quite typical for a galaxy of its stellar mass.) There is no systemic variation in the spread of bar size as a function of stellar mass; the error bars in the upper panel of Figure 1 indicate that the standard deviation of binned bar size does not change systematically from low to high mass.
A simple way to quantify this bimodality is to fit the bar-size–stellar-mass relation with a broken power law – or, equivalently, a broken-linear relation in the – plane. This can be expressed as the following (with in kpc and in solar masses):
| (1) | |||||
The constraint that the two linear pieces should match at means that one of the parameters can be expressed in terms of the others: e.g., . I fit this function to the data using a simple least-squares minimization technique (the curve_fit function from the Python scipy.optimize package; Jones et al. 2001).
The results of fits to the Parent and Main Spiral Samples are listed in Table 2; the uncertainties on the best-fit parameter values come from 2000 rounds of bootstrap resampling. Both fits agree that the “break mass” is –10.2, with a slope of for lower masses and for higher masses. The dashed red line in the lower panel of Figure 1 shows the fit using data from the Main Spiral Sample.
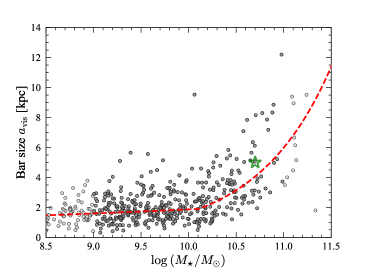
For an order of magnitude increase in galaxy mass, from to , the typical bar increases only % in semi-major axis, from to kpc. But for larger masses, the bar size increases dramatically (): the typical bar in a galaxy has a semi-major axis of kpc. Figure 2 illustrates this increase by showing linear bar size as a function of stellar mass.
| Sample | ||||
|---|---|---|---|---|
| (1) | (2) | (3) | (4) | (5) |
| Parent Spiral | ||||
| Main Spiral |
Results of broken-linear fits to as a function of (see Eqn. 1; parameter ). Parameter uncertainties are based on 2000 rounds of bootstrap resampling.
| Predictor | ||
|---|---|---|
| (1) | (2) | (3) |
Results of linear fits to bar size as a function of and . Parameter uncertainties are based on 2000 rounds of bootstrap resampling.
| Sample | |||||
|---|---|---|---|---|---|
| (1) | (2) | (3) | (4) | (5) | (6) |
Results of fits to as a function of both and or . Parameter uncertainties are based on 2000 rounds of bootstrap resampling. (The parameter in Eqn. 4 can be derived from the parameters listed here.)
3.2 Bar Size as a Function of Galaxy Size: Half-light Radius and Disc Scale Length
A number of studies have suggested that bar size is proportional to galaxy size, whether the latter is measured in terms of isophotal radius (e.g., ), half-light radius , or exponential disc scale length () – although there is also evidence that this scaling may vary with, for example, Hubble type or stellar mass (Laine et al., 2002; Erwin, 2005; Menéndez-Delmestre et al., 2007; Marinova & Jogee, 2007; Laurikainen et al., 2007; Aguerri et al., 2009; Díaz-García et al., 2016a). Since galaxy size clearly scales with galaxy mass (see, e.g., Shen et al. 2003; Muñoz-Mateos et al. 2015; Lange et al. 2015, as well as Section 5 and Figure 9), it is plausible that the correlation between bar size and stellar mass found in the previous subsection could be an indirect one that reflects a more fundamental correlation between bar and galaxy size (or bar and disc size).
I consider two different (though related) measurements of galaxy “size”. The first is the galaxy half-light or effective radius , based on the fits of single, elliptical Sérsic functions to the S4G 3.6µm images by Salo et al. (2015). The second is the disc exponential scale length from the multi-component (usually disc + bulge or disc + bar + bulge) 2D fits of the same study. Since bars form out of, and can also reshape, galaxy discs, we can a priori expect bar size to be more directly related to than to . We can also expect some scatter from the fitting process, as not all barred galaxies have well-defined single-exponential outer discs, and even 2D decompositions that incorporate bars may be biased by lenses, rings, mismatches between models of bars and real galaxies, and so forth.
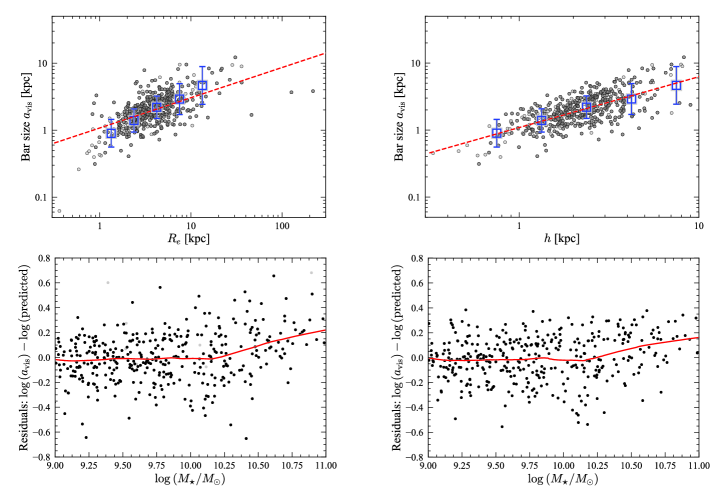
The upper panels of Figure 3 show plots of bar size against galaxy half-light radius (upper left panel) and disc scale length (upper right panel). Also plotted are linear fits of as a function of or :
| (2) | |||||
| (3) |
The best-fit parameter values and uncertainties are listed in Table 3.
The top panels of Figure 3 show clear, strong correlations between bar size and galaxy size; the correlation appears to be tighter when disc scale length is used. (The binned mean values suggest that the - relation may become nonlinear at high and low – though the numbers become somewhat sparse – while the - relation appears consistently linear over the whole range of .) Are these correlations stronger than the previously observed bar-size–stellar-mass correlation? Table 5 compares the relative performance of the various fits in two ways. First, assuming uniform 10% errors on the bar sizes, I compute the likelihood of the fits and then the Akaike Information Criterion (AIC) values for each fit. Lower AIC values indicate relatively better fits, with differences of AIC > 10 usually regarded as clear evidence in favor of the fit with lower AIC.
Second, I estimate the mean squared prediction error () for each fit using bootstrap validation (e.g., Hastie et al., 2009). This means generating a new dataset by bootstrap resampling from the original dataset and then fitting the function to the bootstrapped data. The data points which were not included in the bootstrapped data set are then used to compute residuals using the bootstrap fit, storing the mean of the squared residuals from this comparison. This is repeated 1000 times, and the mean of the accumulated mean-squared residual values is computed; this is . The smaller the , the better job a particular type of fit does at predicting bar sizes.
As Table 5 shows, the correlations between bar size and galaxy size are better than the bar-size– correlation, both in terms of lower AIC values and lower values. (The same basic result can be seen in Table 5 of Díaz-García et al. 2016a, where the Spearman correlation coefficient for different ranges of Hubble type is always higher when or is the covariate than when is.) Furthermore, the bar-size– fit is clearly superior to the bar-size– fit: bar size correlates better with the disc scale length than with the galaxy half-light radius. Since bars originate from disc instabilities, this is (as noted previously) to be expected.
3.3 Bar Size as a Function of Multiple Parameters
The previous section showed that the correlation between bar size and galaxy size (either or ) is stronger than the correlation with stellar mass. Even when the – relation is fit with a broken-linear function, the linear fits for as a function of or (especially) are better, with smaller predicted residuals (upper part of Table 5).
So is the correlation between bar size and stellar mass merely a side effect of the bar size–galaxy size correlation? After all, galaxy size has long been known to correlate with galaxy luminosity and mass. In fact, the galaxy size-mass relations in Figure 9 show a (weak) break at , with steeper slopes at larger stellar masses for both and . So it would seem possible that the real correlation is therefore just that between bar size and galaxy size, with mass playing no special role.
But this turns out to be only partly true. If we plot the residuals for the bar-size–galaxy-size fits against stellar mass (lower panels of Figure 3), we can see clear broken-linear trends, with the break at –10.2, very similar to the basic bar-size– trend (Figure 1). This suggests that the dependence of bar size on galaxy stellar mass is actually due to two factors: the linear444Linear, that is, in log space. relation between bar size and galaxy size (combined with the bimodal galaxy-size– relation) and an extra dependence of bar size on stellar mass.
This motivates looking at bar size as a function of multiple parameters. I do this by fitting the logarithm of bar size as a function of stellar mass (using the broken-linear dependence that was successful in Section 3.1) and either or :
| (4) | |||||
where or . (As in the case of Eqn. 1, one of the parameters can be expressed in terms of the others; e.g., ). The best-fit parameters are listed in Table 4, and the fits are compared with the previous, single-variable fits in Table 5. The AIC values in the latter table show that the multi-variable fits are better than any of the single-variable fits: the fit using both and stellar mass has AIC relative to the fit using just , while the fit using both and stellar mass has AIC relative to the fit using just . The MSE values are also lower for the multi-variable fits in both cases.
As suggested by the pattern of residuals in the bottom panels of Figure 3, which cluster about zero for , the stellar-mass dependence is indeed bimodal, and in fact the slope of the mass dependence for is basically indistinguishable from zero (in Table 4, for the fit with , for the fit with ). This indicates that for galaxies with , the bar size really does depend on galaxy size ( or ) alone; only for more massive galaxies does an additional dependence on mass appear.
The best fit is clearly the one using both and : it has by far the lowest AIC value (AIC less than the next-best case) and the lowest MSE. Given the superiority of the single-predictor fit using compared to that using , this result is not surprising. I do note that the fit using and may often be easier to apply than the – fit, since values can be obtained by simple Sérsic fits to galaxy profiles or images (or by curve-of-growth methods), while disc scale lengths require careful multi-component decompositions and may be more difficult to achieve for small, low-resolution images.
| Predictor(s) | AIC | |
|---|---|---|
| (linear) | 8520.0 | 0.046 |
| (broken-linear) | 7870.1 | 0.042 |
| 7328.8 | 0.039 | |
| 6242.2 | 0.033 | |
| 10794.1 | 0.058 | |
| (broken-linear) | 6203.6 | 0.034 |
| (broken-linear) | 5583.5 | 0.030 |
Comparison of fits of different models for logarithmic bar size in kpc. Fits were done to barred galaxies in the Main Spiral Sample (galaxies with –11 and valid and values). (1) Predictor variable(s). (2) Corrected Akaike Information Criterion value for fit; lower values indicate better fits. (3) Mean squared prediction error for log of bar size (kpc), based on 1000 rounds of bootstrap validation.
4 Possible Correlations with Other Parameters
4.1 Gas Mass Fraction
A number of theoretical studies have suggested that bar formation and growth may be retarded by a sufficiently high gas mass fraction (e.g., Berentzen et al., 1998, 2007; Bournaud et al., 2005; Villa-Vargas et al., 2010; Athanassoula et al., 2013). The models suggest that this should generally be an anti-correlation, with higher gas mass fractions associated with shorter bars.
Whether the gas mass fraction observed at the present day correlates well – or at all – with the fraction during bar formation and growth is unclear, since gas can be consumed (and also expelled) by star formation, stripped by tidal interactions or ram pressure, etc., which would convert a gas-rich galaxy into a gas-poor galaxy. Nonetheless, it is possible that a weak correlation could still exist at ; the simulations of Athanassoula et al. (2013), which included star formation, seem to suggest that the gas mass fractions are correlated with their initial fractions (see the discussion in Section 6.1).
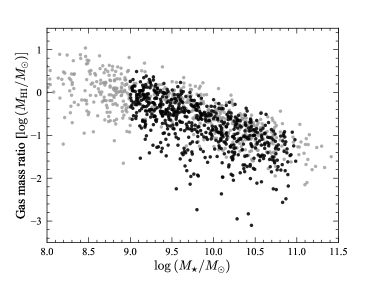
Figure 4 shows how bar size depends on gas mass fraction in the S4G galaxies. There is at first glance a suggestion of an overall trend in accord with the predictions: more gas-rich galaxies do tend to have smaller bars.
The problem with this idea is that the gas mass fraction is rather strongly anti-correlated with stellar mass (e.g., Figure 11), so we could just be seeing a side effect of the latter relation. The fact that the trend in Figure 4 is clearly weaker than the trends of bar size with stellar mass (Figure 1) and with galaxy size (Figure 3) – and that the trend is possibly not even monotonic – suggests that this might be the case. Moreover, the fit of bar size versus (see Table 5) is clearly worse than all of the other fits in terms of AIC, which makes it less likely that is a key factor in explaining bar size.
It is still possible that gas fraction could explain some of the variance in the other fits – i.e., gas fraction might correlate with deviations from the bar-size–stellar-mass or bar-size–galaxy-size fits. Figure 5 explores this by showing, as a function of gas fraction, the residuals from the fits of bar size as a function of stellar mass and galaxy size (either or ) from Table 4. There is very little correlation: galaxies with bars which are larger or smaller than what is typical for their stellar mass and size are not systematically gas-rich or gas-poor (Spearman correlation coefficient , ). There is perhaps a weak turn-up for very gas-rich galaxies (), but this is actually in the opposite sense from what models have suggested: very gas-rich galaxies tend to have slightly larger bars.
A potential issue is the fact that I have only considered atomic gas content (from H i observations) for the S4G spirals; molecular gas is not being counted. However, observations suggest that molecular gas is typically only –30% of the atomic gas mass in –11 spirals, and is more abundant relative to atomic gas in higher-mass galaxies (e.g., Boselli et al., 2014). This would actually make the disagreement with theory worse: the true gas mass fractions should generally be larger in precisely those galaxies which have larger bars.
I conclude that bar size has no significant relation to (present-day) gas mass fraction.

4.2 Hubble Type
Most studies of bar sizes have tended to focus on trends with Hubble type, either in very broad general terms – “early-type” versus “late-type” disc galaxies – or in finer detail (e.g., Elmegreen & Elmegreen, 1985; Martin, 1995; Erwin, 2005; Menéndez-Delmestre et al., 2007; Díaz-García et al., 2016a). In Erwin (2005), for example, I argued that bars in Hubble types Sc–Sd were systematically smaller than bars in S0–Sab galaxies, by a factor of roughly two.
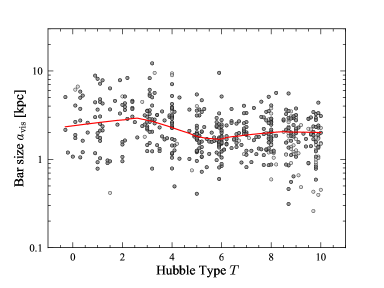
But comparison of Figure 6 – which shows S4G bar size versus Hubble type555Hubble types are taken from the S4G main catalog and are ultimately from the HyperLEDA database (http://leda.univ-lyon1.fr/). – with the trends of bar size versus stellar mass or (especially) versus galaxy size (Figures 1 and 3) shows that there the trend of bar size with Hubble type is quite weak.666For example, the Spearman correlation coefficient for barred galaxies in the Main Spiral Sample is 0.56 () for bar size versus stellar mass and 0.61 () for bar size versus disc scale length, but only () for bar size versus Hubble type.
This trend does reproduce the known tendency for early-type spirals to have somewhat larger bars than later-type spirals (mean kpc for S0/a–Sb versus kpc for Sc and later). But it is quite possible that this trend could simply be a side effect of the strong correlations between Hubble type and stellar mass (and between Hubble type and galaxy size): late-type spirals tend to be lower mass and smaller. The question then becomes: are there any residual trends of bar size with Hubble type once the stellar-mass and galaxy-size dependence of is taken care of?
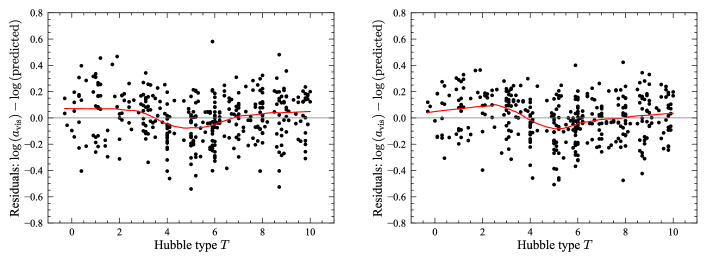
Figure 7 plots residuals from the fits of bar size to the combination of stellar mass and galaxy size ( or ) versus Hubble type . For galaxies with –11, the Spearman correlation coefficients for the bar-size residuals are and ( and 0.87) for the -based and -based fits, respectively. There is thus no evidence for a systematic dependence of bar size on Hubble type, once the underlying correlation with stellar mass is accounted for (apart from some evidence for a minimum in bar size for ).
5 Connections Between Bar Presence, Bar Size, and Galaxy Size: Using Bars to Predict Galaxy Sizes
In Sections 3 and 4, I looked at the degree to which global galaxy properties – total stellar mass, size, gas content, Hubble type – could explain (or, more properly, predict) the sizes of bars in barred galaxies. The strongest individual relation is clearly that between galaxy size and bar size.
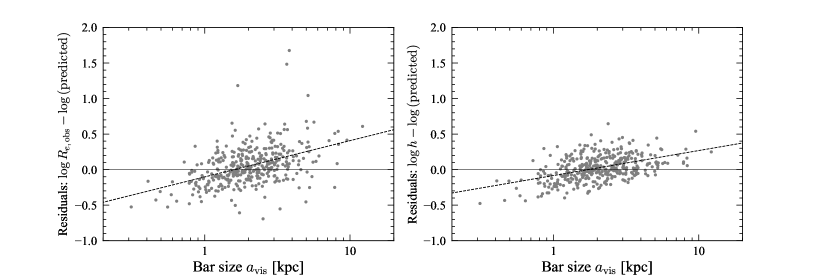
This relation implies a trivial inversion: we can, in principle, use bar size to predict galaxy size. Evidence for this is shown in Figure 8, which plots residuals of galaxy size ( or ) from broken-linear fits to the –stellar-mass and –stellar-mass relations (see Appendix A) versus bar size. For both and there is a clear trend: galaxies with larger bars have larger half-light and disc sizes, even when stellar mass is accounted for.
A related implication is the possibility that galaxy size might also depend on the mere presence of bars. Are galaxies with bars systematically larger (or smaller) than galaxies without bars? Because simulations of bar formation and growth often show accompanying changes to the stellar distribution, it is possible to argue that part of the connection between bar size and galaxy size is due to bars driving changes in galaxy size, rather than the other way around.
There is already evidence that the presence or absence of bars does correlate with galaxy size, in the sense that a galaxy with a bar is more extended than a galaxy of the same mass without a bar. Sánchez-Janssen & Gadotti (2013) found, for a sample of massive, face-on SDSS galaxies with 2D bulge/bar/disc decompositions, that barred galaxies had disc scale lengths larger than unbarred galaxies of the same mass. More recently, Díaz-García et al. (2016b) presented plots of stacked galaxy stellar surface-mass-density profiles, derived from S4G data, divided into different mass and Hubble-type bins, and also into barred versus unbarred subsets. At least for galaxies with , the profiles of barred and unbarred galaxies with similar masses differ (see their Figure 5 and 6): barred galaxies have disc profiles which are shallower and more extended than unbarred galaxies with similar masses.
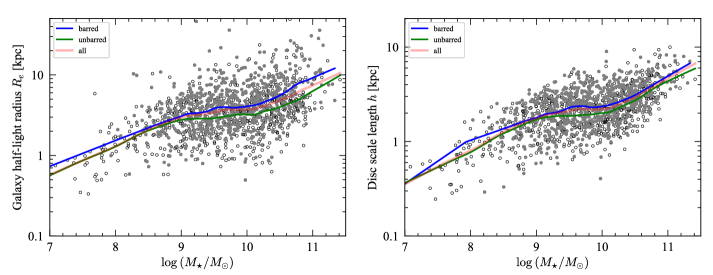
We can see this effect in the global and disc size measurements for the S4G galaxies. Figure 9 shows how galaxy size ( or ) depends on stellar mass for the main S4G spiral sample considered in this paper. Also plotted are LOESS fits to the data for all galaxies (light red line), for barred galaxies (blue line), and for unbarred galaxies (green line). The fit lines show that barred galaxies are, on average, slightly larger than unbarred galaxies of the same stellar mass, and that this is true over most of the mass range – certainly for (at smaller masses, the number of barred galaxies drops off and the barred-galaxy fit line becomes unreliable).
Taken together, this suggests that galaxy size can be considered a function of both bar size and bar presence: galaxies with bars tend to be somewhat larger than unbarred galaxies, and galaxies with big bars tend to be larger than galaxies with small bars. We can express this general dependence in simple form as follows:
| (5) | |||||
| (6) |
where is the broken-linear dependence modeled in Section 3.2 and is a binary variable, which is 0 for unbarred galaxies and 1 for barred galaxies. The results of fitting these relations to the data are shown in Table 6. For both and , including bar presence/size leads to significantly better fits (e.g., AIC to ).
| Predictor(s) | AIC | MSEpred | ||||||
| (1) | (2) | (3) | (4) | (5) | (6) | (7) | (8) | (9) |
| Relation for | ||||||||
| … | … | 22930.8 | 0.077 | |||||
| 18426.2 | 0.062 | |||||||
| Relation for | ||||||||
| … | … | 10038.8 | 0.034 | |||||
| 8258.2 | 0.028 | |||||||
Fits of logarithm of galaxy half-light size or disc scale length (kpc) for all galaxies in the Main Spiral Sample (both barred and unbarred) as a function of stellar mass and (optionally) bar size. The first fit in each case is a broken-linear function of (as in Eqn. 1); the second fit includes an additional linear function of bar size (see Eqn. 5). (1) Type of fit. (2)–(7) Best fit parameter values and uncertainties (from 2000 rounds of bootstrap resampling). (8) Corrected Akaike Information Criterion value for fit (smaller values indicate better fits). (9) Mean squared prediction error for log of galaxy size ( or , kpc), based on 1000 rounds of bootstrap validation.
6 Discussion
6.1 The Size and Presence of Bars Does Not Depend on (Present-Day) Gas Fraction
A number of theoretical studies have suggested that a high gas mass fraction in disc galaxies can delay bar formation and also limit secular bar growth after formation. For example, Villa-Vargas et al. (2010) found that final bar sizes were more than 50% smaller in simulations with (initial) gas fractions of % versus those with gas fractions %; they did note that their simulations did not include star formation, which might in principle alter these results. The simulations of Athanassoula et al. (2013) looked at the effects of halo shape and initial gas fraction (ranging from 0 to 100%) on bar formation and growth, for model galaxies with a fixed baryonic mass of . These simulations did include star formation, and the final gas fractions were in fact roughly an order of magnitude smaller than the initial fractions. Nonetheless, the final fractions were correlated with the initial values (e.g., their Fig. 2 and Table 2). Although the focus in that study was on bar strength rather than size, their Figs. 4 and 5 clearly indicate that simulations with higher initial gas fractions tend to end up with shorter final bar sizes, so there should be a correlation between bar size and gas fraction.
But observationally (Section 4.1), there is effectively no connection between the present-day gas fraction and bar size. In Paper I (Section 6.1), I showed that the mere presence of bars in S4G does not depend on present-day gas fraction either, even when the strong dependence of bar fraction on stellar mass is accounted for. If, as simulations suggest, gas fraction does significantly affect bar formation and growth, then this relation must somehow be completely absent by .
6.2 Which Way(s) Does the Arrow of Causality Point?
As shown previously, the best single-parameter correlation is that between bar size and disc scale length, and the best multi-parameter correlation for bar size is with the combination of stellar mass and disc scale length.
At first glance, this suggests that the bar size–disc size correlation is the most fundamental one. One can easily imagine a direct causal relation between disc size and bar size: bars are disc phenomena, forming out of the disc, and thus larger discs naturally give rise to larger bars.
This may not be the whole story, however. Numerous simulations have found that bar formation and growth redistribute stars (and gas) in the disc, typically leading to an increase in the disc scale length (e.g., Hohl, 1971; Valenzuela & Klypin, 2003; Debattista et al., 2006). This raises the possibility that bar and disc sizes are coupled by a feedback process, so that the growth in bar size is potentially one of the causes of disc size growth. The fact that galaxy size is partly dependent on the mere presence of a bar (Sánchez-Janssen & Gadotti 2013; Section 5) – that is, galaxies with bars have, on average, more extended discs – is consistent with this idea.
Nonetheless, it is important to note that the broken-power-law correlation between galaxy size ( or ) and stellar mass exists for unbarred galaxies as well as for barred galaxies (e.g., Figure 9). This seems to be true even for the poorly sampled low-mass end (e.g., in Figure 9), where the bar fraction becomes quite low. Unless the majority of today’s unbarred galaxies were previously barred, this implies that the fundamental size-mass relation of galaxies is not driven by bar formation or evolution.
This leads me to suggest that a possible causal hierarchy might be something like the following:
-
1.
Some general process of galaxy formation and evolution sets the trends of galaxy (and especially disc) size as a function of stellar mass, as seen in Figure 9. When bars form, they inherit their size primarily from the disc size, resulting in (over the mass range of –11, at least) the bar-size–stellar-mass correlation seen in Figure 1.
-
2.
The formation and growth of bars causes, in turn, an increase in galaxy size, one which is (at least approximately) proportional to the growth in bar size.
We are, admittedly, still left with the puzzling fact that bar size apparently also correlates with stellar mass to a certain degree independently of its correlation with disc size (Section 3.3), something that cannot be accounted for with the preceding argument.
6.3 So, What Does Determine Bar Size?
One possibility is that we are seeing a temporal effect: more massive galaxies formed cool disks earlier, so they became bar-unstable and formed their bars earlier (as suggested by, e.g. Sheth et al., 2012; Kraljic et al., 2012), and thus they have had more time for their bars to grow in length. Observations using HST have generally indicated that the frequency of bars at higher redshifts is larger in the most massive galaxies. In this scenario, the highest-mass galaxies in the local Universe would tend to have unusually large bars because their bars have had the most time to grow in size. The main problem (in addition to the suspicion that galaxy formation might not be coordinated enough in time across all environments) is that it’s unclear why this should only be true for galaxies with or greater – why have all the bars in lower-mass galaxies not had any time to grow in size? It is somewhat hard to believe that this is because they have all formed so recently that they haven’t had time to grow; after all, the bar fraction is highest for (Erwin, 2018).
7 Summary
This paper has presented an analysis of how the sizes (deprojected semi-major axis ) of bars depend – or do not depend – on their host galaxy properties: specifically, how bar size relates to stellar mass, galaxy size (half-light radius or exponential-disc scale length ), atomic gas content, and Hubble type.
A strong correlation exists between bar size and galaxy stellar mass, as has long been noted (usually using galaxy luminosity rather than stellar mass). However, this correlation is actually bimodal, with a very shallow relation for low-mass galaxies () which steepens rather abruptly () for stellar masses with .
Bar size also correlates strongly with galaxy size, with the strongest correlation being with disc scale length: , . Both correlations are stronger than the correlation with galaxy mass. However, even though the bar-size–galaxy-size correlation can partly explain the bar-size–galaxy-mass correlation (because galaxy size itself correlates with stellar mass, with more massive galaxies being more extended), there is still a residual correlation with stellar mass itself.
More precisely, for lower-mass galaxies (), bar size depends on galaxy size only. For higher-mass galaxies, stellar mass also matters: given two galaxies with the same size, the galaxy with higher mass will tend to have a longer bar. Thus, a better general predictor of bar size is the combination of galaxy size and stellar mass.
Once the correlations with galaxy size ( or ) and stellar mass are accounted for, bar size shows essentially no residual correlation with either atomic gas mass fraction () or Hubble type. The first result is perhaps in conflict with theoretical arguments suggesting that high gas fractions can either delay bar formation or slow the growth of bar sizes, or both, although it is unclear how well or poorly present-day gas content should correlate with prior gas content (i.e., during the time of bar formation and growth). The second result indicates that classic arguments for different bar sizes as a function of Hubble type (e.g., Elmegreen & Elmegreen, 1985; Martin, 1995; Erwin, 2005) appear to be side effects of the general tendency of later Hubble types to be smaller and lower in mass than early-type spirals.
Finally, I note that bars can be used as predictors of galaxy size. This is not only true for barred galaxies – at constant mass, galaxies with larger bars have, on average, larger and – but also reflects the fact that barred galaxies as a class tend to be more extended than unbarred galaxies of the same mass.
Acknowledgments
I would like to thank Victor Debattista for numerous helpful discussions at various stages of this project, Martin Herrera-Endoqui for answering questions about the S4G measurements, Adriana de Lorenzo-Cáceres and Jairo Méndez Abreu for careful reading of an earlier version, and the referee for various interesting comments and suggestions.
This work is based in part on observations made with the Spitzer Space Telescope, obtained from the NASA/IPAC Infrared Science Archive, both of which are operated by the Jet Propulsion Laboratory, California Institute of Technology under a contract with the National Aeronautics and Space Administration. This paper also makes use of data obtained from the Isaac Newton Group Archive which is maintained as part of the CASU Astronomical Data Centre at the Institute of Astronomy, Cambridge.
This research also made use of Astropy, a community-developed core Python package for Astronomy (Astropy Collaboration et al., 2013).
References
- Aguerri et al. (2009) Aguerri J. A. L., Méndez-Abreu J., Corsini E. M., 2009, A&A, 495, 491
- Algorry et al. (2017) Algorry D. G., et al., 2017, MNRAS, 469, 1054
- Astropy Collaboration et al. (2013) Astropy Collaboration et al., 2013, A&A, 558, A33
- Athanassoula (2002) Athanassoula E., 2002, ApJL, 569, L83
- Athanassoula (2003) Athanassoula E., 2003, MNRAS, 341, 1179
- Athanassoula et al. (2013) Athanassoula E., Machado R. E. G., Rodionov S. A., 2013, MNRAS, 429, 1949
- Berentzen et al. (1998) Berentzen I., Heller C. H., Shlosman I., Fricke K. J., 1998, MNRAS, 300, 49
- Berentzen et al. (2007) Berentzen I., Shlosman I., Martinez-Valpuesta I., Heller C. H., 2007, ApJ, 666, 189
- Boselli et al. (2014) Boselli A., Cortese L., Boquien M., Boissier S., Catinella B., Lagos C., Saintonge A., 2014, A&A, 564, A66
- Bournaud et al. (2005) Bournaud F., Combes F., Semelin B., 2005, MNRAS, 364, L18
- Brown et al. (2013) Brown J. S., Valluri M., Shen J., Debattista V. P., 2013, ApJ, 778, 151
- Buta et al. (2015) Buta R. J., et al., 2015, ApJS, 217, 32
- Cappellari (2014) Cappellari M., 2014, CAP_LOESS_1D & CAP_LOESS_2D: Recover mean trends from noisy data, Astrophysics Source Code Library
- Cappellari et al. (2013) Cappellari M., et al., 2013, MNRAS, 432, 1862
- Debattista & Sellwood (1998) Debattista V. P., Sellwood J. A., 1998, ApJ, 493, L5
- Debattista & Sellwood (2000) Debattista V. P., Sellwood J. A., 2000, ApJ, 543, 704
- Debattista et al. (2006) Debattista V. P., Mayer L., Carollo C. M., Moore B., Wadsley J., Quinn T., 2006, ApJ, 645, 209
- Díaz-García et al. (2016a) Díaz-García S., Salo H., Laurikainen E., Herrera-Endoqui M., 2016a, A&A, 587, A160
- Díaz-García et al. (2016b) Díaz-García S., Salo H., Laurikainen E., 2016b, A&A, 596, A84
- Dubinski et al. (2009) Dubinski J., Berentzen I., Shlosman I., 2009, ApJ, 697, 293
- Elmegreen & Elmegreen (1985) Elmegreen B. G., Elmegreen D. M., 1985, ApJ, 288, 438
- Erwin (2005) Erwin P., 2005, MNRAS, 364, 283
- Erwin (2018) Erwin P., 2018, MNRAS, 474, 5372
- Gavazzi et al. (2015) Gavazzi G., et al., 2015, A&A, 580, A116
- Hastie et al. (2009) Hastie T., Tibshirani R., Friedman J., 2009, The Elements of Statistical Learning: Data Mining, Inference, and Prediction, 2nd Ed.. Springer Series in Statistics, New York: Springer
- Hernquist & Weinberg (1992) Hernquist L., Weinberg M. D., 1992, ApJ, 400, 80
- Herrera-Endoqui et al. (2015) Herrera-Endoqui M., Díaz-García S., Laurikainen E., Salo H., 2015, A&A, 582, A86
- Hohl (1971) Hohl F., 1971, ApJ, 168, 343
- Holley-Bockelmann et al. (2005) Holley-Bockelmann K., Weinberg M., Katz N., 2005, MNRAS, 363, 991
- Hoyle et al. (2011) Hoyle B., et al., 2011, MNRAS, 415, 3627
- Jones et al. (01 ) Jones E., Oliphant T., Peterson P., et al., 2001–, SciPy: Open source scientific tools for Python, http://www.scipy.org/
- Khoperskov et al. (2018) Khoperskov S., Haywood M., Di Matteo P., Lehnert M. D., Combes F., 2018, A&A, 609, A60
- Knapen et al. (2014) Knapen J. H., Erroz-Ferrer S., Roa J., Bakos J., Cisternas M., Leaman R., Szymanek N., 2014, A&A, 569, A91
- Kormendy (1979) Kormendy J., 1979, ApJ, 227, 714
- Kraljic et al. (2012) Kraljic K., Bournaud F., Martig M., 2012, ApJ, 757, 60
- Laine et al. (2002) Laine S., Shlosman I., Knapen J. H., Peletier R. F., 2002, ApJ, 567, 97
- Lange et al. (2015) Lange R., et al., 2015, MNRAS, 447, 2603
- Laurikainen et al. (2007) Laurikainen E., Salo H., Buta R., Knapen J. H., 2007, MNRAS, 381, 401
- Marinova & Jogee (2007) Marinova I., Jogee S., 2007, ApJ, 659, 1176
- Martin (1995) Martin P., 1995, AJ, 109, 2428
- Menéndez-Delmestre et al. (2007) Menéndez-Delmestre K., Sheth K., Schinnerer E., Jarrett T. H., Scoville N. Z., 2007, ApJ, 657, 790
- Muñoz-Mateos et al. (2015) Muñoz-Mateos J. C., et al., 2015, ApJS, 219, 3
- Salo et al. (2015) Salo H., et al., 2015, ApJS, 219, 4
- Sánchez-Janssen & Gadotti (2013) Sánchez-Janssen R., Gadotti D. A., 2013, MNRAS, 432, L56
- Shen et al. (2003) Shen S., Mo H. J., White S. D. M., Blanton M. R., Kauffmann G., Voges W., Brinkmann J., Csabai I., 2003, MNRAS, 343, 978
- Sheth et al. (2010) Sheth K., et al., 2010, PASP, 122, 1397
- Sheth et al. (2012) Sheth K., Melbourne J., Elmegreen D. M., Elmegreen B. G., Athanassoula E., Abraham R. G., Weiner B. J., 2012, ApJ, 758, 136
- Spinoso et al. (2017) Spinoso D., Bonoli S., Dotti M., Mayer L., Madau P., Bellovary J., 2017, MNRAS, 465, 3729
- Valenzuela & Klypin (2003) Valenzuela O., Klypin A., 2003, MNRAS, 345, 406
- Villa-Vargas et al. (2010) Villa-Vargas J., Shlosman I., Heller C., 2010, ApJ, 719, 1470
- Wegg et al. (2015) Wegg C., Gerhard O., Portail M., 2015, MNRAS, 450, 4050
- Weinberg & Katz (2002) Weinberg M. D., Katz N., 2002, ApJ, 580, 627
- Weinberg & Katz (2007) Weinberg M. D., Katz N., 2007, MNRAS, 375, 460
Appendix A Galaxy Scaling Relations
In Figure 10 I show the general size-mass scaling relations for the entire S4G spiral sample (grey symbols); LOESS fits to the Mpc subsample are shown with red lines. Galaxies in the Main Spiral Sample are plotted using black symbols. For both and , there is a consistent trend: a steep relation for low masses (), a shallow trend for higher masses, and then steeper again for .
Since the Main Spiral Sample is restricted to stellar masses of –11, I also show the result of a broken-linear fit (in log space) to that data using a dashed blue line; these fits were done in a fashion very similar to the broken-linear fits (for bar size) in Section 3.1. The best-fit coefficients are , , , and for the – relation and , , , and for the – relation
The – trend appears to be roughly consistent with local size-mass relationships as plotted for S4G in Muñoz-Mateos et al. (2015), along with trends for SDSS (Shen et al., 2003) and GAMA (Lange et al., 2015). The – trend clearly has less scatter. This may be due to the higher accuracy of 2D fits that include multiple components, as opposed to forcing galaxies with multiple components to be fit with a single Sérsic function.
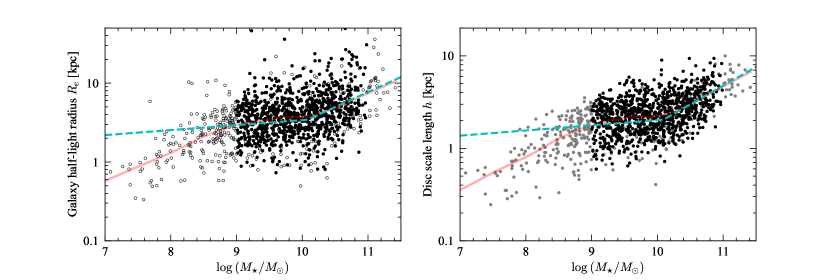
Figure 11 shows the correlation between gas mass fraction and stellar mass for the S4G spiral galaxies.