∎
Electroweak-QCD interference in hadronic vector bosons decays at the LHC
Abstract
The analysis of hadronic vector bosons decays at the LHC does not normally consider interference with QCD production. This paper explores the effect of this interference on the reconstructed peak positions and rates for several production modes. In particular, boosted vectors bosons and vector boson pairs are considered for the first time. Shifts of several GeV/c2 are seen in the positions of the and boson’s peaks, with a magnitude that depends strongly on the kinematics involved. For boosted vector bosons in regions currently studied, the effects are all found to be very small or negligible. If experiments were to access lower transverse momenta, for example in the experimental trigger systems, or in studies of low-recoil decaying semileptonically, the effect of interference could be much larger.
1 Introduction
This paper presents a study of interference effects between electroweak production of hadronic vector bosons and QCD background at the LHC. Such effects are neglected in the simulation strategy generally adopted by the LHC experimental collaborations, where vector bosons are simulated independently from QCD. The goal of this paper is test the validity of that approach. Early theoretical studies of interference ranft79 explored its impact on total and (collectively referred to here as ) cross-sections in and collisions at energies below 1 TeV/c. More details were explored theoretically at energies of 630 GeV/c and 1.8 TeV/c glover89 and these studies concluded that “effects caused by the interference between electroweak and QCD amplitudes must be taken into account when data are compared with theoretical predictions”. A shift in the masses of the resonance peaks of about 0.3 GeV/c2 was noted and it was also observed that this effect was increased by experimental resolution. First evidence for hadronic vector boson decay was shown in 1990 by UA2 in two-jet decays Alitti:210698 , using 4.66pb-1 of sps data. This result allowed for a 2.2 GeV mass shift in the experimental peak position from interference, based on Ref. glover89 . Pumplin PhysRevD.45.806 considered hadronic vector boson observation at the Tevatron as a mass calibration channel and remarked that interference causes a shift in mass of approximately 0.35 GeV/c2 downwards. All of these studies were concerned with inclusive production at leading order in QCD. No experimental evidence for this inclusive process has been published by the LHC experiments.
There are several production modes of boosted hadronic vector bosons at the LHC. Baur baur:2006sn considered hadronic production, finding it to be at the order of 1% of the jet rate. Interest in hadronic vector bosons at the LHC was stimulated by the proposal to analyse boosted hadronic Higgs decays Butterworth:2008iy . Inclusive decays at high momentum have been used as a calibration in hadronic searches Aad:2019fbh ; Sirunyan:2019jbg . Both CMS and ATLAS have also used boosted decays as a method of validating techniques to search for highly boosted Higgs bosons decaying to the same final state PhysRevLett.120.071802 ; ATLAS-CONF-2018-052 . Recently, the ATLAS collaboration performed a cross-section measurement in the channel using 36 fb-1 of data Aad:2019wdr and this same channel has also been used to validate -tagging developments Aad:2680245 . None of these studies considered interference.
Semileptonic production provides experimentally accessible signals. For example, the discovery papers by ATLAS and CMS Aaboud:2018zhk ; Sirunyan:2018kst obtained clear evidence for the process, summing over , and . These searches used lower pT thresholds on the bosons than the inclusive ones discussed above, which it will be shown gives rise to larger interference effects.
The multiple distinctive features of top quark pairs allow the extraction of a clear hadronic boson signal, which has been used to validate jet performance CMS-PAS-JME-16-003 ; ATLAS-CONF-2016-008 and calibrate the top quark mass measurement Aaboud2019 ; Sirunyan2018 . A shift in the mass peak here could have a significant impact. This is considered briefly in the concluding section of this paper.
At this stage, it may be helpful to highlight an important point: if two amplitudes and contribute to a process, the cross-section is given by . If is the process under study and represents a background, then the fractional contribution of the interference term is at most . Thus, (fractional) interference effects are expected to scale inversely with the square-root of the signal-to-background ratio.
Simulations of several processes are studied at leading order using Sherpa Gleisberg:2008ta and the procedure is discussed in section 2. At higher order, there are additional effects that are important in the prompt production of heavy quark mesons at hadron colliders. This is especially evident in production, where at high pT even Next-to-Leading-Order QCD (NLO) calculations under-predict the rate by a factor of two Cacciari:2012ny . The OpenLoops Cascioli:2011va package was explored as an NLO generator, but no relevant states are currently interfaced to Sherpa. The results for the inclusive vector bosons, for comparison with previous literature, are given in section 3, and, in addition, the analysis methodology is introduced there. This is then applied to inclusive boosted and bosons in section 4, in section 5 and in section 6. Section 7 contains a discussion of the results and prospects for experimental verification.
2 Methodology
The results presented in this paper are obtained using the Sherpa 2.2.8 package with Photos Schonherr:2008av and normally the NNPDF3.0 Ball:2014uwa Parton Distribution Function (PDF) set, with MMHT2014nlo68cl Harland-Lang2015 used for certain studies. The Comix Gleisberg:2008fv matrix element generator is used throughout to generate leading order cross-sections. As such, -channel gluon-mediated processes are pure colour octets and do not interfere with vector bosons. Furthermore, the parton shower, hadronization and underlying event are mostly disabled to save computing time, so the resulting output is a small set of partons only. For a small number of examples, the parton shower is enabled and the DelphesMC deFavereau2014 simulation is employed, using the ‘ATLAS’ detector card to approximate the influence of a detector on the results. These cases require a jet treatment, discussed in section 3.1.1.
Sherpa uses the concepts of a ‘process’ and a ‘selector’. The process defines the initial and final state particles, with additional options such as defining intermediate states or the order of the electroweak coupling at the amplitude level. The aim of this paper is to study the resonant vector boson peaks, and their interference with the continuum background, but there is no simple way to include all non-resonant electroweak processes in the background. Instead, the three samples generated are a total, a background (which is referred to as QCD throughout), with the minimum electroweak order to reach the specified final state, and the electroweak signal, where two additional orders in the electroweak coupling are required corresponding to the creation and decay of an internal electroweak boson. So, for example, is generated at order one and order three in the electromagnetic coupling, though most states involve order zero and order two. The selector imposes kinematic selections on the outgoing particles. In this paper, the selectors applied are:
-
•
a mass window on the relevant quark-antiquark pair of 50 GeV GeV. This wide window enables studies involving the experimental resolution.
-
•
all final state particles must have a pT greater than 25 GeV/c. This mimics experimental selection and stabilises the Sherpa integration.
-
•
all charged objects must have . This mimics central detector acceptance and also serves to stabilise the Sherpa integration in some cases.
-
•
when studying boosted bosons, the quark-antiquark pair is required to pass a pT selection. In the case where there are three coloured objects in the final state, this requirement is instead placed on the leading one, which, at this matrix element level, has identical pT to the recoiling pair.
Simulation is done at 13 TeV centre-of-mass energy for proton-proton collisions. A full ‘Run.dat’ file defining one process can be seen in appendix A. Within this, it can be seen that the output is in hepMC format. DelphesMC is then used to reformat this into a file that can be processed by root 6.16 Brun:1997pa .
The analysis extracts the interference component as the QCD background and electroweak signal subtracted from the total and comparisons are made between the pure electroweak signal and the electroweak plus the interference term (). The invariant mass of the pair is examined. For processes where there are only two quarks in the final state, there is only one combination to form the invariant mass. However, for processes with a pair plus an extra quark in the final state, there are two possible combinations and both are considered.
3 Vector boson production at rest
In this section, the simplest case of and production with no recoil, , is considered. This mode shows clear interference effects and so is also used to check the impact of the selection, the experimental resolution and additional gluon radiation.
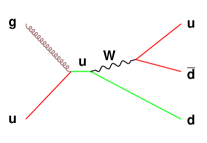
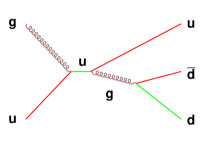
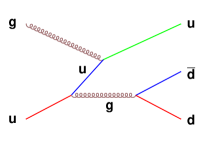
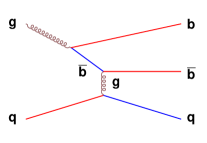
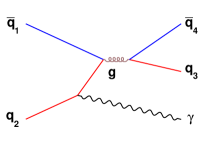
At leading order, or boson production can only proceed through quark-antiquark annihilation. The experimental background has large contributions from processes involving gluons in the initial or final state. However, interference only occurs between processes with identical initial and final states, so these background processes with gluons will not contribute. To study interference, it is sufficient to focus on . The total jet-jet cross-section is two orders of magnitude larger than the cross-section so this represents a considerable calculation simplification. Figure 1 shows the Feynman diagrams for the electroweak and QCD processes.
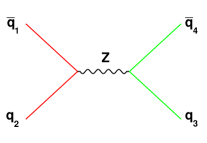
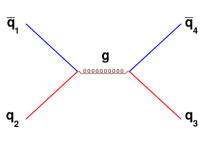
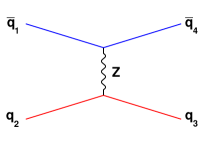
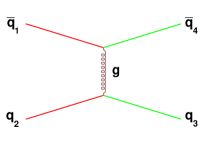
Only the -channel electroweak process produces a resonant mass signature in the final state and it is a colour-singlet. However, the similar -channel QCD diagram is a colour octet and, as a result, it does not interfere. This does not hold in general for the -channel gluon exchange process. Therefore, interference requires identical initial and final state particles. However, while the experimentalist has some possibility to distinguish final state quarks, all initial states must be included. This means, for example, that the -channel QCD diagrams for a final state are suppressed compared to the final state as a result of the relatively small quark PDF. Consequently, it is to be expected that the apparent interference is reduced for heavy quarks.
3.1 Inclusive production
To study production, the five final state quark-pairs are simulated separately. The differential cross-section for is shown in figure 2, with the QCD and electroweak channels compared with the combined process.
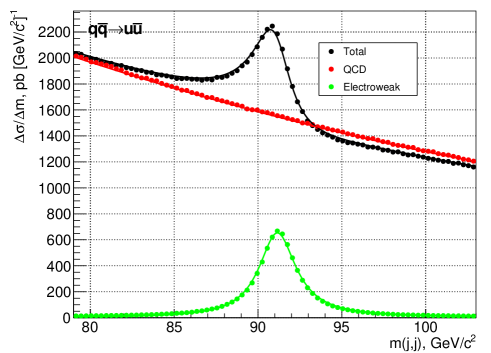
There are sizeable interference effects in the mass spectrum, with an enhancement below the peak and destructive interference above. These effects are largest about from the pole mass, but they also induce a small shift in the peak position. They are modelled using the sum of a relativistic Breit-Wigner function and an arbitrary constant amplitude:
| (1) |
In this formula, is the normalisation of the Breit-Wigner, is the invariant mass of the system, and are the particle mass and width, respectively. and are the coefficients of the real and imaginary amplitude components of an interfering background, respectively. This formula neglects variation in the interfering amplitude with mass. More importantly, in the identification of the and terms with the interfering part of the QCD contribution, it ignores -channel electroweak processes. The motivation for the dependence of the Breit-Wigner rate is heuristic.
The cross-section is not just , but has an additional term, , which is a non-interfering background component modelled with a second-order polynomial dependence on :
| (2) |
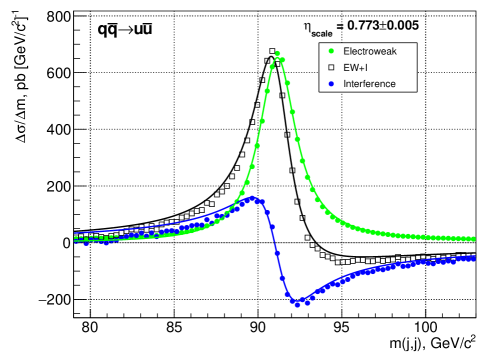
These nine parameters are simultaneously fit to the three distributions in figure 2 (left), with terms dropped for the partial distributions where they do not contribute. The extracted values are GeV/c2 (c/f 91.19 GeV/c2 used in simulation) and GeV/c2 (c/f 2.50 GeV/c2 used in simulation). The increase in with respect to the simulation is due to the fit attempting to describe the -channel exchange in the electroweak component.
The fit also finds and ; a sizeable real term and a significant imaginary one, which is not expected and is interpreted as being due to the -channel electroweak exchange. The size of the interfering QCD component is approximately one eighth of the total QCD contribution to at . The components of the fit are shown in figure 2 (right) and it can be seen that the approximate features are captured, but the limitations are clearly visible. The fit is informative, but due to the missing electroweak -channel, it is not quantitatively reliable and simpler methods are generally used for the rest of this paper.
A parameter, , characterising the scaling of the signal strength is defined as the integral of the component in a window of 10 GeV/c2 around the nominal mass, divided by the same integral for the electroweak term alone. This is the same as the definition of presented by the ‘New Physics’ Working Group Brooijmans:2018xbu , but the integration limits have been reduced from the window to one of 10 GeV/c2 which is comparable to the typical experimental resolution. This revised definition has less sensitivity to the -channel component. The other parameter extracted is the shift of the peak position. This is established by fitting a Gaussian to the observed data, in a mass range defined by the half-maxima of the distribution. The shifts in the peak positions due to interference are evaluated for all the decay modes and given in table 1.
| signal-to-background | 0.60 | 0.43 | 1.08 | 1.18 | 2.6 |
|---|---|---|---|---|---|
| Shift, GeV/c2 | 0.014 | 0.009 | 0.010 | 0.011 | 0.007 |
| 0.860.01 | 0.770.01 | 0.950.01 | 0.910.01 | 1.0090.003 |
The peak shift, averaged over the final state quark species, is -0.230.01 GeV/c2, similar to the GeV/c2 shifts reported in the previous work discussed in the introduction, but smaller with the higher beam energy, as expected. The magnitude of the effects falls as the quark mass rises, since the PDF density reduces, and so the non-interfering -channel QCD process becomes more dominant.
These shifts are for the theoretical peak in the cross-section. Estimating the expected change in the measured peak position requires allowing for detector resolution. This was discussed by the ‘New Physics’ Working Group PhysRevD.86.073016 , and Baur and Glover glover89 , where the latter adopted a 10% Gaussian smearing to approximate detector resolution effects. The same 10% is used here, noting that ATLAS found a mass resolution between 8% and 16% for boosted dijets with pT between 300 and 1000 GeV/c Aad:2019fbh and CMS shows between 7.5% and 10% for and from the decay of 1200 - 5000 GeV/c2 bosons Sirunyan:2019jbg .
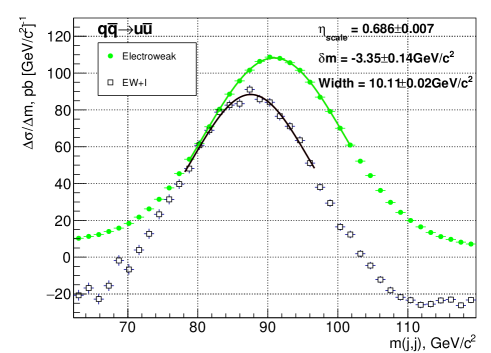
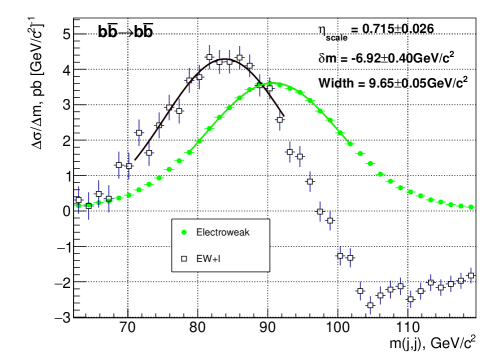
Figure 3 (left) shows that after smearing, the component is negative both above and below the peak, unlike what is seen in the original distribution, as the smearing makes the -channel contribution fractionally larger. The -channel imposes a decrease in differential cross-section across the mass spectrum, and effectively a baseline shift under the peaks. This gives rise to the reported reduction in , 0.69. If the background had been extracted from a fit to sideband data, this reduction in cross-section would not be seen. The fit to the electroweak alone yields good agreement with the mass, while the distribution is down-shifted by GeV/c2, as a result of the interference.
This can be compared with the shift in the peak position before smearing of GeV/c2 which shows the experimental resolution increases the shift by an order of magnitude. The larger number can be compared with the systematic error obtained by the experiments on jet energy scale, which in the best measured regions are around 1% Aaboud:2017jcu ; Khachatryan:2016kdb or even a little less. It can be seen that the use of vector boson resonances as a standard candle for mass scale is potentially problematic.
The analysis is repeated for only the subprocess where large effects are expected as the initial and final state quarks are identical. This finds a peak shift of GeV/c2, larger than any shift reported in table 1. This demonstrates that the small interference in the final state is because its initial state which is dominated by the non-interfering lighter-quarks. Figure 3 (right) shows the mass distribution for after smearing by 10%, where the change in the peak position is GeV/c2. Measuring this distribution would require knowledge of the initial state quarks, which is not experimentally accessible.
3.1.1 Variation of procedure
This section discusses the stability of the results presented above as the physics assumptions involved are varied.
The sensitivity of the peak position to the PDF uncertainties has been explored using the 50 PDF eigenvector variations of MMHT2014nlo68cl. 111Attempting to use the PDF variations of NNPDF30NNLO caused Sherpa termination for memory overflow on a 128 GB RAM computer. The quadratic sum of the resulting shifts in the peak position is 0.006 GeV/c2, corresponding to a 1.5% uncertainty on the shift. PDF uncertainties are therefore considered negligible.
Variation of the pT threshold used to select quarks in the process generation has also been studied. This was normally set to 25 GeV/c, but selections of 20 and 30 GeV/c have been investigated. The change in the pure electroweak cross-section is 10%, but for the QCD it is a factor of two at 90 GeV/c2. The effect is much larger for QCD because the -channel production tends to have large angular separation. Thus, lower pT thresholds enlarge the QCD sample in the kinematic region where the colour structure can interfere. The result is that the peak shift has quite a strong dependence on the pT selection, as seen in table 2.
| Quark pT | Inclusive | |||||
|---|---|---|---|---|---|---|
| threshold | cross-section | peak shift | cross-section | peak shift | cross-section | peak shift |
| 20 GeV/c | 1882 pb | GeV/c2 | 954 pb | GeV/c2 | 283 pb | GeV/c2 |
| 25 GeV/c | 1741 pb | GeV/c2 | 945 pb | GeV/c2 | 156 pb | GeV/c2 |
| 30 GeV/c | 1564 pb | GeV/c2 | 945 pb | GeV/c2 | 0.2 pb | n.a. |
The dependence of the mass shift on the between the quarks is also explored in table 2. It can be seen that for events where the quarks have similar , the pT threshold has little impact, while at large , where the pT can be lower, the threshold is much more important. Thus, the results have a significant dependence on the kinematic selection used.
The shift is also a function of the assumed resolution and a smearing width varying from 0% to 13% is tested in figure 4. This is compared with the shift extracted from convolving equation 2 with a Gaussian of variable width. The match is good, apart from a small offset, until the width reaches 10%, where the impact of the -channel interference, not included in the equation, becomes important.
The figure also shows the result of three progressively more complete ways of introducing resolution: allowing a parton shower, allowing a parton shower and an additional hard parton in the matrix element, and a full hadronization plus the use of Delphes detector simulation, with the ATLAS detector simulation employed. The resulting particles are all analysed using Delphes, with the anti-kt Cacciari:2008gp jet algorithm employed to order the resulting particles. The events are required to have precisely two jets above the 25 GeV/c pT threshold and, in the case of the Delphes simulation, the generator threshold is lowered to 15 GeV/c, with the reconstructed jets still required to exceed 25 GeV/c2, to allow for threshold effects. The two jets are required to be coplanar to 0.1 radians, which reduces events where a lot of energy is missed from the jet. Finally, in the two cases where Delphes was not used, a 10% detector smearing is applied to the mass.
The resulting peak widths are 12.0 GeV/c2 for the parton shower, 12.1 GeV/c2 with additional hard radiation and 10.20.2 GeV/c2 for the Delphes simulation. This happens to match almost exactly the width resulting from the 10% smearing applied to the quarks. The shift in the peak position is 3.910.28 GeV/c2 for the parton shower, 4.100.27 GeV/c2 for the parton shower plus possible hard jet, and 2.420.42 GeV/c2 for the Delphes events. These numbers can be visualised in figure 4 (left), which shows a generally consistent pattern, with the Delphes results somewhat higher. This has been traced to reduced acceptance for events from Delphes simulation at large , presumably because such events have a pT close to the acceptance threshold and can easily fall below it as a result. This is the region where the interference effects are larger, see table 2. 222These Delphes studies in particular consumed many thousands of CPU hours and over a hundred terabytes of disk.
The right hand side of figure 4 shows a comparison of no smearing, 10% smearing and parton shower plus Delphes for the case. A very similar pattern to the is seen, with the effects scaled down by a factor of six.
3.2 Inclusive production
Inclusive production is analysed in a manner very similar to the , but because the boson is charged it does not have any -channel QCD background. However, this background did not create interference in the case and so the actual effects observed are similar. Sherpa is run in its default form, with a diagonal CKM matrix, so the possible signatures are , , and . The peak shifts and scale changes are given in table 3.
| signal-to-background | 1.97 | 2.05 | 5.2 | 4.6 |
|---|---|---|---|---|
| Shift, GeV/c2 | -0.2870.005 | -0.2420.006 | -00960.005 | -0.0990.005 |
| 1.0180.003 | 1.0270.004 | 0.9950.002 | 1.0390.003 |
The shifts are found to be similar to, but smaller than, those in the case, and the reduction of the effects for second-generation quarks is clear, as was also the case for the boson.
4 Boosted vector bosons
This section describes the dominant boosted production modes, and . These modes have different interference properties, but experimentally, they are almost impossible to distinguish. Recoil against photons or other vector bosons is considered later.
Reference Aad:2019fbh used a pT selection of 600 GeV/c, but reference PhysRevLett.120.071802 clearly shows that an inclusive hadronic peak could be measured with a pT selection of 450 GeV/c. ATLAS and CMS used unprescaled jet trigger thresholds of approximately 400 GeV/c in run 2 at the LHC. In order to imitate the experiments, a pT threshold of 400 GeV/c is used as the default here. The extraction of a hadronic boson signal experimentally often relies on -quark identification to reduce QCD backgrounds suppress the larger peak, so this is given particular attention here.
4.1 Inclusive Boosted
The processes requested for are , or . It is required that there is a quark pair with a mass of 50 to 150 GeV/c2, and as none of the diagrams allow for two identical quarks this is unambiguous. In addition, at least one of the partons must have a pT above the 400 GeV/c threshold. In general, this means that the highest pT parton is recoiling against the pair.
Sample Feynman diagrams are shown in figure 5. It is an amusing feature of the QCD process in the centre that the colour label of the internal quark is transferred first to the gluon and then to the final quark. Thus there is a and pair that is a colour singlet in both the electroweak and this QCD diagram. This does not, however, apply to the right-hand diagram as the incoming gluon changes the colour structure.
The cross-sections of the electroweak process () are 0.11 pb for the process and 0.23 pb for the process in a 2 GeV/c2 window around the peak. The signal-to-background ratios at the peak of the resonance are very large, 115 and 681 respectively. This high signal-to-background ratio implies that interference effects must be small. Indeed, this is observed: the values of are 1.0040.002 for the process and 1.0000.002 for the process, and the corresponding mass shifts are 0.004 GeV/c2 and 0.0070.004 GeV/c2 respectively.
For the process, the interfering QCD diagrams have the same quark flavours in the initial and final state, much like the inclusive production. Therefore, interference effects will be smaller for than for , in the same way as described for production at rest. Conversely, for the process, only one of the final state quarks comes from the initial state and as a result, the suppression will not be as strong. The effects are so small because the -like quark pair in QCD must come from different vertices.
The analysis has been repeated with a threshold of 200 GeV/c, where the interfering QCD component is less suppressed. The signal-to-background ratios fall by a factor of four and the resulting peak shift for is 0.0110.005 GeV/c2, and for it is .004 GeV/c2. Thus, even for a threshold far below that currently employed for an unprescaled jet trigger, interference can be safely neglected.
4.2 Inclusive Boosted
The inclusive boosted production has many features in common with the , with possible recoil on a gluon, quark or antiquark considered. The channel is studied here and it is also compared with , which is expected to show larger interference. The simulation is very similar to the above, except that the pair of interest is either or . Unlike the case, two identical quarks can be produced, and as the Sherpa selector acts on all matching combinations, it is changed to require 50 GeV/c2 or more. If this had not been done, the joint requirements that one of the partons has a pT above 400 GeV/c and the upper mass cut on both pairs would together have eliminated like-quark combinations.
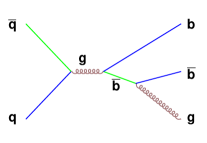
Sample Feynman diagrams are shown in figure 6. The rightmost diagram creates a colour singlet final state without requiring a quark in the initial state; there are other diagrams that produce a colour octet from gluon splitting. These are important differences from the case.
The signal-to-background ratios and peak shifts are given in table 4, where results for the are also included. The signal-to-background ratio is one to two orders of magnitude lower than for boosted production, so larger shifts might be seen, but most of this comes from gluon splitting. The largest shift is 0.022 GeV/c2, which after applying a 10% smearing produces a 0.18 GeV/c2 effect. This is negligible compared with the experimental systematic errors.
| Recoil | pT, | Boson | signal / | Peak shift | Boson | signal / | Peak Shift | ||
| particle | GeV/c | mode | background | GeV/c2 | mode | background | GeV/c2 | ||
| gluon | 400 | 9.3 | 1.0040.002 | 0.005 | 116 | 1.0000.002 | 0.004 | ||
| 21. | 0.9960.002 | 0.005 | |||||||
| 200 | 3.9 | 1.0220.032 | 0.005 | 29 | 0.9960.002 | 0.004 | |||
| 21. | 0.9960.002 | 0.004 | |||||||
| quark | 400 | 1.05 | 1.0160.009 | 0.007 | 680 | 1.0180.002 | 0.004 | ||
| 1.2 | 1.0230.007 | 0.007 | |||||||
| 200 | 0.91 | 0.9580.008 | 0.004 | 160 | 1.0040.002 | 0.004 |
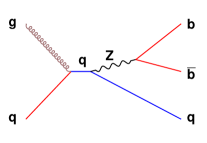
There is however one more thing which can potentially be measured in the state - the flavour of the outgoing quark. If a third jet is identified, then diagrams like the one in figure 6 (right) have enhanced possibilities for interference, as there are two combinations. Figure 7 shows the electroweak and contributions when the minimum jet pT requirement is reduced to 50 GeV/c.
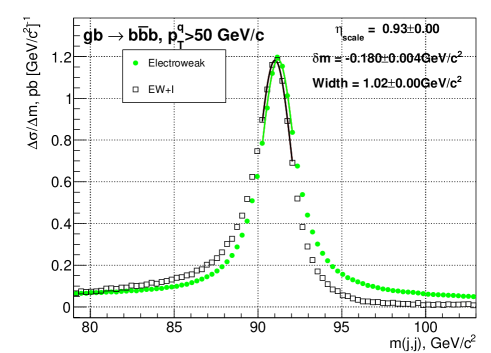
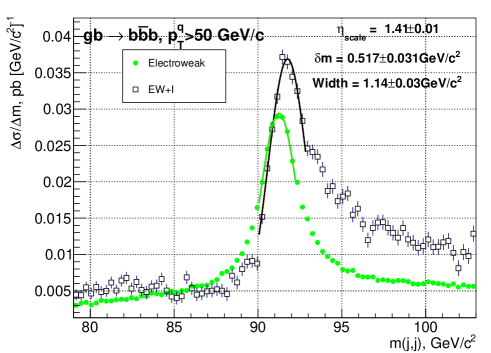
The pairs with similar pseudorapidity, , show a significant shift of GeV/c2 at parton level, which will correspond to a shift of more than a GeV/c2 after detector effects are considered, which is similar to energy scale systematic errors. However, those with a large separation show a dramatic effect, with a shift in the peak position of around GeV/c2. This would produce a shift of several GeV in a measured spectrum. This effect might be observable at the LHC. For example, the ATLAS collaboration in 2016 ATL-DAQ-PUB-2017-001 operated an unprescaled trigger requiring two b-jets and a third jet with thresholds of 65, 65 and 110 GeV/c2. If an analysis could be performed in the trigger system, or prescaled, it is conceivable that those thresholds could be halved.
5 + production
Studying hadronic vector boson decays recoiling against a photon has significant experimental advantages. Photons couple to charge, so the gluon background is suppressed. ATLAS analysed Aad:2019wdr , with a trigger on a single photon, an offline pT selection of 175 GeV/c, and a candidate pT threshold of 200 GeV/c. For the current leading order quark-level analysis, the pT of the and the photon are exactly equal, and 200 GeV/c is used as a benchmark for these processes. Sample Feynman diagrams are shown in figure 8, and results are given in this section for , , and quark combinations. As usual, the initial state of , which does not interfere with the electroweak process at leading order, is not included.
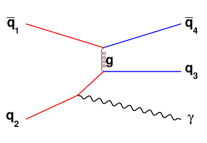
As always, the colour structure of -channel gluon production of the quark pair means it does not contribute to interference, although its rate is sizeable. The -channel gluon exchange diagram can interfere, but it preserves the quark species, so while it is important for , the small PDF suppress its contribution to the state.
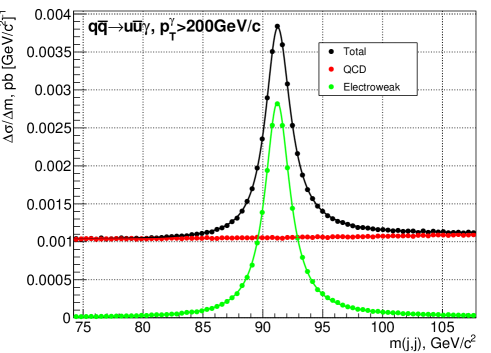
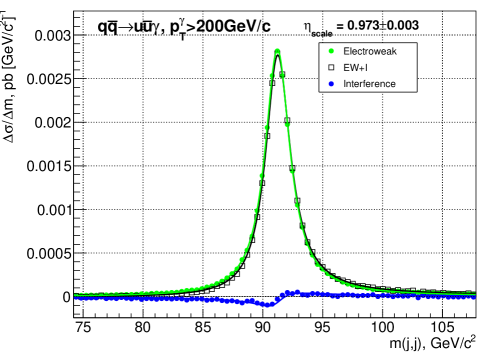
The case of is shown in figure 9. The signal-to-background ratio, on peak, is nearly 3:1, but the interfering fraction of the background, fitted as discussed in section 3, is only %. This is consistent with much of the background arising from colour octet gluon splitting. The relative phase of the background is reversed in comparison to the inclusive case, giving a positive shift to the mass peak. The fitted shifts in the peak position are given in table 5.
| Recoil | pT, | Boson | signal / | Peak shift | Boson | signal / | Peak Shift | ||
|---|---|---|---|---|---|---|---|---|---|
| particle | GeV/c | mode | background | GeV/c2 | mode | background | GeV/c2 | ||
| photon | 400 | 5.2 | 0.002 | 0.005 | |||||
| 10.9 | 0.002 | 0.004 | |||||||
| 200 | 2.7 | 0.003 | 0.005 | 35 | 0.002 | 0.004 | |||
| 9.7 | 0.002 | 0.004 | 666 | 0.002 | 0.004 | ||||
| 100 | 1.15 | 0.005 | 0.007 | ||||||
| 8.1 | 0.002 | 0.004 | |||||||
| 50 | 0.46 | 0.011 | 0.014 | 4.3 | 0.003 | 0.005 | |||
| 5.5 | 0.002 | 0.004 |
The shift is 0.045 GeV/c2, which, when smeared by 10%, moves the peak position by 0.260.06 GeV/c2. This is significantly below the roughly 1% experimental systematic errors on the mass scale. The shift in is only 0.008 GeV/c2, far below any observable effects.
A range of pT selections is explored, from 400 GeV/c down to 50 GeV/c. The magnitude of the shifts grow as the pT threshold is reduced. At 50 GeV/c the -channel electroweak exchange becomes important as evidenced by departing from 1. Figure 10 shows the differential cross-sections for the sub-processes and . There is a qualitative difference in the two processes which highlights the role of the -channel exchange that is only present in the process; however, both channels show clear interference. With the 50 GeV/c pT threshold requirement, the -channel exchange components contribute mostly for masses above the mass, and so too does the interference, which suppresses the high-mass cross-section by approximately 20%. It must be stressed that experimentally these two processes are indistinguishable.
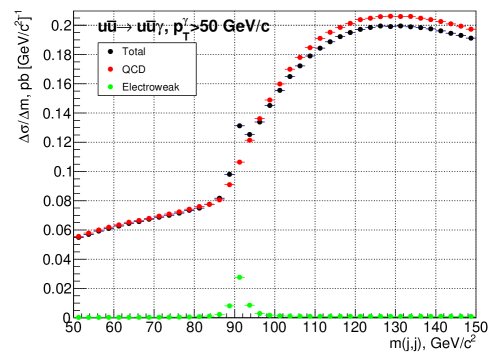
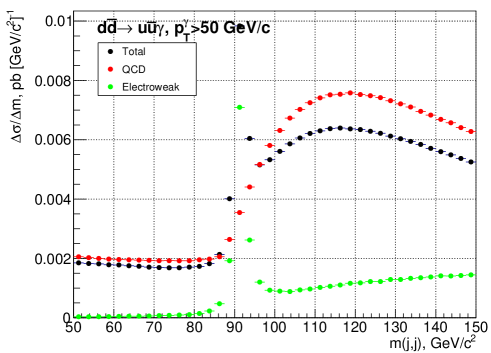
Overall, the interference effects in the channel are small, but in the experimentally accessed they are close to zero. Again, the quarks PDF suppresses the interfering background.
The channel is probably experimentally accessible, although there is no published study of the peak. However, as seen in table 5, the signal-to-background ratio is large, and the -channel interference is vanishingly small. In the same way as for the channel, at 50 GeV/c, a -channel electroweak component appears and complicates the picture.
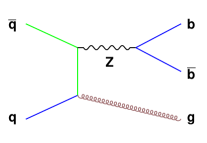
6 Vector boson associated production
An interesting alternative source of hadronic vector bosons is diboson production, with one of the bosons decaying leptonically. and decays are explored here, requiring that the leptonic decay involves muons. Such events are triggered efficiently by the LHC detectors, right down to zero recoil. All leptons, charged or neutral, are required to have a pT above 25 GeV/c and the angular selections on the muons is .
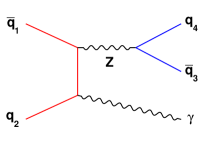
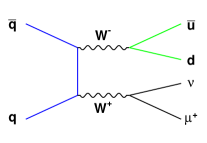
The background is similar to the previously-discussed modes with either -channel interaction via a colour-octet gluon state, or a -channel diagram in which, for , the final state inherits the flavours of the initial system. The two diagrams are shown on the right-hand side of figure 11 and, within the limitations of a diagonal CKM-matrix, only and initial states can exhibit the -channel process and thus interfere. The signal has many diagrams, involving one along with , or contributions, but the on-shell process sought has either a triple-boson vertex or two separate boson emissions, as shown in figure 11 (left).
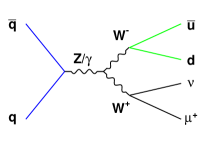
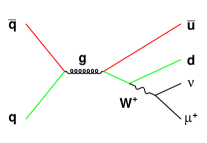
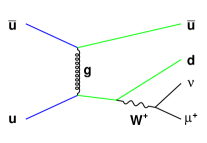
The phase of the two electroweak diagrams shown is opposite, and their relative importance depends upon the kinematics, as does the QCD contribution. The inclusive shift in the peak position in is GeV/c2, which is significantly smaller than that seen in the prompt production. However, it is dependent on the event kinematics. This is highlighted in figure 12, which shows (left) the relative phase space density and (right) the shift in the mean mass. The shift is calculated here by finding the mean mass of pairs within 2 GeV/c2 of 80 GeV/c2, and plotting the difference between the electroweak and the difference between total and QCD as follows:
| (3) |
This approach, calculating the deviation from the mean in a window, understates any deviation from zero, but the bias has been found to be small.
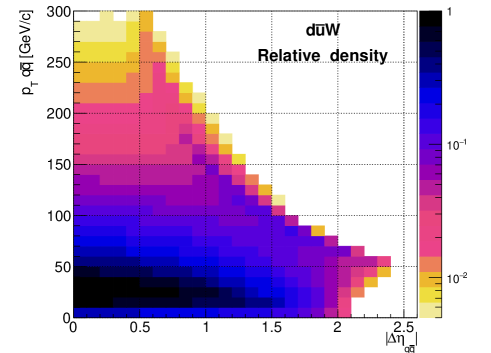
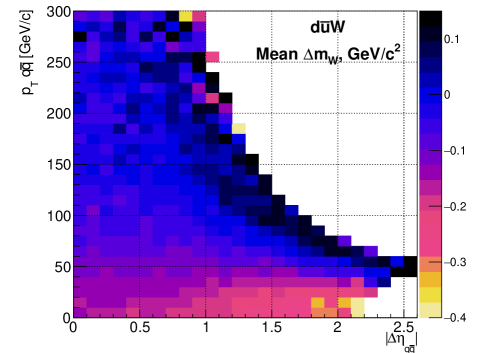
The most probable kinematics has roughly the shift of GeV/c2 found for the mean, but when there is a pseudorapidity difference of 1.5 or more between the quarks the shifts range from GeV/c2 at rest to GeV/c2 at recoil momenta approaching 100 GeV/c. Such effects, corresponding to two or three GeV/c2 after allowing for detector resolution, are potentially observable.
| pT, | Boson | signal / | Peak shift | Boson | signal / | Peak Shift | ||
| GeV/c | mode | background | GeV/c2 | mode | background | GeV/c2 | ||
| 100 | 6.9 | 0.9810.002 | 0.005 | 48 | 1.0030.001 | 0.003 | ||
| 15.2 | 0.9810.002 | 0.005 | ||||||
| 0 | 4.0 | 0.8850.002 | 0.005 | 20.5 | 0.9960.002 | 0.005 | ||
| 19.1 | 0.9940.002 | 0.002 | ||||||
| 13.1 | 1.0060.002 | 0.004 | 86 | 1.0110.002 | 0.004 | |||
| 92 | 0.9970.002 | 0.004 |
The mean shifts observed in a set of diboson states are summarised in table 6. and states are explored; are not expected to show qualitatively different behaviour.
The experimental study of such a state would not be able, in general, to distinguish jets from quarks or gluons. The dijet mass spectrum is analysed inclusively for the hadronic and decays, and including all quark or gluon initial state combinations. The 10% mass resolution is applied, and a mass region from 70.775 GeV/c2 to 92.525 GeV/c2 is chosen, defined by the masses where the binned electroweak signal differential cross-section has halved compared with its peak. In that region, the pure electroweak cross-section is 1.3 pb, while that for QCD production of the additional jets is 20 pb. This corresponds to production of 180,000 events in 140 fb-1 of LHC data, or 700,000 if the electron mode and their charge conjugates are also considered, which is may be sufficient to allow experimental study.
7 Discussion
The impact of electroweak-QCD interference on a variety of hadronic vector boson production modes has been explored. The effect is mostly to move the peak position without changing the integral. There can be destructive interference effects between QCD and -channel electroweak diagrams, for example in figure 10, but they are not the main focus of this study.
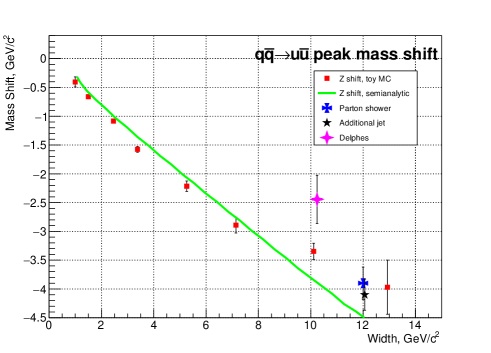
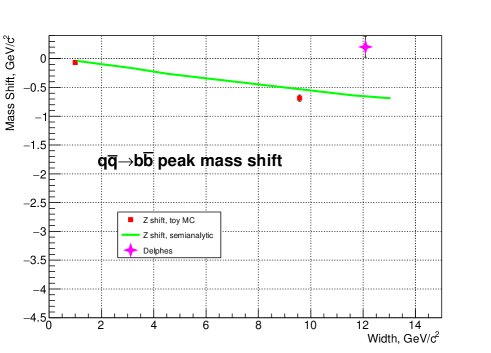
The mass shifts are summarised in figure 13, where the left-hand plot shows the production at rest, plotted against the signal-to-background ratio of the quark final state in question. The different decay modes of the and decay at rest are linked to highlight the correlation between large signal-to-background ratio and small interference Brooijmans:2018xbu . Thus for the boson the interference is largest for decay and smallest for . The boson does not have a gluon-splitting background, and thus has higher signal-to-background than the , but the background is more likely to have a colour singlet form, so the interference effects are larger at a given signal-to-background. The peak shifts fall inside the range spanned by the decay modes.
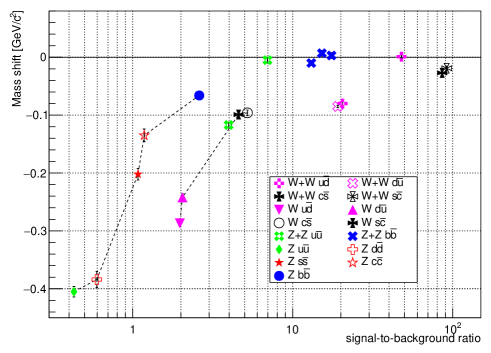
Experiments generally uses -tagging to identify bosons. This suppresses the -channel QCD processes and reduces the interference effects rather accidentally. If there were a pure and efficient way to identify -quarks available, experiments would use that to identify candidates too, and would then experience larger interference effects.
It may be possible to study inclusive using LHC data. The ATLAS and CMS collaborations record data at about 1 KHz, from an LHC bunch-crossing rate of around 30 MHz. Thus one event in every 30,000 is recorded as pile-up in the detectors, or approximately 4 pb-1. If a 10% resolution is assumed the cross-section in GeV/c2 at leading order is 2500 pb, and the QCD background in is only 8000 pb. If non- background can be suppressed using -tagging, this should be clearly visible.
In the light of the dependence on the signal-to-background ratio in 13 (left), an explorative simulation of has been performed. This required the process , with selections on the two candidates masses between GeV/c2 and GeV/c2, and the top candidates masses between 160 GeV/c2 and 190 GeV/c2. The cross-section with two electroweak vertices, one boson plus QCD jets, is 0.260.01 fb, while that at fourth order in electroweak, which includes two on-shell top quarks, is 3.01 pb. This signal-to-background ratio, 104, strongly suggests that interference will have a completely negligible impact.
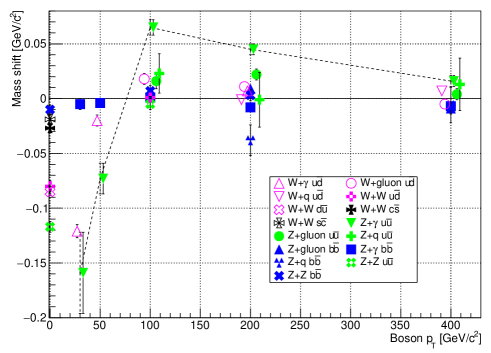
The mass shifts calculated in various boosted states are shown against the vector boson minimum pT requirement in figure 13 (right). As with the bosons at rest, they are largest for , and smallest for , with the bosons being intermediate. When vector bosons are boosted to 200 GeV/c or more, there is generally a positive shift, but it is too small to be experimentally observable. For transverse momenta of 50 to 100 GeV/c the patterns are complicated, with the interference swapping sign, partly because the electroweak process is no longer dominated by -channel resonances. The 2D space of between the quarks and the vector boson pT is presented in figure 12 for the case, where the varying contributions of TGC production and emission of two independent bosons, which have opposite phase, leads to opposite sign shifts in different regions.
The shifts in the peak positions are increased by roughly an order of magnitude when smearing the results to mimic resolution effects. For example, an intrinsic shift of GeV/c2 in is enlarged to GeV/c2. This is reproduced by an approximate -channel-only interference formula. In this context, the parton shower simulation acts similarly to detector resolution. This is not surprising as it is independently simulated and knows nothing of the interference in the matrix elements. Simulation using Delphes suggests that slightly smaller effects would occur as the jets with large are less likely to be accepted. This could be offset by working with a lower jet pT threshold than the 25 GeV/c generally used here.
For the original question that considers whether the boosted hadronic bosons are good standard candles for the calibration of the detectors, the answer is yes. The decays, especially boosted, have excellent intrinsic signal-to-background ratio, while the decay mode is protected by the colour structure of QCD and the small PDF. The impact of interference on kinematics close to the published measurements has always been found to be small. The one caveat is that NLO effects might give rise to colour-singlet pairs with a significant cross-section, which would reopen the question for the boson. There is no analogous QCD process for production, so the boson results should be regarded as more robust. Higgs to decay has a cross-section significantly lower than , but its 4 MeV width improves the signal-to-background ratio by 3 orders of magnitude and interference can have no practical impact there.
In future trigger-level analyses, for example in the state with a 50 GeV/c pT threshold, the - and -channel interference effects might perhaps be possible to observe. More challenging to record is the final state, where large effects should be observable if significant luminosity can be recorded with a pT threshold of 50 GeV/c. This mode might be enhanced by NLO QCD corrections.
However, the process seems to have the greatest promise for experimental study. The mass peak, after detector resolution, is expected to change position by two or more GeV/c2 across the kinematic plane. Smaller effects will occur for , but it might be possible to distinguish these final states using charm tagging. When only irreducible background is considered, and pileup neglected, the signal-to-background ratio exceeds 5%, so a more detailed study seems warranted. This particular example includes a leptonically decaying boson, so the experiments have recorded this data, and the experimental collaborations are encouraged to see if the predicted effects can be observed.
Acknowledgements.
Great thanks are due to J. Quevillon who clarified many of these concepts for us and suggested studies and cross-checks, L. Xia, for the helpful observation that at NLO colour octet and singlet merge and to S. Schramm, for the observation that pileup events contribute a significant trigger-free event rate. We also wish to thank our journal referees, whose insistence that we explore the impact of the jet pT threshold and the use of Delphes simulation highlighted important issues.References
- (1) G. Ranft, J. Ranft, Physics Letters B 87(1-2), 122 (1979). DOI 10.1016/0370-2693(79)90034-0. URL https://doi.org/10.1016/0370-2693(79)90034-0
- (2) U. Baur, E. Glover, Physics Letters B 232(4), 519 (1989)
- (3) J. Alitti, et al., Z. Phys. C 49(CERN-PPE-90-105), 17 (1990). DOI 10.1007/BF01570793. URL https://cds.cern.ch/record/210698
- (4) J. Pumplin, Phys. Rev. D 45, 806 (1992). DOI 10.1103/PhysRevD.45.806. URL https://link.aps.org/doi/10.1103/PhysRevD.45.806
- (5) U. Baur, Phys. Rev. D75, 013005 (2007). DOI 10.1103/PhysRevD.75.013005. URL https://link.apr.org/doi/10.1103/PhysRevD.75.013005
- (6) J.M. Butterworth, A.R. Davison, M. Rubin, G.P. Salam, Phys. Rev. Lett. 100, 242001 (2008). DOI 10.1103/PhysRevLett.100.242001. URL https://link.aps.org/doi/10.1103/PhysRevLett.100.242001
- (7) The ATLAS collaboration, Aad, G. et al. Search for diboson resonances in hadronic final states in 139 fb-1 of collisions at TeV with the ATLAS detector (2019). URL https://arxiv.org/abs/1906.08589
- (8) The CMS collaboration, Sirunyan, A. et al. A multi-dimensional search for new heavy resonances decaying to boosted WW, WZ, or ZZ boson pairs in the dijet final state at 13 TeV (2019). URL https://arxiv.org/abs/1906.05977
- (9) The CMS collaboration, Sirunyan, A. et al., Phys. Rev. Lett. 120, 071802 (2018). DOI 10.1103/PhysRevLett.120.071802. URL https://link.aps.org/doi/10.1103/PhysRevLett.120.071802
- (10) The ATLAS collaboration, Search for boosted resonances decaying to two b-quarks and produced in association with a jet at TeV with the ATLAS detector. Tech. Rep. ATLAS-CONF-2018-052, CERN, Geneva (2018). URL https://cds.cern.ch/record/2649081
- (11) The ATLAS collaboration, Aad, G. et al. Measurement of the jet mass in high transverse momentum production at TeV using the ATLAS detector (2019). URL https://arxiv.org/abs/1907.07093
- (12) The ATLAS collaboration, Aad, G. et al., Eur. Phys. J. C 79(arXiv:1906.11005. 10), 836. 54 p (2019). DOI 10.1140/epjc/s10052-019-7335-x. URL https://cds.cern.ch/record/2680245. 54 pages in total, author list starting page 38, 20 figures, 3 tables. All figures including auxiliary figures are available at http://atlas.web.cern.ch/Atlas/GROUPS/PHYSICS/PAPERS/PERF-2017-04
- (13) M. Aaboud, et al., Phys. Lett. B786, 59 (2018). DOI 10.1016/j.physletb.2018.09.013. URL https://link.aps.org/doi/10.1016/j.physletb.2018.09.013
- (14) The CMS collaboration, Sirunyan, A. et al., Phys. Rev. Lett. 121(12), 121801 (2018). DOI 10.1103/PhysRevLett.121.121801. URL https://link.aps.org/doi/10.1103/PhysRevLett.121.121801
- (15) The CMS collaboration, Jet algorithms performance in 13 TeV data. Tech. Rep. CMS-PAS-JME-16-003, CERN, Geneva (2017). URL https://cds.cern.ch/record/2256875
- (16) The ATLAS collaboration, Measurement of large radius jet mass reconstruction performance at TeV using the ATLAS detector. Tech. Rep. ATLAS-CONF-2016-008, CERN, Geneva (2016). URL https://cds.cern.ch/record/2139642
- (17) The ATLAS collaboration, Aad, G. et al., The European Physical Journal C 79(4), 290 (2019). DOI 10.1140/epjc/s10052-019-6757-9. URL https://doi.org/10.1140/epjc/s10052-019-6757-9
- (18) The CMS collaboration, Sirunyan, A. et al., The European Physical Journal C 78(11), 891 (2018). DOI 10.1140/epjc/s10052-018-6332-9. URL https://doi.org/10.1140/epjc/s10052-018-6332-9
- (19) T. Gleisberg, et al., JHEP 02, 007 (2009). DOI 10.1088/1126-6708/2009/02/007. URL http://www.slac.stanford.edu/spires/find/hep/www?eprint+0811.4622
- (20) M. Cacciari, S. Frixione, N. Houdeau, M.L. Mangano, P. Nason, G. Ridolfi, JHEP 10, 137 (2012). DOI 10.1007/JHEP10(2012)137. URL https://link.aps.org/doi/10.1007/JHEP10(2012)137
- (21) F. Cascioli, P. Maierhöfer, S. Pozzorini, Phys. Rev. Lett. 108, 111601 (2012). DOI 10.1103/PhysRevLett.108.111601. URL https://link.aps.org/doi/10.1103/PhysRevLett.108.111601
- (22) M. Schönherr, F. Krauss, JHEP 12, 018 (2008). DOI 10.1088/1126-6708/2008/12/018. URL https://link.apr.org/doi/10.1088/1126-6708/2008/12/018
- (23) R.D. Ball, et al., JHEP 04, 040 (2015). DOI 10.1007/JHEP04(2015)040. URL https://link.apr.org/doi/10.1007/JHEP04(2015)040
- (24) L.A. Harland-Lang, A.D. Martin, P. Motylinski, R.S. Thorne, The European Physical Journal C 75(5), 204 (2015). DOI 10.1140/epjc/s10052-015-3397-6. URL https://doi.org/10.1140/epjc/s10052-015-3397-6
- (25) T. Gleisberg, S. Höche, JHEP 12, 039 (2008). DOI 10.1088/1126-6708/2008/12/039. URL https://link.apr.org/doi/10.1088/1126-6708/2008/12/039
- (26) The DELPHES 3 collaboration, J. de Favereau, C. Delaere, P. Demin, A. Giammanco, V. Lemaître, A. Mertens, M. Selvaggi, Journal of High Energy Physics 2014(2), 57 (2014). DOI 10.1007/JHEP02(2014)057. URL https://doi.org/10.1007/JHEP02(2014)057
- (27) R. Brun, F. Rademakers, Nucl. Instrum. Meth. A389, 81 (1997). DOI 10.1016/S0168-9002(97)00048-X. URL https://link.aps.org/doi/10.1016/S0168-9002(97)00048-X
- (28) G. Brooijmans, et al., in Les Houches 2017: Physics at TeV Colliders New Physics Working Group Report, Section 19, p145 (2018). URL http://lss.fnal.gov/archive/2017/conf/fermilab-conf-17-664-ppd.pdf
- (29) S.P. Martin, Phys. Rev. D 86, 073016 (2012). DOI 10.1103/PhysRevD.86.073016. URL https://link.aps.org/doi/10.1103/PhysRevD.86.073016
- (30) M. Aaboud, et al., Phys. Rev. D96(7), 072002 (2017). DOI 10.1103/PhysRevD.96.072002. URL https://link.aps.org/doi/10.1103/PhysRevD.96.072002
- (31) The CMS collaboration, Khachatryan, V. et al., JINST 12(02), P02014 (2017). DOI 10.1088/1748-0221/12/02/P02014. URL https://link.aps.org/doi/10.1088/1748-0221/12/02/P02014
- (32) M. Cacciari, G.P. Salam, G. Soyez, JHEP 04, 063 (2008). DOI 10.1088/1126-6708/2008/04/063. URL https://link.aps.org/doi/10.1088/1126-6708/2008/04/063
- (33) The ATLAS collaboration, Trigger Menu in 2016. Tech. Rep. ATL-DAQ-PUB-2017-001, CERN, Geneva (2017). URL https://cds.cern.ch/record/2242069
Appendix A Example Run.dat
An example ‘run.dat’, for production with a pT selection set to 0 GeV/c in the second last line.
(run){
  # general settings
  EVENT_OUTPUT=HepMC_GenEvent[sb]
  EVENTS 25;

  # me generator setup
  ME_SIGNAL_GENERATOR Comix;
  SCALES VAR{Abs2(p[0]+p[1])};

  # Five lines added to switch off decays.
  SHOWER_GENERATOR=None
  FRAGMENTATION=Off
  MI_HANDLER=None
  ME_QED=Off
  BEAM_REMNANTS=0

  # LHC beam setup:
  BEAM_1 2212; BEAM_ENERGY_1 6500;
  BEAM_2 2212; BEAM_ENERGY_2 6500;
}(run)

(processes){
Process 94 94 -> 1 -2 -13 14  ;
  Order (*,4);
  Print_Graphs graphs;
End process;
}(processes)

(selector){
ΨMass 1 -2  50 150
ΨMass -13 14  70 90
ΨPT 93 25 E_CMS
ΨPT 90 25  E_CMS
ΨPseudoRapidity 93 -2.5 2.5
Ψ"Calc(PPerp(p[0]+p[1])>0)" 13,-14 1,1
}(selector)