H ii versus H i in the ‘green valley’ galaxies: direct comparison
Abstract
We study the morphology and kinematics of the ionization state of the gas in four ‘green valley’ early-type galaxies at different stages of their transition from a ‘blue cloud’ of star-forming galaxies to the sequence of passive evolution. The previous H i mapping of the considered sample reveals a spatial offset between the cold gas reservoirs and stellar discs depending on the post-starburst age. Consideration of the ionized-gas properties is essential to understand the role of various feedback processes in star formation quenching. We performed long-slit and 3D optical spectroscopic observations at the 6-m Russian telescope and compared the gas and stellar kinematics. Spatial distribution of the ionized gas is in agreement with H i maps; however, the one-order higher angular resolution in the H ii velocity fields allows us to study non-circular gas motions in detail, like the AGN-driven outflow in the nucleus of J1117+51. The most intriguing result is the global H i+H ii gas counter-rotation relative to the stellar disc in J1237+39. Therefore, in this case all the observed gas in the ‘green valley’ galaxy was captured from the environment via accretion or minor merging.
keywords:
galaxies: evolution – galaxies: ISM – galaxies: kinematics and dynamics – galaxies: elliptical and lenticular, cD1 Introduction
The optical colours of local galaxies demonstrate the well–known bimodality (Strateva et al., 2001; Baldry et al., 2004; Baldry et al., 2006). Most galaxies can be related either to the ‘blue cloud’ populated with disc-dominated galaxies possessing star-forming cold gas and young stellar population, or to the ‘red sequence’ – early-type galaxies (ETG, ellipticals and lenticuliar) which have exhausted gas reservoirs and contain older stellar population (Blanton & Moustakas, 2009). An intermediate ‘green valley’ population consists of galaxies that, as is believed, undergo transitional processes. Traditionally the transition path is considered to lead from the ‘blue cloud’ to the ‘red sequence’. As the population of the ‘green valley’ is rather small compared to red and blue groups, star formation quenching should occur within a relatively short time-scale (Martin et al., 2007).
A place of lenticular galaxies with green optical colours in galaxy evolution is still uncertain. We do not know if these disc galaxies precede gas-rich spirals, have accumulated cold gas from the environment at further evolution stages, or, conversely, if they are the former spirals which have lost their gas reservoirs and transited to the red sequence. Both paths have been widely discussed and approved by different studies, see, for instance, Sil’chenko et al. (2012); Katkov et al. (2015) for the first scenario and Fasano et al. (2000); Wilman et al. (2009) for the second. Recently, new observational arguments in favour of the first scenario were presented by Sil’chenko, Moiseev & Egorov (2019).
Major mergers also are a feasible explanation for the transformation of spirals into lenticulars (Querejeta et al., 2015). Available observations presume contradictory interpretation frequently, that is why it is crucial to use multiwavelength data to understand the balance between different gas feedback mechanisms (supernova explosions, active galactic nuclei, galactic winds) and external accretion processes (Fraternali & Binney, 2008).
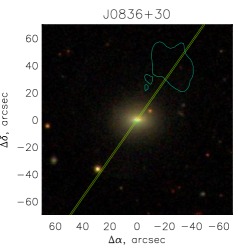
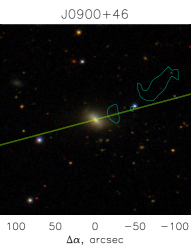
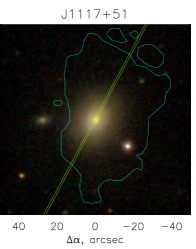
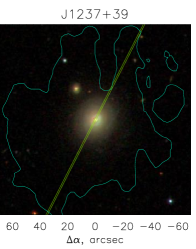
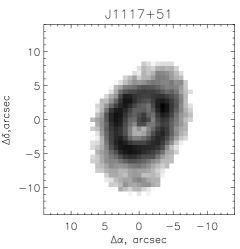
In Wong et al. (2015), a sample of so-called ‘blue ETGs’, located in the ‘green valley’, was considered. Using the Westerbork Syntheses Radio Telescope (WSRT) they mapped the H i in four local (redshifts ) galaxies with comparable stellar masses and similar lenticular-like morphology. Their near-ultraviolet colours, however, range from very blue, consistent with the ongoing star formation (J1237+39), to red colours of passive quenched galaxies (J0836+30). The coordinates and properties of the considered galaxies are listed in Table 1. Fig. 1 shows the HI distribution with the cyan contours overlaid on optical images. In the galaxies with the bluest NUV colours, undisturbed (J1237+39) and slightly asymmetric (J1117+51) discs are observed. As for the reddest galaxies, J0900+46 and J0836+30, all the cold gas reservoirs are displaced from the stellar discs.
| Galaxy | RA (J2000) | Declination (J2000) | Distancea, Mpc | log(M∗)a | lg M | H i summarya |
|---|---|---|---|---|---|---|
| J0836+30 | 08:36:01.5 | +30:15:59.1 | 105 | 10.7 | 8.0 | H i ejected |
| J0900+46 | 09:00:36.1 | +46:41:11.4 | 113 | 10.5 | 9.1 | H i ejected |
| J1117+51 | 11:17:33.3 | +51:16:17.7 | 115 | 10.6 | 8.5 | H i displaced |
| J1237+39 | 12:37:15.7 | +39:28:59.3 | 84 | 10.3 | 9.6 | H i rotating disc |
-
•
a From Wong et al. (2015).
| Galaxy | Date of obs. | SCORPIO-2 mode | Sp.range, Å | Exp. time, s | Seeing, ′′ | Slit PA, deg. |
|---|---|---|---|---|---|---|
| J0836+30 | 07.12.2015 | Long-slit | 3600–7070 | 1.9 | 145 | |
| J0900+46 | 05.12.2015 | Long-slit | 3600–7070 | 2.2 | 105 | |
| J1117+51 | 08.12.2015 | Long-slit | 3600–7070 | 2.1 | 152 | |
| 10.12.2015 | FPI | H | 1.2 | |||
| J1237+39 | 10.12.2016 | Long-slit | 3600–7070 | 1.0 | 333 | |
| 12.12.2015 | FPI | H | 1.8 |
Wong et al. (2015) has posited that these galaxies present different stages of quick star formation quenching driven by a kinetic process, possibly feedback from the black-hole activity. According to the proposed evolution models, two of them (J0836+30 and J0900+46) appear to evolve along the fastest quenching evolutionary pathway, on timescales of up to 1 Gyr, typical of early-types; two others (J1117+51 and J1237+39) evolved less and favour slower quenching pathways, as the late-types do. Wong et al. (2015) suggested that the start quenching time in these galaxies and fiducial quenching starting point in the models differ. However, the other scenario could be proposed: J1117+51 and J1237+39 collected external gas from the outer source after quenching began and moved in the opposite direction in the colour-magnitude diagram.
However, the angular resolution of WSRT data (beam 12–30 arcsec) was comparable with optical sizes of the galaxies; that prevents studying gas kinematics on the intergalactic scales. Spatially-resolved optical spectroscopy could help us understand what we observe in these galaxies: a time sequence of AGN feedback (as Wong et al., 2015, proposed), or a more complex process including a new gas accretion event. In the present paper, we obtained detailed observed data on kinematics and distribution of the ionized gas in galaxy discs in the Wong et al. (2015) sample and compared the gas (in both H i and H ii species) and stellar kinematics. Thus, we can make more detailed decisions about the processes that influence gas reservoirs and probably find some relations between H i and H ii.
2 Observations and data reduction
Optical spectroscopic observations of the Wong et al. (2015) sample were performed in December 2015 at the prime focus of the Special Astrophysical Observatory of the Russian Academy of Sciences (SAO RAS) 6-m telescope BTA with the SCORPIO-2 multimode focal reducer (Afanasiev & Moiseev, 2011). Observations consisted of two steps. Each galaxy was observed in the long-slit mode of the spectrograph in order to understand the character of the ionized gas large-scale distribution. Only in J1117+51 and J1237+39, the ionized gas emission lines were detected in their discs. These two targets were mapped with the scanning Fabry–Perot interferometer (FPI) in the H emission line. The log of observations is presented in Table 2.
2.1 Long-slit spectroscopy
The large-scale distribution of H i in the sample galaxies was taken into account to choose the slit position angles (). Namely, the slit was placed across the nucleus along the major axis of the H i structures in the galaxies J0836+30 and J0900+46, where H i clouds according to Wong et al. (2015) were misaligned with the stellar disc. In J1117+51 and J1237+39 with the regular rotating H i discs aligned with the stellar ones, the slit crossed the nucleus along stellar disc major axis.
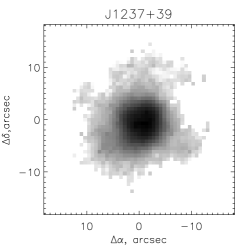
Fig. 1 shows the position of the SCORPIO-2 slit with a size of 6 arcmin 1 arcsec in the SDSS images of the galaxies. The scale was 0.36 arcsec per pixel, the total exposure time and typical mean are given in Table 2. Observations were obtained with the VPHG1200@540 grism providing the spectral resolution Å. Initial data reduction was performed in a standard way using the IDL-based software package written for reducing the long-slit spectroscopic data obtained with SCORPIO-2 as described in our previous papers (e.g., Egorov et al., 2018). The flux calibration was done by using the spectrophotometric standard star observed at the same night in air-mass conditions close to those in the galaxy.
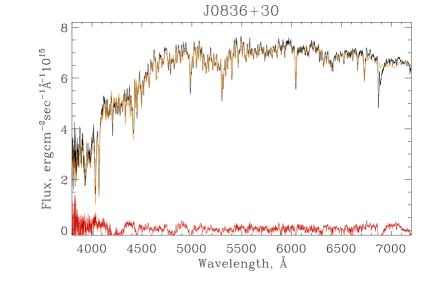
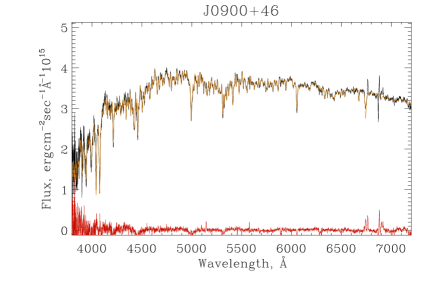
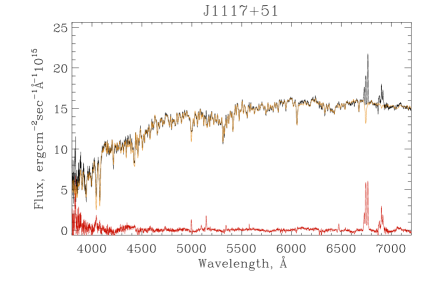
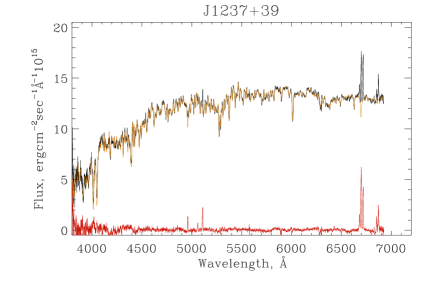
The observed long-slit spectra contain the combination of the ionized gas emission lines with underlying stellar absorption features. In order to analyse the nebular spectra, we subtracted the stellar population contribution models using the ULySS package (Koleva et al., 2009). The Elodie and Vaz Miles stellar libraries were accepted. Fig. 2 shows the integrated spectra of the galaxy nuclear regions together with its decomposition to the stellar population and ionized gas. The emission lines were fitted by a single Gaussian (for H and H) or double Gaussian (for doublets [S ii], [N ii], and [O iii]) to obtain their fluxes and line-of-sight velocities. In order to increase the signal-to-noise ratio, all the spectra used for further analysis were binned along the slit using a simple 2-3 px binning.
2.2 3D spectroscopy with scanning FPI
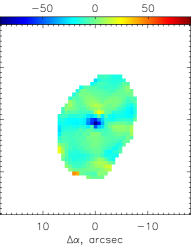
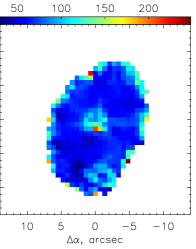
The extended regions of the ionized gas were detected in the SCORPIO-2 long-slit data in J1237+39 and J1117+51. These two galaxies were also observed with SCORPIO-2 in the scanning FPI mode. This device mapped the spectral region around the redshifted H emission line in 40 spectral channels. The corresponded spectral range was about 37Å, with a spectral resolution of 2.4Å (). The data were reduced using an IDL-based software package (Moiseev & Egorov, 2008; Moiseev, 2015). After the initial reduction, the observed data were combined into data cubes with a scale of 0.7 arcsec/px. The H emission-line profiles were fitted by the one-component Voigt function which yielded the flux, line-of-sight velocity, and velocity dispersion corrected for instrumental broadening (Moiseev & Egorov, 2008).
3 Ionized gas in J1117+51 and J1237+39
Fig. 2 clearly demonstrates the absence of detectable emission lines in the nuclear spectra of J0836+30, also we did not see any diffuse nebular emission along the slit. The similar situation was observed in J0900+46, where only a weak nuclear emission was detected. In this section, we consider the ionized gas properties only in two galaxies with extended discs of the ionized gas: J1237+39 and J1117+51.
3.1 Ionized gas kinematics and morphology
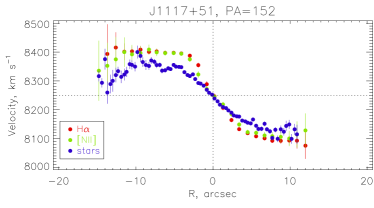
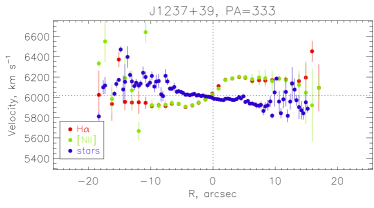
Radial distributions of the line-of-sight velocities of the stellar and gaseous components along the photometric major axes in J1117+51 and J1237+39 are shown in Fig. 3. The line-of-sight velocities of stars were derived by fitting the observed spectra with the ULySS population model as described above in Sec. 2.1.
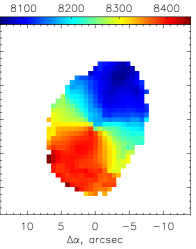
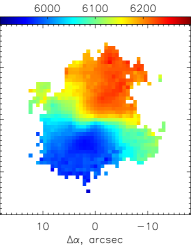
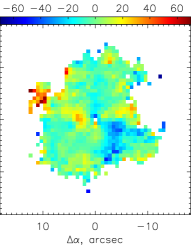
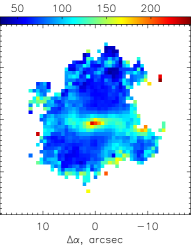
In both galaxies, we see a typical kinematic pattern of a regular rotating disc: the velocities of each component demonstrate symmetrical distributions relative to the galaxy nucleus and corresponding systemic velocities; the observed amplitude of the dynamically cold gas is larger than that of stars (i.e., an asymmetric drift). The FPI H velocity fields (Fig. 4) also confirm the regular rotation pattern of the ionized gas disc with the similar line-of-sight velocity changes that have been observed in H i. Namely, Wong et al. (2015) have shown that SE side of the H i disc in J1117+51 is redshifted relative to the systemic velocity in agreement with our data in H. Whereas in the FPI maps the circularly rotating disc is resolved in details thanks to the angular resolution in H one order higher than that in H i. J1237+39 is the only galaxy with the well-resolved rotating H i disc in the Wong et al. (2015) paper (see their Fig. 7b), the neutral gas velocity field seems to be in a very good agreement with the FPI data, including even small-scale details like an extension of ‘green’ velocities along the disc minor axis.
The principal difference between the considered galaxies is that in J1117+51 the gas and stars rotate in the same direction, whereas in J1237+39 all the observed gas (H i+H ii) is in the counter-rotation. The diameter of the gaseous disc is about 28″(=11 kpc) in H and it exceeds 30 kpc in H i, that is even larger than the stellar disc diameter (D25=21 kpc in the r-SDSS according to NED). Such global large-scale gaseous counter-rotating disc is known in several nearby galaxies (Sil’chenko et al., 2009; Pizzella et al., 2018, and references therein). Recently, a few dozen similar gas-star misaligned structures were found in the 1st release of the MaNGA survey (Jin et al., 2016).
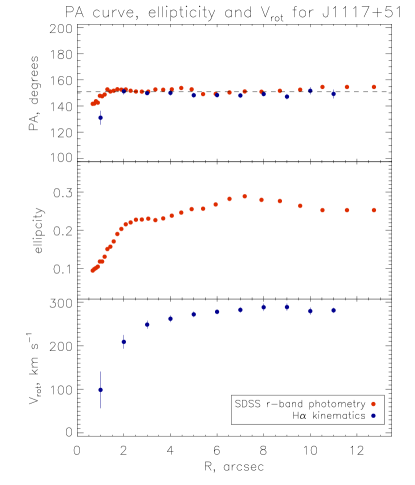
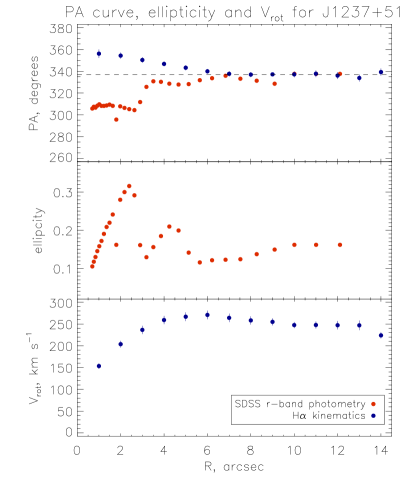
The H velocity fields were analysed with the classical ‘tilted-ring’ model (Begeman, 1989) using the technique described in Finkelman et al. (2011); Moiseev (2014). The velocity fields were splitted into elliptical rings in agreement with the adopted inclination () and the position angle of the disc major axis (). The kinematic center in both galaxies matches the position of the photometric nucleus very well. In each ring, the observed distribution of the line-of-sight velocities was described with the circular rotation model parameterized by the position angle of the kinematic axis , the inclination of circular orbits , the rotation velocity , and systemic velocity . The preliminary estimates of and were derived from the analysis of the -SDSS isophotes using the PhotUtils Python package111https://zenodo.org/record/2533376. was clarified in the forthcoming tilted-ring analysis. Since the kinematic value was estimated with large uncertainty, we kept its photometric values obtained from the -band external isophotes using the intrinsic axial ratio adopted for spiral galaxies (Hubble, 1926). The mean values of were fixed after adopting the optimum value. The obtained parameters of the gaseous discs are listed in Table 3 including the orientation parameters obtained from the analysis of outer isophotes ( arcsec). The radial dependences of and are shown in Fig. 5.
| Parameter | J1117+51 | J1237+39 |
|---|---|---|
| , | ||
| , | ||
| , | ||
| , |
Both velocity fields are well described by domination of pure circular gas motions with the flat rotation curve (Fig. 5, bottom). To quantify the value of gas-star misalignment we compare photometric and kinematic estimations of the major axis . The top panels in Fig. 5 as well as Table 3 clearly demonstrate a good agreement between the -band isophotes position angle () and gaseous in the outer parts of the discs. However, the situation within the central kiloparsecs is more complex.
Possible non-circular motions in the disc of J1117+51 are negligible, because the radial variations of close to the mean value are underestimation errors. Relatively small changes of at arcsec (4 kpc) might be related to the star-forming ring that has appeared in the H-image (Fig. 4) and is also visible in the SDSS image (Fig. 1). The internal ellipticity of this ring caused the observed variations of isophotes shape, but it doesn’t affect the velocity field.
The map of residual velocities after subtraction of the tilted-ring model from the observed velocity field in J1117+51 reveals the excess of negative velocities () in the nucleus of J1117+51. The most obvious interpretation of this blueshifted gas is an AGN-driven outflow which is often observed in Seyfert/LINER galaxies
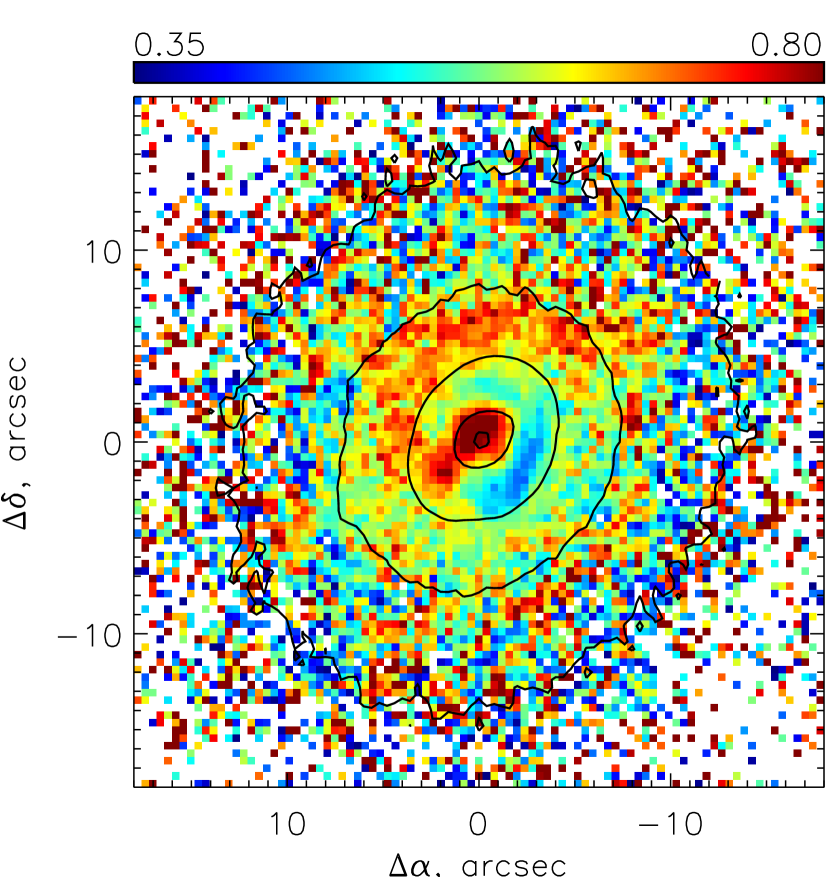
The deviation from a simple rotating flat disc model is more significant in J1237+39: the turn of by 10–15 deg relative to the disc major axis is observed in the central arcsec (2 kpc). In the same radii, deviates in the opposite direction (Fig. 5). This sort of kinematic mismatch usually corresponds to gas streaming motions under gravitational influence of a bar or a triaxial bulge; for detailed description and references see, for example, Moiseev et al. (2004). Stationary values of the inner isophotes are accompanied by the peak of ellipticity that is typical for bar-like structures (Erwin & Sparke, 1999). The SDSS image (Fig. 1) reveals a low-contrast feature like an oval or pseudo-ring at these distances, but the detailed analysis demonstrates a more complicated picture. Indeed, the SDSS colour map of shown in Fig. 6 reveals several interesting details: a blue ring or pseudo-ring with at arcsec (0.6–1.6 kpc) and a one-armed red spiral arm extending to arcsec (3.3 kpc). This spiral starts from the red knot ( ) located at 1.2 kpc southeast from the galaxy nucleus. Very preliminary we can interpret the observed as minor merging imprints. In this case, the red knot may be a remnant of a dwarf companion galaxy, the red spiral corresponds to the stars of this disturbed satellite, or to a tidal structure generated by merging, whereas a blue pseudo-ring is related to the star-formation burst triggered by the concentration of the gas exchanging its angular momentum due the merging and falling in the cirucmnuclear region.
Therefore, we can conclude that the gas velocity field in J1237+39 is perturbed by asymmetric stellar structures in the inner 3 kpc related to the minor merging remnants which produce the significant ( degs) deviations of kinematics from the orientation of the isophotes (Fig. 4).
The map of residual velocities in J1237+39 reveals several regions with significant (–) deviations from the tilted-ring model mostly along the galaxy minor axis (Fig. 4). It is not easy to describe them in terms of an AGN-driven outflow or jet-cloud interaction, because the gas around the nucleus has a relatively low excitation, no extended narrow-line regions have been detected (see Sect. 3.2). Also, Wong et al. (2015) did not detect any elongation of non-thermal radio emission in this source. We suppose that the observed non-circular motions together with the extension of the diffuse H emission along the galaxy minor axis (that is also observed in H i, see Fig. 7b in Wong et al., 2015) might be related to the event formed in the global counter-rotating disc, either by gas accretion or minor merging whose possible remnants are detected in the distribution of the colour index.
3.2 Gas excitation
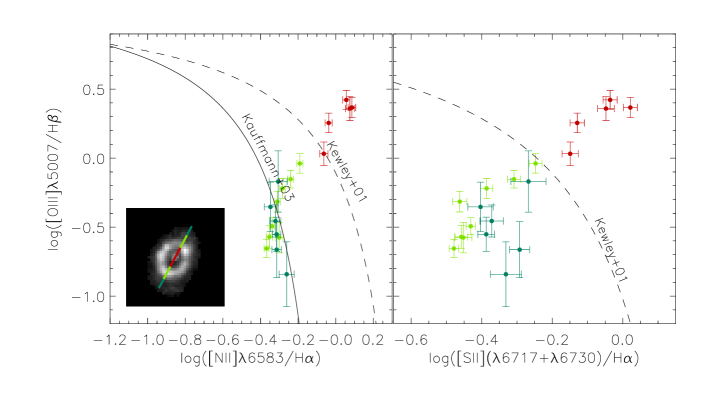
The BPT (after Baldwin, Phillips & Terlevich, 1981) diagnostic diagrams of the emission line ratios, derived from our long-slit data are presented in Figs. 7 and 8. The ???maximum starburst line??? (Kewley et al., 2001) demarcation separates the regions, whose emission can be explained with photoionization by young massive stars as a consequence of the ongoing star formation (H ii type) from those with the major contribution from other sources of excitation (shocks and Sy/LINER). The points lying between this curve and the Kauffmann et al. (2003) curve correspond to a composite excitation mechanism.
For both galaxies we confirm the nuclear LINER-type activity that was already mentioned in (Wong et al., 2015) based on the SDSS nuclear spectra. Fig. 7 shows the changes of gas excitation with radial distances: the LINER nucleus (orange dots), the composite mechanism in the star-forming ring in the [N ii]/H versus [O iii]5007/H diagram (light-green dots in the diagrams), pure H ii type in the external disc (, dark-green dots). This variations of the forbidden-to-Balmer line ratios are known as ‘AGN-HII mixing sequence’ (Kewley et al., 2006). In J1117+51, this diagonal tracks across BPT diagrams could be related to domination of the star-forming processes and decrease of the AGN fraction of gas ionization, when the distance from the nucleus increases (see the model estimation by Dickey et al., 2019). The influence of the AGN on gas ionization is observed only in the very center of the galaxy, where the blueshifted ionized gas outflow is detected (Sect. 3.1).
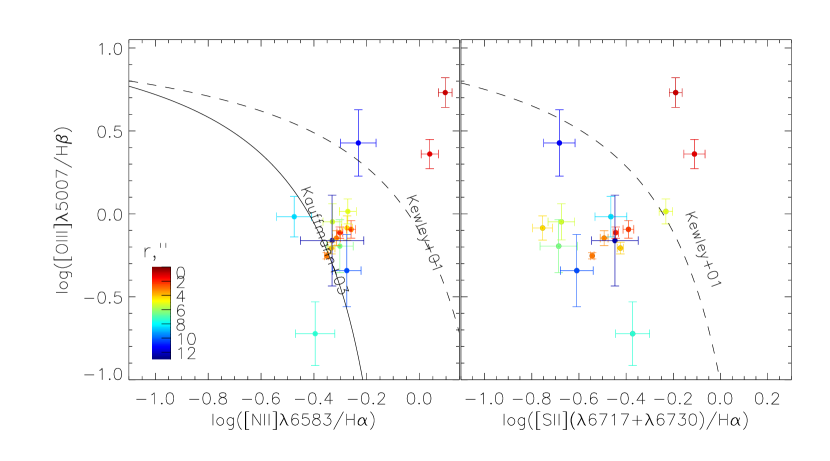
In J1237+39, the nuclear points also locate in the LINER region in the BPT diagrams (Fig. 8); however, without a smooth radial changes of gas excitation properties: other circumnuclear points locate in the composite or H ii areas in the diagrams. Therefore, the weak AGN in this galaxy has a very small influence on the gas in the surrounding counter-rotating disc, even within the central kiloparsec region. This fact is in agreement with our previous conclusion about the absence of a nuclear outflow in this galaxy.
4 Discussion
In this paper, we aimed to compare the ionized gas properties and stellar kinematics of four ‘green valley’ galaxies with the cold gas mapped and analysed by Wong et al. (2015). As is posited in the mentioned paper in these galaxies, ‘a kinetic process (possibly feedback from black hole activity) is driving the quick truncation of star formation in these systems, rather than a simple exhaustion of gas supply’.
Spatial distribution of H ii correlates very well with the H i data. First of all, for J0836+30 and J0900+46, the galaxies with the expelled H i reservoirs, we confirm the absence of optical recombination lines in their discs. This fact indicates that either all the gas was expelled (up to the detection limit) or fully ionized and warmed to K. Also, in J1117+51 and J1237+39 we observe rotating discs on the same spatial scales with the H i rotating structures. But unlike the H i reservoir in J1117+51 that is blueshifted and lies beyond the optical radius of the galaxy, the ionized gas disc appears to lie within the optical disc and regularly rotates with a systemic velocity of .
Using a significantly better angular resolution of optical data compared to those of 21 cm, we can study the gas kinematics in detail. Intriguing are the results for J1237+39: global counter rotation of gas and stars together with the velocity deviations in the residual velocity field imply that the history of this galaxy formation is much more complicated than that at the very start of the ‘quenching sequence’. Simulations and some observation studies pointed out that major mergers are the most likely mechanism for generating a compact kinematically decoupled cores (KDC) in resulting galaxies, whereas minor mergers or external accretion can produce dynamically cold large-scale gaseous counter-rotating discs and other structures like bars or rings (Tsatsi et al., 2015; Tapia et al., 2017; Pizzella et al., 2018).
Moreover, the major merging usually creates dispersion-dominated slow rotators (Naab et al., 2014, and references therein) which are different from the rotation-dominated lenticulars in our sample. Recently Taylor, Federrath & Kobayashi (2018) used cosmological simulations to demonstrate the formation of a large-scale counter-rotating gaseous disc via prolonged cold-gas accretion from a cosmic web filament. Based on these simulations, in their next paper Taylor, Kobayashi & Federrath (2019) have found that gas metallicity maps in the counter-rotating disc should have distinct areas of high and low metallicity separated by a sharp boundary. Unfortunately, the available observed data for the J1237+39 galaxy are not enough to make a confident choice between minor merging and filamentary accretion scenarios using the gas metallicity distribution. However, the asymmetric features in the colour-index distribution accompanied by the non-circular gas motions in the inner 2–3 kpc (see Sec. 3.1) give additional arguments in favour of minor-merging hypothesis. It is possible that we directly observe a remnant of the disturbed dwarf companion. New integral-field spectroscopic observations are essential to better understand the formation history of this galaxy.
The AGN feedback was proposed as the main mechanism of gas evacuation in the considered galaxies. Indeed, we see both the ionization and mechanical impacts of on the AGN gas in J1117+51 and J1237+39, but the observed effects are relatively modest and observed only in the cirumnuclear regions: non-thermal gas excitation and AGN-driven spatially unresolved gas outflow in J1117+51. Therefore, the impact of the LINER nuclei on the extended gaseous discs in the galaxies is negligible.
Traditionally, ETGs include both elliptical and lenticular morphological types that might cause misunderstanding. Indeed, Wong et al. (2015) have considered their sample galaxies as a major merging product, i.e., ellipticals. However, J1117+51 and J1237+39 for which we obtained major axis stellar kinematics are rotation-dominated galaxies. Moreover, their SDSS images reveal numerous characteristics of morphological features of flat dymanically cold discs: bar or oval lens, rings, fragments of quasi-spiral structures. Therefore, at least a half of the sample are disc-sominated S0 or S0/a galaxies. Also, as we argue above, the gaseous disc in J1237+39 is of possible accretion origin.
All these lead to a suggestion that the H i distribution and kinematics alone cannot be an argument in favour of the stage of quenching, because accretion is also possible. For better understanding the processes occurring in the ‘green valley’ galaxies, spatially-resolved optical spectroscopy data are necessary. Among local ETGs, a comparison of H i radio mapping with 3D-spectroscopy taken with the integral-field unit (IFU) was performed in the frameworks of the ATLAS3D survey (Serra et al., 2012). It seems interesting that the H i counter-rotating disc galaxy J1237+39 lies in the same sequence as the ATLAS3D ETGs and ALFALFA gas-rich galaxies in the ‘H i fraction – colour’ diagram (see Fig. 9 in Wong et al., 2015). The HI-MaNGA project demonstrates a new step in this direction based on the huge sample of the MaNGA IFU survey (Masters et al., 2019). The detailed H i radio synthesis observations of the selected MaNGA ETGs will be a very interesting extension of the study presented in our current paper.
5 Conclusion
We have performed optical spectroscopic observations of four ‘green valley’ ETGs that were already mapped in H i and considered as different stages of the star formation quenching under action of the negative active nucleus feedback. We aimed to compare the H i and H ii gas distributions and study the ionized gas kinematics with higher spatial resolution. Main findings are the following:
-
1.
In two galaxies considered to be at the most advanced stages of quenching, where H i reservoirs are expelled, the similar picture is also observed in H ii: the ionized gas was not detected in the galaxy discs outside the circumnuclear area.
-
2.
In both galaxies having H i counterparts of stellar discs, we also observed the ionized gas discs with the dominating circular rotation. It is interesting that the H ii disc rotats regularly in J1117+51 that demonstrates the ‘HI displacement’. We suppose that this difference in the H i and H ii behaviour is caused by a relatively low resolution of the H i data.
-
3.
In both H i-disc galaxies, the AGN affects the gas ionization and kinematics (i.e., the nuclear outflow is in J1117+51). However, the influence of the active nucleus was detected only in the central regions, unresolved in our observations ( kpc), we did not see an AGN feedback on larger scales.
-
4.
J1237+39 was considered to be at the first stage of quenching, however, its global gaseous disc (H ii+H i) is in the counter rotation with the stellar one. Therefore, this galaxy may be on the way to start a new burst of star formation after minor merging or a gas accretion event. The asymmetric structures in the SDSS colour-index distribution together with the non-circular gas motions give arguments in favour of recent minor merging in this galaxy.
Wong et al. (2015) suggested that H i mapping are ‘excellent probes and measures of the quenching evolutionary stages’. Our study of the same galaxy sample shows that a comparison of 21-cm maps with the spatially-resolved data on the properties of the ionized gas and stellar population is crucial to understand the evolution paths of ‘green valley’ galaxies. This comparison will be an interesting subject of current and new-generation IFU surveys.
6 Acknowledgements
This study was supported by the Russian Science Foundation, project no. 17-12-01335 ‘Ionized gas in galaxy discs and beyond the optical radius’ and based on observations conducted with the 6-m telescope of the Special Astrophysical Observatory of the Russian Academy of Sciences carried out with the financial support of the Ministry of Science and Higher Education of the Russian Federation. The authors thank the anonymous referee for the detailed comments that helped us to improve this manuscript and Gyula Jozsa for his constructive comments. The research has made use of the NASA/IPAC Extragalactic Database (NED) which is operated by the Jet Propulsion Laboratory, California Institute of Technology, under contract with the National Aeronautics and Space Administration.
References
- Afanasiev & Moiseev (2011) Afanasiev V. L., Moiseev A. V., 2011, Baltic Astronomy, 20, 363
- Baldry et al. (2004) Baldry I. K., Glazebrook K., Brinkmann J., Ivezić Ž., Lupton R. H., Nichol R. C., Szalay A. S., 2004, ApJ, 600, 681
- Baldry et al. (2006) Baldry I. K., Balogh M. L., Bower R. G., Glazebrook K., Nichol R. C., Bamford S. P., Budavari T., 2006, MNRAS, 373, 469
- Baldwin et al. (1981) Baldwin J. A., Phillips M. M., Terlevich R., 1981, PASP, 93, 5
- Begeman (1989) Begeman K. G., 1989, A&A, 223, 47
- Blanton & Moustakas (2009) Blanton M. R., Moustakas J., 2009, ARA&A, 47, 159
- Dickey et al. (2019) Dickey C., Geha M., Wetzel A., El-Badry K., 2019, arXiv e-prints,
- Egorov et al. (2018) Egorov O. V., Lozinskaya T. A., Moiseev A. V., Smirnov-Pinchukov G. V., 2018, MNRAS, 478, 3386
- Erwin & Sparke (1999) Erwin P., Sparke L. S., 1999, ApJ, 521, L37
- Fasano et al. (2000) Fasano G., Poggianti B. M., Couch W. J., Bettoni D., Kjærgaard P., Moles M., 2000, ApJ, 542, 673
- Finkelman et al. (2011) Finkelman I., Moiseev A., Brosch N., Katkov I., 2011, MNRAS, 418, 1834
- Fraternali & Binney (2008) Fraternali F., Binney J. J., 2008, MNRAS, 386, 935
- Hubble (1926) Hubble E. P., 1926, ApJ, 64, 321
- Jin et al. (2016) Jin Y., et al., 2016, MNRAS, 463, 913
- Katkov et al. (2015) Katkov I. Y., Kniazev A. Y., Sil’chenko O. K., 2015, AJ, 150, 24
- Kauffmann et al. (2003) Kauffmann G., et al., 2003, MNRAS, 346, 1055
- Kewley et al. (2001) Kewley L. J., Dopita M. A., Sutherland R. S., Heisler C. A., Trevena J., 2001, ApJ, 556, 121
- Kewley et al. (2006) Kewley L. J., Groves B., Kauffmann G., Heckman T., 2006, MNRAS, 372, 961
- Koleva et al. (2009) Koleva M., Prugniel P., Bouchard A., Wu Y., 2009, A&A, 501, 1269
- Martin et al. (2007) Martin D. C., et al., 2007, ApJS, 173, 342
- Masters et al. (2019) Masters K. L., et al., 2019, arXiv e-prints, p. arXiv:1901.05579
- Moiseev (2014) Moiseev A. V., 2014, Astrophysical Bulletin, 69, 1
- Moiseev (2015) Moiseev A. V., 2015, Astrophysical Bulletin, 70, 494
- Moiseev & Egorov (2008) Moiseev A. V., Egorov O. V., 2008, Astrophysical Bulletin, 63, 181
- Moiseev et al. (2004) Moiseev A. V., Valdés J. R., Chavushyan V. H., 2004, A&A, 421, 433
- Naab et al. (2014) Naab T., et al., 2014, MNRAS, 444, 3357
- Pizzella et al. (2018) Pizzella A., Morelli L., Coccato L., Corsini E. M., Dalla Bontà E., Fabricius M., Saglia R. P., 2018, A&A, 616, A22
- Querejeta et al. (2015) Querejeta M., et al., 2015, A&A, 579, L2
- Serra et al. (2012) Serra P., et al., 2012, MNRAS, 422, 1835
- Sil’chenko et al. (2009) Sil’chenko O. K., Moiseev A. V., Afanasiev V. L., 2009, ApJ, 694, 1550
- Sil’chenko et al. (2012) Sil’chenko O. K., Proshina I. S., Shulga A. P., Koposov S. E., 2012, MNRAS, 427, 790
- Sil’chenko et al. (2019) Sil’chenko O. K., Moiseev A. V., Egorov O. V., 2019, ApJS, in press, p. arXiv:1907.07261
- Strateva et al. (2001) Strateva I., et al., 2001, AJ, 122, 1861
- Tapia et al. (2017) Tapia T., Eliche-Moral M. C., Aceves H., Rodríguez-Pérez C., Borlaff A., Querejeta M., 2017, A&A, 604, A105
- Taylor et al. (2018) Taylor P., Federrath C., Kobayashi C., 2018, MNRAS, 479, 141
- Taylor et al. (2019) Taylor P., Kobayashi C., Federrath C., 2019, MNRAS, 485, 3215
- Tsatsi et al. (2015) Tsatsi A., Macciò A. V., van de Ven G., Moster B. P., 2015, ApJ, 802, L3
- Wilman et al. (2009) Wilman D. J., Oemler A. J., Mulchaey J. S., McGee S. L., Balogh M. L., Bower R. G., 2009, ApJ, 692, 298
- Wong et al. (2015) Wong O. I., Schawinski K., Józsa G. I. G., Urry C. M., Lintott C. J., Simmons B. D., Kaviraj S., Masters K. L., 2015, MNRAS, 447, 3311