The Optical Afterglow of GW170817: An Off-axis Structured Jet and Deep Constraints on a Globular Cluster Origin
Abstract
We present a revised and complete optical afterglow light curve of the binary neutron star merger GW170817, enabled by deep Hubble Space Telescope (HST) F606W observations at days post-merger, which provide a robust optical template. The light curve spans days, and is fully consistent with emission from a relativistic structured jet viewed off-axis, as previously indicated by radio and X-ray data. Combined with contemporaneous radio and X-ray observations, we find no spectral evolution, with a weighted average spectral index of , demonstrating that no synchrotron break frequencies evolve between the radio and X-ray bands over these timescales. We find that an extrapolation of the post-peak temporal slope of GW170817 to the luminosities of cosmological short GRBs matches their observed jet break times, suggesting that their explosion properties are similar, and that the primary difference in GW170817 is viewing angle. Additionally, we place a deep limit on the luminosity and mass of an underlying globular cluster of , or , at least 4 standard deviations below the peak of the globular cluster mass function of the host galaxy, NGC4993. This limit provides a direct and strong constraint that GW170817 did not form and merge in a globular cluster. As highlighted here, HST (and soon JWST) enables critical observations of the optical emission from neutron star merger jets and outflows.
1 Introduction
The discovery of optical light from the first binary neutron star merger, GW170817 (Abbott et al., 2017a; Arcavi et al., 2017; Coulter et al., 2017; Lipunov et al., 2017; Soares-Santos et al., 2017; Tanvir et al., 2017; Valenti et al., 2017) localized the event to a projected distance of kpc from its host galaxy NGC4993 (Blanchard et al., 2017; Lyman et al., 2017), and provided a precise position for follow-up observations across the electromagnetic spectrum (e.g., Abbott et al. 2017b). Energy released from the radioactive decay of heavy elements synthesized in the merger ejecta (resulting in a “kilonova”; Metzger et al. 2010) dominated the optical emission at early times, and its characterization was primarily led by ground-based observations (Andreoni et al., 2017; Arcavi et al., 2017; Cowperthwaite et al., 2017; Chornock et al., 2017; Coulter et al., 2017; Díaz et al., 2017; Drout et al., 2017; Kasliwal et al., 2017; Lipunov et al., 2017; Nicholl et al., 2017; Pian et al., 2017; Pozanenko et al., 2017; Smartt et al., 2017; Tanvir et al., 2017; Troja et al., 2017; Utsumi et al., 2017; Valenti et al., 2017; Villar et al., 2017). At a few weeks post-merger, the field became inaccessible to optical facilities. When GW170817 emerged from solar conjunction at days, the non-thermal afterglow emission, which results from relativistic material interacting with the surrounding medium, outshined the kilonova. The study of this second phase in the optical band was enabled by the Hubble Space Telescope (HST) (Alexander et al., 2018; Lyman et al., 2018; Margutti et al., 2018; Lamb et al., 2019a; Piro et al., 2019), which was the only facility with the sensitivity to securely detect the source at these epochs, due to a combination of intrinsic faintness of the afterglow and contaminating light from NGC4993.
In conjunction with ongoing radio and X-ray campaigns, the optical afterglow probes the relativistic outflow from the merger. Several studies based primarily on the radio and X-ray observations of GW170817 have converged on a structured jet model, in which the bulk of the energy is carried by a relativistic jet, surrounded by less-collimated, slower material (Alexander et al., 2018; Lazzati et al., 2018; Margutti et al., 2018; Mooley et al., 2018a, b; Troja et al., 2018a; Wu & MacFadyen, 2018). These studies have also shown that at days post-merger, the broad-band spectral energy distribution (SED) follows a single power law characterized by . Notably, the optical band provides an important anchor between the nine orders of magnitude in frequency from the radio to the X-ray bands.
Thus far, extracting the flux from the optical counterpart of GW170817 has relied upon modeling the surface brightness profile of NGC4993 and subtracting its contribution. However, the morphology of NGC4993 is complex, and characterized by dust lanes and concentric shells (Blanchard et al., 2017; Levan et al., 2017; Palmese et al., 2017), making accurate and uniform photometry extremely challenging. Thus, previous studies which utilized optical data suffer from a combination of imperfect galaxy subtraction and non-uniform photometric methods (Alexander et al., 2018; Lyman et al., 2018; Margutti et al., 2018; Lamb et al., 2019a; Piro et al., 2019).
Here, we present a deep HST/F606W observation of GW170817 at days, which serves as the first robust optical template for the late-stage afterglow emission, against which we can subtract earlier epochs. This enables reliable and uniform photometry of the optical afterglow for the first time. We use the observation to produce a complete and revised light curve of the optical afterglow in the F606W filter, as well as a direct and strong limit on an underlying globular cluster (GC) to constrain the formation of its progenitor. In the following sections, we present the new and archival observations used in this study (§2), the details of the image subtraction and broad-band spectral fitting (§3), a discussion of the afterglow properties in the context of short GRBs and the limit with respect to the globular cluster mass function of NGC4993 (§4), and concluding remarks (§5).
All magnitudes in this paper are in the AB system and corrected for a Galactic extinction of (; Schlafly & Finkbeiner 2011). Reported uncertainties correspond to confidence. We employ a standard CDM cosmology with , , and km s-1 Mpc-1 (Bennett et al., 2014). We adopt a distance to both NGC4993 and the afterglow of Mpc (Cantiello et al., 2018).
| Mid-time | Instrument | Exp. Time | AB Mag | Program ID | ||
|---|---|---|---|---|---|---|
| (UT) | (d) | (s) | (Jy) | |||
| 2017 Dec 6.022 | 110.49 | WFC3/UVIS2 | 2264 | 14270 | ||
| 2018 Jan 1.573 | 137.04 | ACS/WFC | 2120 | 15329 | ||
| 2018 Jan 29.721 | 165.19 | WFC3/UVIS | 2372 | 14607 | ||
| 2018 Feb 5.740 | 172.21 | WFC3/UVIS2 | 2400 | 14771 | ||
| 2018 Mar 14.626 | 209.10 | WFC3/UVIS | 2432 | 14607 | ||
| 2018 Mar 23.895 | 218.37 | ACS/WFC | 2120 | 15329 | ||
| 2018 Jun 10.327 | 296.80 | WFC3/UVIS2 | 5220 | 14771 | ||
| 2018 Jul 11.752a | 328.22 | WFC3/UVIS2 | 14070 | 15482 | ||
| 2018 Jul 20.357 | 336.83 | ACS/WFC | 2120 | 15329 | ||
| 2018 Aug 14.852b | 362.32 | WFC3/UVIS2 | 14070 | 15482 | ||
| 2019 Mar 24.659c | 584.13 | ACS/WFC | 26912 | 15606 |
Note. — Times are quoted in the observer frame. All observations are taken with the F606W filter. Limits corrrespond to confidence and uncertainties correspond to . Magnitudes are corrected for Galactic extinction (Schlafly & Finkbeiner, 2011).
a Two separate visits on 2018 Jul 10 and 2018 Jul 13 UT.
b Two separate visits on 2018 Aug 14 and 2018 Aug 15 UT.
c Two separate visits on 2019 Mar 21 and 2019 Mar 27 UT.
2 Observations
2.1 A Deep F606W Observation
We obtained HST observations of GW170817 with the Advanced Camera for Surveys (ACS) under Program 15606 (PIs: Fong, Margutti). The observations were performed in the F606W filter over two visits on 2019 Mar 21 UT and 2019 Mar 27 UT for a total on-source time of 26912 sec (6 orbits).
We retrieve calibrated FLC images from the Mikulski Archive for Space Telescopes (MAST) archive111https://archive.stsci.edu/hst/; https://doi.org/10.17909/t9-6qez-fw41 (catalog https://doi.org/10.17909/t9-6qez-fw41), pre-corrected for charge transfer efficiency. We used tasks as part of the Drizzlepac software package (Gonzaga, 2012) and IRAF (Tody, 1986, 1993) to process the data. We used the astrodrizzle task to create a combined drizzled image for each visit, using final_scale = pixel-1 and final_pixfrac = 0.8, and then aligned the images to a common early epoch using the tweakreg task (described in §3.1) with relative astrometric uncertainties of mas ( HST pixels). We used IRAF/imcombine to combine the images from both visits. The mid-time of the final combined image corresponds to days, where is the time since the gravitational wave trigger (2017 August 17 at 12:41:04 UT; Abbott et al. 2017a).
2.2 Archival Observations
Since our study concentrates on the optical afterglow emission of GW170817, we retrieve images from MAST taken with ACS and the Wide Field Camera 3 (WFC3) in the F606W filter at days. The observations comprise ten epochs spanning 2017 Dec 6 to 2018 Aug 14 UT, corresponding to days. The details of all of the HST/F606W observations are displayed in Table 1. Results from these observations were previously reported in Alexander et al. (2018); Margutti et al. (2018); Lyman et al. (2018); Troja et al. (2018c); Lamb et al. (2019a) and Piro et al. (2019).
We processed all images in the same manner as described in §2.1. For observations taken within a few days of each other with the same instrument, we combine the visits to increase the signal-to-noise ratio and report them as a single epoch. In addition to our 2019 March observations, this also applies to observations over 2018 Jul 10-13 UT and 2018 Aug 14-15 UT.

3 Analysis & Results
3.1 Astrometry
We performed absolute astrometry of the first epoch in our sequence, 2017 December 6 UT, to the Pan-STARRS 1 catalog (Chambers et al., 2016) using 33 point sources in common with IRAF/ccmap and ccsetwcs. The resulting absolute astrometric tie uncertainty is (). We align all subsequent images to this epoch using the tweakreg task as part of the Drizzlepac package, which uses common sources to align the images in WCS to sub-pixel precision. For each image, tweakreg uses 83-147 sources, with a relative astrometric tie error range of mas. Using Source Extractor (Bertin & Arnouts, 1996), we derive an afterglow position based on the 2017 December 6 epoch of 13h 09m 48.07s and (J2000) with an uncertainty of (including a positional uncertainty for the afterglow centroid of mas). This position is consistent with that of the kilonova (e.g., Soares-Santos et al. 2017) and we use it for our subsequent photometric analysis.
3.2 A New Template
To measure the upper limit on the afterglow at the position of GW170817 in the 2019 March observation, we first subtract off the smooth galaxy background which we model with a Sérsic surface brightness profile using the GALFIT software package (Peng et al., 2007). In GALFIT we employ a point-spread function (PSF) empirically determined from stars in the image using IRAF/daophot. We use IRAF/addstar to inject artificial point sources at the position of GW170817 in the GALFIT residual image, with the PSF determined above. We then perform photometry on each injected source using a aperture and apply the appropriate aperture correction to correct to infinity (Sirianni et al., 2005). We repeat the experiment with sources of varying brightness to determine the flux level that would be recovered at the level, resulting in a upper limit of at the position of GW170817.
As previously discussed in Blanchard et al. (2017), a Sérsic galaxy model provides an inadequate description of the galaxy light, which exhibits large-scale shell structure and dust lanes, apparent in the residuals and in the resulting goodness-of-fit value ( for 4374194 d.o.f.). This structure, along with the small-scale brightness fluctuations, are known limitations for deriving a limit with the galaxy subtraction method.
Given the limitations of the simple analytic model of the galaxy light, we explore an alternative method to subtract the background to improve our limit. We apply a median filter to the original image using a pixel box (corresponding to or kpc on a side) using IRAF/median, where the box size is chosen so that no evidence of structure on the scale of the PSF is detectable in the median-filtered image. We then subtract the median-filtered image from the original image to produce a median-subtracted image suitable for photometry (Figure 1).
We perform photometry of faint sources in the median-subtracted images using IRAF/phot, finding a limit of mag. We also inject fake point sources at the position of GW170817 using the empirically-derived PSF from the full image and recover a similar limit. To check the sensitivity of the result to the details of the filter, we also produce similar median-subtracted images made with 40 and 50-pixel filters. The final limit is not sensitive to these details, demonstrating that this method is robust. We use this limit for the remainder of our analysis, since the non-detection of any source to this limit makes this image suitable as a template.
3.3 Image Subtraction and Afterglow Photometry
We use the HOTPANTS software package (Becker, 2015) to subtract the 2019 March original image from each of the earlier epochs, and convolve each residual image to the pixel scale of the template ( pixel-1). The residual images are shown in Figure 1. Although the majority of imaging was performed with the UVIS detector, and the template is taken with ACS, the difference in photometric calibration between ACS and UVIS is negligible in the F606W filter compared to the measured uncertainties in afterglow photometry (see below), with typical differences of mag (Deustua & Mack, 2017). Thus, we can reliably perform aperture photometry directly on the residual images.
Using IRAF/phot package, we perform aperture photometry of the afterglow. We use a aperture corresponding to 2.5FWHM, fixed at the position of the afterglow in all epochs. For each of the ACS epochs, we calculate aperture corrections by performing photometry in and -radius apertures for 10-12 bright, unsaturated stars in each of the original fields, resulting in initial corrections of mag. We then apply tabulated encircled energy corrections to correct the apertures to infinity (Bohlin, 2016). For UVIS, we use the tabulated corrections222http://www.stsci.edu/hst/wfc3/analysis/uvis_ee to correct the -radius apertures to infinity, typically mag.
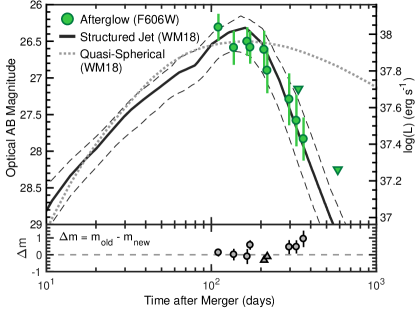
In all except the epoch at days (2018 Jul 20), a source at the afterglow position is detected at the level. The non-detection in that single epoch is unsurprising given the relatively shallow depth of the image (Table 1). To derive the upper limit for this epoch, we performe aperture photometry of faint sources near the position of the afterglow. The resulting photometry is listed in Table 1 and is displayed in Figure 2. For comparison, we also show the structured jet and quasi-spherical models that best fit the radio through X-ray evolution to days (Wu & MacFadyen, 2018).
3.4 Broad-band Afterglow Fitting
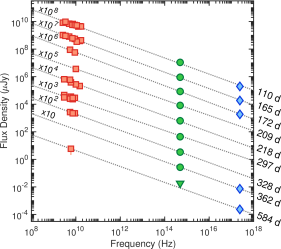
To place the HST photometry in the context of the broad-band afterglow and quantify the broad-band spectral evolution at days, we collect fluxes from the literature in the radio and X-ray bands at contemporaneous epochs, defined here to be within days of HST observations. In the radio band, there are available data for all epochs except at , days, and days. The data are taken with the Karl G. Jansky Very Large Array (VLA) and the Australia Telescope Compact Array (ATCA), spanning 2.5-17 GHz (Alexander et al., 2018; Dobie et al., 2018; Margutti et al., 2018; Mooley et al., 2018a, b, c; Troja et al., 2018c). We also use a 6 GHz VLA observation at days, presented in Hajela et al. (in prep.).
In the X-ray band, we find relevant comparison Chandra X-ray Observatory observations at five epochs. Previous analyses of these observations have appeared in Nynka et al. (2018); Margutti et al. (2018); Troja et al. (2018a); Pooley et al. (2018); Ruan et al. (2018); Troja et al. (2018c); Lin et al. (2019). Here, we use the fluxes and spectral parameters calculated in Hajela et al. (in prep.), which serves as a uniform analysis of all available Chandra data of the X-ray afterglow of GW170817 to days. To enable comparison of the X-ray observations to the optical and radio data, we convert the keV X-ray fluxes to flux densities, , at a fiducial energy of 1 keV, using the derived photon index, at each epoch, where and . The radio and X-ray data, along with our HST photometry, are displayed in Figure 3.
We use -minimization to fit the broad-band spectrum at each epoch to a single power law model in the form , characterized by spectral index and a flux normalization parameter. We fit all of the available data at each epoch separately. The resulting fits have , demonstrating that the single power law model is adequate to fit the data over all epochs (Figure 3). The values for and uncertainties are given in Table 2 and the temporal evolution is displayed in Figure 4. We calculate a weighted average of the spectral index across all epochs considered here of .
| Data Reference‡ | ||
|---|---|---|
| (d) | ||
| 110.49 | 1-3 | |
| 165.19 | 1, 3 | |
| 172.21 | 3, 4 | |
| 209.10 | 5 | |
| 218.37 | 5-7 | |
| 296.80 | 5-6, 8 | |
| 328.22 | 8 | |
| 362.32 | 3 | |
| 584.13 | 3 | |
| All, weighted avg. |
Note. — † This is the epoch of the HST observation. Radio and X-ray observations with days were considered contemporaneous and were included in the power-law fits.
‡ Literature references for the plotted radio and X-ray data. All HST data points are from this work.
References: (1) Margutti et al. (2018); (2) Mooley et al. (2018c); (3) Hajela et al. (in prep.); (4) Dobie et al. (2018); (5) Mooley et al. (2018b); (6) Alexander et al. (2018); (7) Piro et al. (2019); (8) Troja et al. (2018c)
4 Discussion
4.1 Off-Axis Afterglow Properties
We present a revised light curve of the optical afterglow of GW170817, relative to previous studies which have used subsets of HST observations to derive measurements and upper limits of the afterglow in the F606W filter (Alexander et al., 2018; Margutti et al., 2018; Lyman et al., 2018; Lamb et al., 2019a; Piro et al., 2019). We calculate the difference between the published values and the values presented in this work (Figure 2). Overall, we find that the afterglow in most epochs is systematically brighter than previously reported, with differences of mag between published values and the values presented in this work (Figure 2), and an increase in as the afterglow becomes fainter. Our analysis also recovers a source in two observations which were previously reported as upper limits (Alexander et al., 2018; Piro et al., 2019). The differences with respect to published values are not surprising given the non-uniformity of methods used for both galaxy subtraction and photometry, and the complicated structure of NGC4993 which makes accurate galaxy subtraction, and thus background estimation, challenging without a proper template.
The temporal evolution of the optical afterglow exhibits a flattening at days, followed by a steep decline at days (Figure 2). The entire data set can be fit with a broken power-law with and (where ), with a break time of days depending on the smoothness of the break. The large change in slope signifies that we are witnessing the peak, followed by a rapid decline after the jet break (Rhoads, 1999). For synchrotron emission, the post jet-break decline is expected to evolve as , where is the electron power-law index describing the input energy distribution of electrons (Sari et al., 1999), and thus we can infer a value of from the optical light curve.
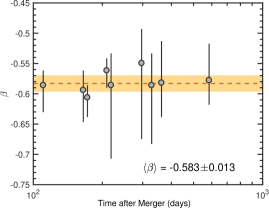
We can obtain an independent constraint on from the spectral behavior of the source. Combined with the radio and X-ray evolution, the afterglow of GW170817 maintains the same spectral index within uncertainties for the duration of the HST observations (Figure 3-4). This demonstrates that the radio, optical and X-ray bands all lie on the same spectral slope between (where is the peak frequency and is the cooling frequency of the synchrotron spectrum; e.g., Sari et al. 1998; Granot & Sari 2002) out to days, and that no break frequencies evolve between the radio and X-ray bands on these timescales. The inferred value of , is fully consistent with the value derived from the light curve, as well as with previous works based on broad-band data out to days (Margutti et al., 2018; Alexander et al., 2018; Wu & MacFadyen, 2018; Lamb et al., 2019a).
A comparison of the HST light curve to models which best fit the radio and X-ray light curves to days (Margutti et al., 2018; Wu & MacFadyen, 2018; Alexander et al., 2018; Kathirgamaraju et al., 2019) demonstrates that the optical emission at days is emanating from a relativistic structured jet viewed off-axis (Figure 2). Moreover, models of mildly-relativistic quasi-spherical outflows, in which the jet (if produced at all) fails to break out of the ejecta, over-predict the observed optical flux by times at days. This provides clear confirmation from the optical emission that we are viewing an off-axis jet as opposed to a quasi-spherical outflow. This supports previous studies which reached a similar conclusion based primarily on temporal and spectral behavior within a single band (D’Avanzo et al., 2018; Lyman et al., 2018; Mooley et al., 2018b; Nynka et al., 2018; Lamb et al., 2019a) and broad-band data (Alexander et al., 2018; Lazzati et al., 2018; Margutti et al., 2018; Troja et al., 2018c; Wu & MacFadyen, 2018). This is also corroborated by the detection of super-luminal motion and constraints on the jet size from very long baseline interferometric observations (Mooley et al., 2018a; Ghirlanda et al., 2019), although it has also been shown that the source motion is expected to be indistinguishable between jetted and quasi-spherical models for days (Zrake et al., 2018).
4.2 Comparison to Short GRB Afterglows
GW170817 represents the first detection of an off-axis optical afterglow, while cosmological short GRBs represent those events seen close to or on-axis. The presence of relativistic jets in both types of events is one of several characteristics that signify a common origin. The similarity in their inferred explosion properties also suggest that the primary difference in behavior between short GRB jets and that of GW170817 is the viewing angle (Fong et al., 2017; Kathirgamaraju et al., 2018; Lazzati et al., 2018; Salafia et al., 2019; Wu & MacFadyen, 2019).
Here, we explore this in another way by connecting the optical properties of GW170817 with short GRBs. If GW170817 and cosmological short GRBs share the same values for their explosion properties, in particular a combination of the jet opening angle, kinetic energy and circumburst density, then regardless of observer angle, the post-jet break behavior of their afterglows should asymptote to the same declining light curve at late times (van Eerten & MacFadyen, 2012). In this case, an extrapolation of the post-peak decline of GW170817 should intersect with the short GRB population at their expected jet break times in luminosity-space.
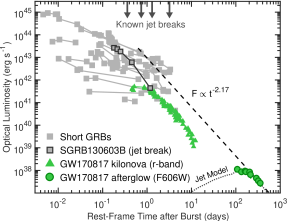
We collect data of all short GRBs with multiple optical afterglow detections, comprising 25 events (updated from Fong et al. 2015, and including the afterglow and kilonova of the short GRB 160821B; Lamb et al. 2019b; Troja et al. 2019). We use the burst redshifts to obtain the afterglow luminosities as a function of rest-frame time, assuming (the median value of the population; Berger 2014; Fong et al. 2017) for bursts without determined redshifts. The short GRB light curves are shown in Figure 5, highlighting the single source with a jet break measured in the optical band (GRB 130603B; Fong et al. 2014). The extrapolation of the post-peak slope of from GW170817 intersects short GRBs at days (rest-frame). Indeed, the short GRBs with measured jet breaks have a range of jet break times that are similar, days (Figure 5; Burrows et al. 2006; Soderberg et al. 2006; Fong et al. 2012, 2014; Troja et al. 2016). This simple exercise is consistent with the notion that the combination of jet opening angle, kinetic energy, and circumburst density of GW170817 are similar to the population of short GRBs. As learned from short GRBs, we expect there to be inherent diversity in these properties that will manifest itself as a spread in behavior (Fong et al., 2015).
A further comparison of optical emission from short GRBs to the kilonova of GW170817 (compiled in Villar et al. 2017) clearly demonstrates that for on-axis events, short GRB afterglows are likely to outshine their optical kilonovae at all epochs if the luminosity and evolution of GW170817 is representative of the population. However, the overlap between the kilonova of GW170817 and the low-luminosity end of the short GRB distribution, including the claimed kilonovae in the short GRBs 150101B and 160821B (Troja et al., 2018b; Lamb et al., 2019b; Troja et al., 2019) leaves open the possibility that a small subset of short GRBs are discovered slightly off-axis and the optical emission is in fact dominated by the kilonova in these cases. Finally, Figure 5 shows that if GW170817 had not been in solar conjunction at days, we would have been able to witness the rise of the optical afterglow starting at days and potentially the intersection with the kilonova emission.
4.3 Constraints on a Globular Cluster Origin
We now explore GW170817 in the context of its progenitor formation. Previous studies have used the stellar mass, stellar population age, star formation history of NGC4993, and the location of GW170817 with respect to the host galaxy center, to infer properties of the progenitor system, including the kick velocity, helium-star mass, and initial separation (Abbott et al., 2017c; Blanchard et al., 2017). Overall, these studies found consistency between the progenitor properties and the distributions of Galactic binary neutron stars which formed via isolated binary evolution (e.g., Wong et al. 2010). On the other hand, early simulations of interactions in globular clusters (GCs) have suggested that their dense stellar environments can also provide a significant channel of neutron star mergers and short GRBs, through dynamical encounters, tidal capture, or in-cluster primordial evolution (e.g., Grindlay et al. 2006; Ivanova et al. 2008; Lee et al. 2010). Moreover, the observed double neutron star system B2127+11C in the GC M15 is expected to merge within a Hubble time (Anderson et al., 1990; Tauris et al., 2017), motivating a search for a GC at or near the position of GW170817.
At the distance of GW170817, GCs would appear unresolved or marginally resolved in our HST imaging depending on the S/N of the source. To compare the HST limit to the luminosities of GCs, we adopt the globular cluster luminosity function (GCLF) derived from prior ACS/F606W imaging. The GCLF is characterized by a Gaussian in magnitude space with a mean and width of mag (Lee et al., 2018). Using mag (Willmer, 2018), this translates to log() = . Adopting a mass-to-light ratio of (Strader et al., 2009; Baumgardt, 2017) the globular cluster mass function (GCMF) can be approximated as a Gaussian with a mean and width of log() = . We note that we do not carry out an independent GCLF determination based on our imaging as this would yield incremental returns compared to Lee et al. (2018), due to the difficulty in confirming the GC nature of sources well below the GCLF peak.
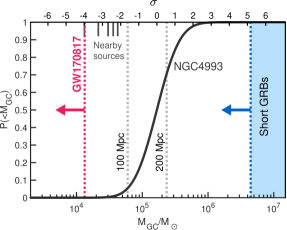
With our deep HST observation at days, we place a constraint of mag, or , on any underlying cluster. It is instructive to compare this limit to the GCMF as generally the rate of in-cluster interactions, and thus mergers, increases with cluster mass (Pooley et al., 2003). A comparison to the GCMF of NGC4993 places a limit of , below the mean; only of the total mass in GCs in NGC4993 is below this limit (Figure 6). This limit is also constraining enough to rule out of the mass function of young massive clusters, corroborating the lack of any young stellar populations in the galaxy (Portegies Zwart et al., 2010; Blanchard et al., 2017; Levan et al., 2017).
To place this limit in the context of previous limits from cosmological short GRBs, we search for the deepest available optical limits on persistent sources from low-redshift () events obtained from previous optical imaging. We find that the most constraining limit is from GRB 050709 at (Fox et al., 2005), which corresponds to , above the GCMF mean for NGC4993333We note that for the less massive star-forming host galaxy of GRB 050709, the peak of its GCMF is expected to be similar, while the width may be narrower (e.g., Brodie & Strader 2006). In this case, the limit would correspond to when compared to the GCMF of its host galaxy. (Figure 6). Thus, while short GRBs remain too distant to offer a firm conclusion on progenitor formation channels from direct imaging, the deep observations presented here place a direct and strong constraint on an in situ GC origin for a binary neutron star merger. While previous limits have been placed on an existing GC using more shallow, pre-explosion imaging (Blanchard et al., 2017; Levan et al., 2017; Pan et al., 2017) as well as indirect inference from the fading behavior of the afterglow (Lamb et al., 2019a), our analysis provides the deepest existing limit based on direct imaging of the event location.
Finally, we explore the possibility that the progenitor system of GW170817 was formed in a GC and ejected before merger (e.g., Bae et al. 2014; Andrews & Mandel 2019), using the median-subtracted 2019 March observation to identify nearby potential GCs. Using aperture photometry, we identify six sources with significance within a projected distance of pc (). One of the sources clearly has an extended PSF (previously identified as a GC candidate in Pan et al. 2017) and is most likely a background galaxy, while the five remaining sources are too faint to constrain their PSFs. If they are in fact GCs, their inferred masses are and contain at most of the GC mass of NGC4993, making it unlikely for the progenitor to have formed there. In general, the progenitor system would have to travel at a minimum of the escape velocity of the GC, a few tens of km s-1 for typical GC masses and sizes, and for a potentially long and uncertain merger timescale. Coupled with the old stellar population of the host galaxy, Gyr (Blanchard et al., 2017), it would thus be extremely challenging to correlate GW170817 with its parent GC.
Looking forward, HST imaging to similarly deep limits of future well-localized gravitational wave events will provide meaningful limits on an in situ GC origin to 200 Mpc (assuming that the GCMF across galaxies is fairly constant; cf. Strader et al. 2006). Specifically, HST observations to mag for events at Mpc ( Mpc) will be sensitive to () of the GCMF (Figure 6).
5 Conclusions & Future Outlook
We present the first observation following GW170817 in which an optical source is not detected to deep limits, allowing us to determine the complete F606W light curve of its optical afterglow from days. The afterglow evolution is fully consistent with the optical emission emanating from a relativistic structured jet at an observer angle of , as indicated by radio and X-ray observations. This study highlights the importance of template observations in determining accurate light curves, especially for the late and faintest stages of evolution. This is especially important for local events detected by gravitational wave facilities which are embedded in their host galaxies, for which galactic low surface brightness features are more prominent and cannot be easily modeled.
We also compare GW170817 to on-axis cosmological short GRBs. Extrapolating the optical post-peak temporal evolution of GW170817 to the luminosities of short GRBs, the predicted jet break times for short GRBs are consistent with their observed breaks. Thus, we find that the two populations can be easily connected if their explosion properties (e.g., energetics, circum-merger densities and jet opening angles) are similar, and that the factor which primarily dictates their different evolution is the observer angle. Continued studies of short GRBs to days, as well as similarly in-depth studies of local binary neutron star mergers, will continue to shed light on any intrinsic differences in these populations.
We provide a deep and direct constraint on the presence of an underlying globular cluster to , providing direct evidence that GW170817 did not form and merge in a cluster in situ at the level. However, we cannot place meaningful constraints on the possibility that the progenitor system was dynamically formed and ejected from its parent cluster. Future simulations which calculate accurate rates of such systems taking into account the full cluster evolution, coupled with further observational constraints on mergers at Mpc, will help to elucidate this formation channel.
Finally, we remark that HST had a singular role in the optical afterglow of the relatively nearby GW170817. As gravitational wave facilities increase in sensitivity, most binary neutron star mergers will be detected farther away. If the optical luminosity of the GW170817 afterglow is representative, the advent of extremely large telescopes and future space-based initiatives, such as JWST will play an incredibly important role in the detection and characterization of off-axis afterglows from binary neutron star (and neutron star-black hole) mergers.
Acknowledgments
W.F. acknowledges support by the National Science Foundation under grant Nos. AST-1814782 and AST-1909358. Support for Program number 15606 was provided by the National Aeronautics and Space Administration through grant HST-GO-15606.001-A from the Space Telescope Science Institute, which is operated by the Association of Universities for Research in Astronomy, Incorporated, under NASA contract NAS5-26555, and Chandra Award Number G09-20058A issued by the Chandra X-ray Center, which is operated by the Smithsonian Astrophysical Observatory for and on behalf of NASA under contract NAS8-03060. Based on observations made with the NASA/ESA Hubble Space Telescope, obtained from the data archive at the Space Telescope Science Institute. The new HST data used in this paper can be found in MAST: https://doi.org/10.17909/t9-6qez-fw41 (catalog https://doi.org/10.17909/t9-6qez-fw41). This research was supported in part by the National Science Foundation under Grant No. NSF PHY-1748958. The National Radio Astronomy Observatory is a facility of the National Science Foundation operated under cooperative agreement by Associated Universities, Inc. MN is supported by a Royal Astronomical Society Research Fellowship. Research by DJS is supported by NSF grants AST-1821987, AST-1821967, AST-1813708, AST-1813466, and AST-1908972. JS acknowledges support from the Packard Foundation. KDA acknowledges support provided by NASA through the NASA Hubble Fellowship grant HST-HF2-51403.001 awarded by the Space Telescope Science Institute, which is operated by the Association of Universities for Research in Astronomy, Inc., for NASA, under contract NAS5-26555. The Berger Time-Domain Group is supported in part by NSF grant AST-1714498 and NASA grant NNX15AE50G. The Margutti group at Northwestern acknowledges support provided by the National Aeronautics and Space Administration through grant HST-GO-15606.001-A, through Chandra Awards Number GO9-20058A, DD8-19101A and DDT-18096A issued by the Chandra X-ray Center, which is operated by the Smithsonian Astrophysical Observatory for and on behalf of the National Aeronautics Space Administration under contract NAS8-03060. R.C. acknowledges support from NASA Chandra grant GO9-20058B.
References
- Abbott et al. (2017a) Abbott, B. P., et al. 2017a, Physical Review Letters, 119, 161101
- Abbott et al. (2017b) Abbott, B. P., et al. 2017b, ApJ, 848, L12
- Abbott et al. (2017c) Abbott, B. P., et al. 2017c, ApJ, 850, L40
- Alexander et al. (2018) Alexander, K. D., et al. 2018, ApJ, 863, L18
- Anderson et al. (1990) Anderson, S. B., Gorham, P. W., Kulkarni, S. R., Prince, T. A., & Wolszczan, A. 1990, Nature, 346, 42
- Andreoni et al. (2017) Andreoni, I., et al. 2017, PASA, 34, e069
- Andrews & Mandel (2019) Andrews, J. J., & Mandel, I. 2019, ApJ, 880, L8
- Arcavi et al. (2017) Arcavi, I., et al. 2017, Nature, 551, 64
- Bae et al. (2014) Bae, Y.-B., Kim, C., & Lee, H. M. 2014, MNRAS, 440, 2714
- Baumgardt (2017) Baumgardt, H. 2017, MNRAS, 464, 2174
- Becker (2015) Becker, A. 2015, HOTPANTS: High Order Transform of PSF ANd Template Subtraction, Astrophysics Source Code Library
- Bennett et al. (2014) Bennett, C. L., Larson, D., Weiland, J. L., & Hinshaw, G. 2014, ApJ, 794, 135
- Berger (2014) Berger, E. 2014, ARA&A, 52, 43
- Bertin & Arnouts (1996) Bertin, E., & Arnouts, S. 1996, A&AS, 117, 393
- Blanchard et al. (2017) Blanchard, P. K., et al. 2017, ApJ, 848, L22
- Bohlin (2016) Bohlin, R. C. 2016, AJ, 152, 60
- Brodie & Strader (2006) Brodie, J. P., & Strader, J. 2006, ARA&A, 44, 193
- Burrows et al. (2006) Burrows, D. N., et al. 2006, ApJ, 653, 468
- Cantiello et al. (2018) Cantiello, M., et al. 2018, ApJ, 854, L31
- Chambers et al. (2016) Chambers, K. C., et al. 2016, ArXiv e-prints
- Chornock et al. (2017) Chornock, R., et al. 2017, ApJ, 848, L19
- Coulter et al. (2017) Coulter, D. A., et al. 2017, Science, 358, 1556
- Cowperthwaite et al. (2017) Cowperthwaite, P. S., et al. 2017, ApJ, 848, L17
- D’Avanzo et al. (2018) D’Avanzo, P., et al. 2018, A&A, 613, L1
- Deustua & Mack (2017) Deustua, S. E., & Mack, J. 2017, Comparing the ACS/WFC and WFC3/UVIS Calibration and Photometry, Technical report
- Díaz et al. (2017) Díaz, M. C., et al. 2017, ApJ, 848, L29
- Dobie et al. (2018) Dobie, D., et al. 2018, ApJ, 858, L15
- Drout et al. (2017) Drout, M. R., et al. 2017, Science, 358, 1570
- Fong et al. (2017) Fong, W., et al. 2017, ApJ, 848, L23
- Fong et al. (2015) Fong, W., Berger, E., Margutti, R., & Zauderer, B. A. 2015, ApJ, 815, 102
- Fong et al. (2012) Fong, W., et al. 2012, ApJ, 756, 189
- Fong et al. (2014) Fong, W., et al. 2014, ApJ, 780, 118
- Fox et al. (2005) Fox, D. B., et al. 2005, Nature, 437, 845
- Ghirlanda et al. (2019) Ghirlanda, G., et al. 2019, Science, 363, 968
- Gonzaga (2012) Gonzaga, S. e. 2012, The DrizzlePac Handbook
- Granot & Sari (2002) Granot, J., & Sari, R. 2002, ApJ, 568, 820
- Grindlay et al. (2006) Grindlay, J., Portegies Zwart, S., & McMillan, S. 2006, Nature Physics, 2, 116
- Ivanova et al. (2008) Ivanova, N., Heinke, C. O., Rasio, F. A., Belczynski, K., & Fregeau, J. M. 2008, MNRAS, 386, 553
- Kasliwal et al. (2017) Kasliwal, M. M., et al. 2017, Science, 358, 1559
- Kathirgamaraju et al. (2018) Kathirgamaraju, A., Barniol Duran, R., & Giannios, D. 2018, MNRAS, 473, L121
- Kathirgamaraju et al. (2019) Kathirgamaraju, A., Tchekhovskoy, A., Giannios, D., & Barniol Duran, R. 2019, MNRAS, 484, L98
- Lamb et al. (2019a) Lamb, G. P., et al. 2019a, ApJ, 870, L15
- Lamb et al. (2019b) Lamb, G. P., et al. 2019b, arXiv e-prints, arXiv:1905.02159
- Lazzati et al. (2018) Lazzati, D., Perna, R., Morsony, B. J., Lopez-Camara, D., Cantiello, M., Ciolfi, R., Giacomazzo, B., & Workman, J. C. 2018, Phys. Rev. Lett., 120, 241103
- Lee et al. (2018) Lee, M. G., Kang, J., & Im, M. 2018, ApJ, 859, L6
- Lee et al. (2010) Lee, W. H., Ramirez-Ruiz, E., & van de Ven, G. 2010, ApJ, 720, 953
- Levan et al. (2017) Levan, A. J., et al. 2017, ApJ, 848, L28
- Lin et al. (2019) Lin, E.-T., Yu, H.-F., & Kong, A. K. H. 2019, Journal of High Energy Astrophysics, 21, 1
- Lipunov et al. (2017) Lipunov, V. M., et al. 2017, ApJ, 850, L1
- Lyman et al. (2018) Lyman, J. D., et al. 2018, Nature Astronomy, 2, 751
- Lyman et al. (2017) Lyman, J. D., et al. 2017, MNRAS, 467, 1795
- Margutti et al. (2018) Margutti, R., et al. 2018, ApJ, 856, L18
- Metzger et al. (2010) Metzger, B. D., et al. 2010, MNRAS, 406, 2650
- Mooley et al. (2018a) Mooley, K. P., et al. 2018a, Nature, 561, 355
- Mooley et al. (2018b) Mooley, K. P., et al. 2018b, ApJ, 868, L11
- Mooley et al. (2018c) Mooley, K. P., et al. 2018c, Nature, 554, 207
- Nicholl et al. (2017) Nicholl, M., et al. 2017, ApJ, 848, L18
- Nynka et al. (2018) Nynka, M., Ruan, J. J., Haggard, D., & Evans, P. A. 2018, ApJ, 862, L19
- Palmese et al. (2017) Palmese, A., et al. 2017, ApJ, 849, L34
- Pan et al. (2017) Pan, Y. C., et al. 2017, ApJ, 848, L30
- Peng et al. (2007) Peng, C. Y., Ho, L. C., Impey, C. D., & Rix, H. W. 2007, in Bulletin of the American Astronomical Society, Vol. 39, American Astronomical Society Meeting Abstracts, 804
- Pian et al. (2017) Pian, E., et al. 2017, Nature, 551, 67
- Piro et al. (2019) Piro, L., et al. 2019, MNRAS, 483, 1912
- Pooley et al. (2018) Pooley, D., Kumar, P., Wheeler, J. C., & Grossan, B. 2018, ApJ, 859, L23
- Pooley et al. (2003) Pooley, D., et al. 2003, ApJ, 591, L131
- Portegies Zwart et al. (2010) Portegies Zwart, S. F., McMillan, S. L. W., & Gieles, M. 2010, ARA&A, 48, 431
- Pozanenko et al. (2017) Pozanenko, A., et al. 2017, Astronomy & Astrophysics (Caucasus), 1, 8
- Rhoads (1999) Rhoads, J. E. 1999, ApJ, 525, 737
- Ruan et al. (2018) Ruan, J. J., Nynka, M., Haggard, D., Kalogera, V., & Evans, P. 2018, ApJ, 853, L4
- Salafia et al. (2019) Salafia, O. S., Ghirlanda, G., Ascenzi, S., & Ghisellini, G. 2019, A&A, 628, A18
- Sari et al. (1999) Sari, R., Piran, T., & Halpern, J. P. 1999, ApJ, 519, L17
- Sari et al. (1998) Sari, R., Piran, T., & Narayan, R. 1998, ApJ, 497, L17
- Schlafly & Finkbeiner (2011) Schlafly, E. F., & Finkbeiner, D. P. 2011, ApJ, 737, 103
- Sirianni et al. (2005) Sirianni, M., et al. 2005, PASP, 117, 1049
- Smartt et al. (2017) Smartt, S. J., et al. 2017, Nature, 551, 75
- Soares-Santos et al. (2017) Soares-Santos, M., et al. 2017, ApJ, 848, L16
- Soderberg et al. (2006) Soderberg, A. M., et al. 2006, ApJ, 650, 261
- Strader et al. (2006) Strader, J., Brodie, J. P., Spitler, L., & Beasley, M. A. 2006, AJ, 132, 2333
- Strader et al. (2009) Strader, J., Smith, G. H., Larsen, S., Brodie, J. P., & Huchra, J. P. 2009, AJ, 138, 547
- Tanvir et al. (2017) Tanvir, N. R., et al. 2017, ApJ, 848, L27
- Tauris et al. (2017) Tauris, T. M., et al. 2017, ApJ, 846, 170
- Tody (1986) Tody, D. 1986, in Proc. SPIE, Vol. 627, Instrumentation in astronomy VI, ed. D. L. Crawford, 733
- Tody (1993) Tody, D. 1993, in Astronomical Society of the Pacific Conference Series, Vol. 52, Astronomical Data Analysis Software and Systems II, ed. R. J. Hanisch, R. J. V. Brissenden, & J. Barnes, 173
- Troja et al. (2019) Troja, E., et al. 2019, arXiv e-prints, arXiv:1905.01290
- Troja et al. (2018a) Troja, E., et al. 2018a, MNRAS, 478, L18
- Troja et al. (2017) Troja, E., et al. 2017, Nature, 551, 71
- Troja et al. (2018b) Troja, E., et al. 2018b, Nature Communications, 9, 4089
- Troja et al. (2016) Troja, E., et al. 2016, ApJ, 827, 102
- Troja et al. (2018c) Troja, E., et al. 2018c, arXiv e-prints, arXiv:1808.06617
- Utsumi et al. (2017) Utsumi, Y., et al. 2017, PASJ, 69, 101
- Valenti et al. (2017) Valenti, S., et al. 2017, ApJ, 848, L24
- van Eerten & MacFadyen (2012) van Eerten, H. J., & MacFadyen, A. I. 2012, ApJ, 751, 155
- Villar et al. (2017) Villar, V. A., et al. 2017, ApJ, 851, L21
- Willmer (2018) Willmer, C. N. A. 2018, ApJS, 236, 47
- Wong et al. (2010) Wong, T.-W., Willems, B., & Kalogera, V. 2010, ApJ, 721, 1689
- Wu & MacFadyen (2018) Wu, Y., & MacFadyen, A. 2018, ApJ, 869, 55
- Wu & MacFadyen (2019) Wu, Y., & MacFadyen, A. 2019, arXiv e-prints, arXiv:1905.02665
- Zrake et al. (2018) Zrake, J., Xie, X., & MacFadyen, A. 2018, ApJ, 865, L2