A NICER Look at Strong X-ray Obscuration in the Seyfert-2 Galaxy NGC 4388
Abstract
We present an analysis of the time-averaged spectrum of the Seyfert-2 active galaxy NGC 4388, obtained by NICER. The intrinsic strength of the reflection spectrum in NGC 4388, the large collecting area and favorable pass band of NICER, and a net exposure of 105.6 ks yielded an exceptionally sensitive spectrum. Using two independent families of models, the intrinsic spectrum from the central engine is found to be highly obscured but not Compton-thick. Enforcing physical self-consistency within each model, the independent treatments give formally consistent results: or . Past measurements made with Suzaku and XMM-Newton are in broad agreement with these column density values. A more recent measurement with NuSTAR (in late 2013) recorded a column density about twice as large; the robustness of this variability is reinforced by the use of consistent models and procedures. The neutral Fe K line in the NICER spectrum is nominally resolved and consistent with an origin in the optical broad line region (BLR). The data also require ionized absorption in the Fe K band, similar to the “warm absorbers” detected in Seyfert-1 active galactic nuclei (AGN). The low-energy spectrum is consistent with a set of ionized plasma components. We discuss these findings and note that the geometric inferences that derive from this analysis can be tested with XRISM and Athena.
1. Introduction
The nature of the obscuration that defines Seyfert-2 AGN remains a matter of study. The obscuring gas and dust may be associated with a distant, parsec-scale torus that covers about half of the sky, as seen from the central engine (e.g., Antonucci 1993). However, the obscuration could originate orders of magnitude closer to the black hole, at radii consistent with the optical broad line region (BLR). Some models of the BLR suggest that it is also dusty, and that the enhanced cross section of the dust is responsible for lifting the material above the plane of the disk (e.g., Czerny & Hryniewicz 2011, Czerny et al. 2015).
The light crossing time out to a parsec-scale torus is over three years, and Keplerian time scales at that radius are much longer. Thus, even variability on a time scale of months is not easy to reconcile with very distant obscuration. In a study of obscured AGN, Risaliti (2002) reported column density variations on the time scale of months in 23 of 24 cases, typically by factors of 2–3. NGC 4388 may represent one of the most extreme examples of such variability. In this AGN, Elvis et al. (2004) found significant absorption variability between observations separated by hours. That specific episode was an “unveiling event”, wherein the obscuring column was dramatically reduced. It is reasonable to expect, then, that the source could also display periods of greatly enhanced obscuration. However, despite widespread study and strong variability, NGC 4388 has never been observed in a Compton-thick state (). This may suggest that special conditions, such as chance alignment of distant clouds, are unlikely to cause a source to be observed as Compton-thick with any regularity.
X-ray emission line spectroscopy provides another angle on the nature and location of neutral absorption in obscured AGN. When cold gas is illuminated by hard X-rays, a characteristic “reflection” spectrum is produced (e.g., George & Fabian 1991). The most prominent part of a reflection spectrum is an Fe K emisison line. The strength of this line relative to the observed continuum can encode the fraction of the central engine that is covered by the reflector, and any velocity broadening to the line can be used to constrain the radial location of the obscuring and reflecting gas (for a recent general treatment of geometrical inferences, see Ramos Almeida & Ricci 2017).
In a study of Chandra gratings spectra of Seyfert-1 galaxies, Shu et al. (2010) found that the narrow Fe K emission line is consistent with being produced in the optical BLR in approximately half of the cases examined. This suggests that the BLR is plausibly the inner edge of the obscuration that is observed in Seyfert-2 galaxies. In a separate study of 13 Seyfert-1 AGN, Gandhi et al. (2015) found that the dust sublimation radius likely forms an outer envelope to the neutral Fe K line production zone. Recent focused studies of single sources also conclude that cold reflecting gas (that would be seen as obscuration in a Seyfert-2) is located within the optical BLR. The neutral Fe K line in the Seyfert-1 AGN NGC 7213 is resolved in a Chandra gratings spectrum, and clearly links the line to the optical broad line region (Bianche et al. 2008). In the Seyfert-1.5 AGN NGC 4151, asymmetry in the Fe K emission line is observed in the Chandra grating spectrum (Miller et al. 2018), suggesting an origin within the BLR or potentially smaller radii.
NGC 4388 is an Sb galaxy in the Virgo Cluster. Recent work has estimated its distance at Mpc (Sorce et al. 2014). In some obscured AGN, measurements of the black hole mass can be particularly difficult since broad emission lines are either weak or unobserved. However, NGC 4388 has an H2O megamaser in its disk; exploiting this gives an extremely precise black hole mass of (Kuo et al. 2011). This excellent measurement is of major help to efforts to understand the radial location and geometry of obscuration in this source.
Owing to its bright, neutral Fe K line and prior evidence of dramatic absorption variability, NGC 4388 was targeted for early observations with NICER (Gendreau et al. 2016). In Section 2, the data reduction is described. Section 3 details the spectral analysis that was undertaken. In Section 4, the results are discussed.
2. Observations and Reduction
NGC 4388 was observed on numerous occasions through the early phase of the NICER mission. The first observation was obtained on 2017-12-03 (MJD 58090); this analysis includes all data accumulated on and before 2019-03-29 (MJD 58571). The reduction was accomplished using HEASOFT version 6.25, and the latest calibration files consistent with that software release. The data were processed using NICERDAS. Using nimaketime, the raw exposures were filtered to exclude times close to the South Atlantic Anomaly, times with high particle background background (via the COR_SAX parameter), times of high optical loading (via the FPM_UNDERONLY_COUNT), and to avoid bad sun angles (we required a minimum of 30 and 40 degrees above the Earth limb and bright Earth limb, respectively). After filtering, the net exposure time is 105.6 ks. The individual event lists were then combined using the FTOOL nicermergeclean, and the total spectrum was extracted using the tool XSELECT.
The ISS orbit takes NICER through a wide range of geomagnetic latitudes, each with its own background characteristics. At high latitudes, the particle background is dependent on space weather and the variability of the Sun. Individual observations thus have different background levels that must be understood to maximize the science return. To calibrate the background, NICER has (to date) collected over 2.7 Ms of exposure on background fields used and characterized by RXTE (Jahoda 1996) and also a few select locations near some of the faint millisecond pulsars that are key to the NICER core science mission. For this paper, the background was estimated using the “space weather” method (Gendreau et al., in prep.) and uses environmental data to parse the background database. This tool uses a model of the magnetic cut-off rigidity the (COR_SAX parameter) and the space weather index “KP” (Kennziffer Planetary; Bartels et al. 1939). KP is derived from a worldwide network of magnetometers that publishes data every 3 hours [ https://www.swpc.noaa.gov/products/planetary-k-index ]. KP values range from , where low values indicate calm space weather, while higher values indicate geomagnetic storms. The space weather background tool builds a library of background spectra divided amongst these environmental variables to predict a background spectrum for a given observation.
Figure 1 plots the background-subtracted NICER light curve of NGC 4388, and the evolution of the source hardness. The hardness curve is the ratio of counts in the 8–12 keV band to counts in the 0.3–2.0 keV band. In the higher band, the source is dominant and relatively free of obscuration. In the lower band, contributions from the host galaxy are likely to be important and to give a measure of flux stability, though absorption is important. The data show a concentration of low and negative flux points, and negative spectral hardness, around Ms. This episode is due to a brief period of high background that was not caught by the standard screening criteria. This interval was excised and not considered for spectral analysis. The light curve shows rare intervals with high flux, but these are sporadic. The hardness ratio may be a better indicator of large changes in the source spectrum and/or obscuring column, but the errors on the hardness curve are large given the low count rates. The centroid values are fairly steady, however, with only a few points that deviate from the envelope of centroid values. An apparent spike in the count rate about 3.3 Ms into the monitoring campaign is not highly significant, and a putative delayed reaction in the hardness ratio is within the errors. For these reasons, this initial analysis of NGC 4388 is confined to the time-averaged spectrum of the source.
Owing to the fact that the spectrum is comprised of very strong features, and because the modeling is not concerned with, e.g., separating relativistic disk reflection features from the continuum, we have not “Crab-corrected” the spectra (see, e.g., Ludlam et al. 2018, Miller et al. 2018). Prior to spectral fitting, the data were grouped to require a signal-to-noise ratio of 10, using the FTOOL ftgrouppha.
3. Analysis and Results
The spectra were analyzed using XSPEC version 12.10.1 (Arnaud 1996). A statistic was minimized in the fitting procedure. NICER spectra are nominally valid down to 0.2 keV, but we restricted our fits to the 0.6–10.0 keV range owing to the limitations of some models (see below). Initial fits were made using the standard default weighting within XSPEC; refinements were made using “model” weighting. All of the errors in this work reflect the value of the given parameter at its 1 confidence limits. Uncertainties on the physical models were obtained after running a Markov Chain Monte Carlo within XSPEC. The chains started from the best-fit model, used the Goodman-Weare algorithm (Goodman & Weare 2010) with 100 walkers, had a length of , and a burn-in of .
3.1. Phenomenological Models
Simple models, such as an absorbed power-law, fail to fit the full spectrum. However, it can be useful to characterize the strength of the neutral Fe K line and the sensitivity at which it is detected over a narrow band. Fitting with a simple Gaussian and power-law in the 5.5–6.9 keV band to avoid broad continuum trends and the Fe K edge, we measure a line centroid of keV (in the frame of NGC 4388). This is slightly below the laboratory value, but it is within the uncertainty in the instrumental energy calibration.
The line is nominally resolved (measurements of its width statistically exclude zero) with eV, or about three times the nominal separation of the Fe K and Fe K components (13 eV). This translates to a broadening of . If the broadening is Keplerian, it may not be the full velocity but rather a projected velocity. If the accretion plane is viewed at , for instance, the velocity should be twice larger, . This velocity would correspond to orbits at , consistent with the optical BLR in many AGN (see, e.g., Peterson et al. 2004).
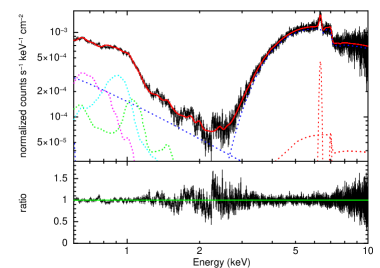
Finally, the flux of the line is measured to be . This translates to an equivalent width of eV. In Figure 2, for instance, which is based on more physical modeling (see below), it is clear that the line is only a fraction of the local continuum flux. In contrast, the neutral Fe K line in Compton-thick AGN is often several times stronger than the local continuum (e.g., Kammoun et al. 2019; however, also see Boorman et al. 2018).
3.2. Modeling with Pexmon
We next pursued modeling with pexmon. This model is built on pexrav (Magdziarz & Zdziarski 1995), which treats cold, neutral reflection – minus lines – from a slab of infinite column density. Nandra et al. (2007) updated pexrav to include Fe and Ni K and K lines, with strengths linked to the reflection in the manner dictated by atomic physics (see, e.g., George & Fabian 1991). If a source is not Compton-thick, and if the inclination is not extreme, it is likely that the viewing angle to the central engine is obscured while reflected emission from the far side of the central engine is not as obscured. Similarly, diffuse plasma emission from the larger nuclear region should not be obscured. However, the direct emission from the central engine should be obscured, with only a fraction passing through to the observer. There is an angle dependence within pexmon; this is the inclination at which the reflector is viewed, not the scattering angle, nor the inner disk inclination.
Within XSPEC, we built our model as follows:
phabs[1]*(zphabs[2]*photoion[3]* cutoffpl[4]
zphabs[5]*const[6]*cutoffpl[7] pexmon[8] mekal[9]
mekal[10] mekal[11].
Here, phabs[1] is the line of sight absorption in the Milky Way (fixed to in all fits; this value is not high enough to affect any fits in the 0.6–10.0 keV band). Then, zphabs[2] is the neutral column density along the line of sight acting on the continuum emission from the central engine in the source frame, modeled as a cut-off power-law via cutoffpl[4]. In between the central engine and the neutral obscuration, the flux passes through an ionized absorber, photoion[3] (described in more detail below). Some IR studies of Seyfert-2 AGN find evidence of dust in the polar regions (e.g., Honig et al. 2013), so the model allows for a fraction of the flux from the central engine to be scattered into our line of sight (via constant[6]*cutoffpl[7], where the parameters of cutoffpl[7] are linked to those of cutoffpl[4] and ). (In preliminary tests, we found that the cut-off was poorly constrained, so keV was enforced in all fits.) This scattered emission is allowed to pass through a different column density than that measured along the line of sight (via zphabs[5]). Reflection – nominally from distant material on the far side of the central engine – is modeled with pexmon[8]. The power-law index, cut-off energy, and flux normalization within pexmon[8] were linked to the values in cutoffpl[4]. Finally, the low energy spectrum required three diffuse plasma components, modeled with mekal. These collisional plasma models are adopted for simplicity; fits to the NICER spectrum are equally good if one of the mekal components is replaced with a photoionized plasma model.
The photoionized absorption component is a high-resolution XSTAR table model (e.g., Kallman & Bautista 2001; also see Miller et al. 2015, 2016), generated assuming a standard X-ray power-law and a UV blackbody disk. The UV/X-ray flux ratio was set to be 10:1, broadly consistent with bolometric corrections to Seyfert X-ray fluxes (Vasudevan & Fabian 2009). A bolometric lumnosity of was assumed. Assuming a different luminosity would not directly affect the ionization parameter, since this measurement is driven by line flux ratios. Fits to the data without this model showed evidence of absorption in the 6.6–6.7 keV range, potentially consistent with He-like Fe XXV seen in a number of Seyfert-1s. The variable parameters that can be constrained with XSPEC include the absorption column density (), ionization (, where ), and the velocity shift. The fits did not measure a significant shift so this parameter was fixed to have zero velocity. Comparing the fit statistic to models excluding the XSTAR component, a simple F-test suggests that the absorber is significant at the level of confidence.
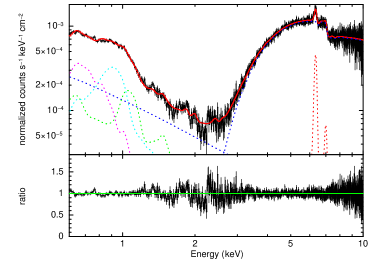
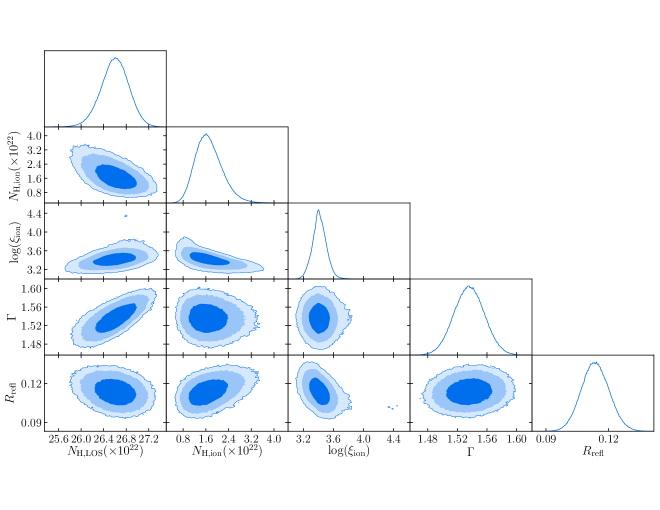
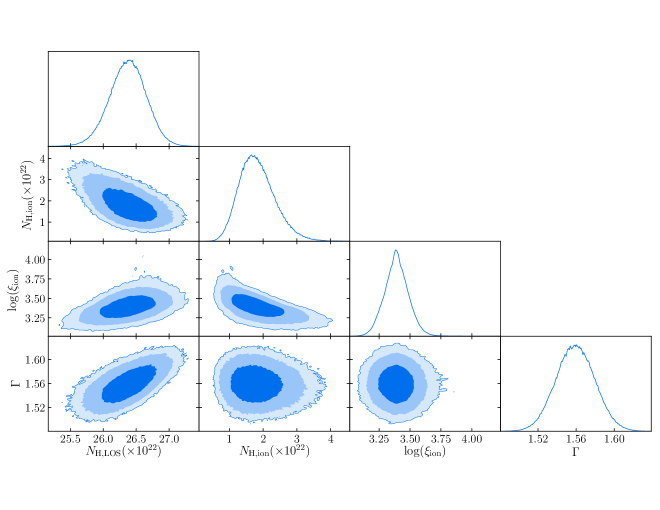
The parameters measured with this model are listed in Table 1, and the fit is shown in Figure 2. The confidence contours resulting from the MCMC error analysis are shown in Figure 3. The neutral obscuration is measured to be Compton-thin, with upper limits that exclude the Compton-thick regime. The “reflection fraction” is constrained to be much less than unity, again consistent with the source being Compton-thin. Emission that is scattered from the polar region, or another region out of the line of sight, is very small but nonzero. An iron abundance of relative to solar was slightly preferred by the data, and fixed in all fits, but is not required when mytorus is used (see below). The model detailed in Table 1 is not formally acceptable in a statistical sense; this is largely driven by remaining calibration uncertainties in the Si K and Au M-shell region near 2–3 keV.
Finally, we note that after removing the neutral obscuring column, our best-fit pexmon model construction implies an unabsorbed flux of in the 0.6–10 keV band. This corresponds to an 0.6–10.0 keV X-ray luminosity of , or . Bolometric corrections for Seyferts can range between 15–70 (Vasudevan & Fabian 2007), but they tend to be higher at higher Eddington fractions. For the lowest correction factor, an Eddington fraction of is implied; for the largest factor, .
3.3. Modeling with Mytorus
We also made fits with the mytorus suite (Murphy & Yaqoob 2009, Yaqoob et al. 2010), to add even more physical self-consistency than is possible with pexmon. The model is only valid above 0.6 keV. Mytorus does not include a cut-off energy in its power-law functions; we used versions of the obscuring, scattered, and line files that assume a simple power-law out to 100 keV (e.g., we used the line emission file ).
We constructed a “decoupled” mytorus model (see, e.g., Yaqoob et al. 2012), wherein line-of-sight effects (defined to have an inclination of ) and reflection effects (defined to have ) are separated and independently constrained. In effect, the components account for phenomena on the near side of the torus (or, obscuring geometry), through which our line of sight passes, and the components account for irradiation of the face of the “torus” on the far side of the central engine.
This model can be written as follows:
phabs[1]*([2]*photoion[3]*
zpowerlaw[4] zphabs[5]*const[6]* zpowerlaw[7]
const[8]*([9] [10])
const[11]*([12] [13]) +
mekal[14] + mekal[15] + mekal[16])
Here, the components follow logically from those in the pexmon model construction. The component is the neutral absorption component, with parameters including the column density, inclination angle, and red-shift of the source. The MYTS and MYTL components are the scattered emission and line emission components. For these components, the column density parameters are linked to the same parameter in , the inclination is set to the value indicated, and the power-law index and normalization are linked to the same parameters in zpowerlaw[4]. All of the components above have abundances fixed at solar values. The photoionized absorption model is exactly the same as that employed in the prior model, and is again required at the 4 level of confidence via a simple F-test.
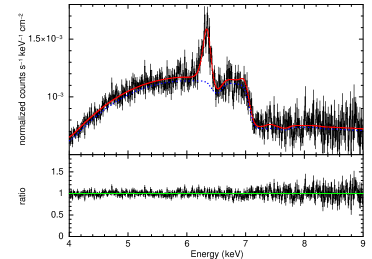
As with the prior pexmon model construction, this mytorus model yields a good description of the data, and physically reasonable parameter values (see Table 1, and Figures 4 and 5). It is nominally a better description of the data than the pexmon model, but the difference is not highly significant. The fact that an equally good or superior fit is possible with solar abundances suggests that super-solar abundances are not required. In keeping with the pexmon model results, scattered emission from a dusty polar region is found to be small.
In the best-fit model, the normalization const[11] modulating the and components has a value of , while that modulating the same components viewed face-on at has a very small value, . The face-on components thus make a small contribution, but the constant is well determined, and they are important to the fit. Nominally, this disparity would indicate that the reflection-like spectrum observed in NGC 4388 is dominated by scattering within the near side of the absorber (relative to the central engine), not reflection from the far side. However, additional fits indicate that this is partly an artificial result, likely owing to a degeneracy that the current data cannot break: requiring these constants to be equal only results in a slightly worse fit (). Given that the models strongly require Compton-thin obscuration, making it likely that the far side of the torus is partly visible, a conservative interpretation of our results is that the nominal “reflection spectrum” is partly reflection in the traditional sense, and partly scattering within the near side of the absorber. A data set that sampled a larger range in column density, for which hardness may be a proxy, might be able to break this degeneracy.
Fits with mytorus measure the same flux as the fits made with pexmon, in the 0.6–10.0 keV band. However, the best-fit mytorus model implies an unabsorbed flux that is slightly higher: . The corresponding X-ray luminosity is , implying . The upper limit of the range of bolometric corrections determined for Seyferts by Vasudevan & Fabian (2006), 70, would imply that the central engine in NGC 4388 is still just slightly sub-Eddington: .
It is worth noting that our model construction applies the ionized absorption column to flux from the central engine, but not the scattered or line components within mytorus. This effectively assumes that the ionized gas - perhaps a wind with an outflow velocity that is low (at least in projection) - has the bulk of its column density interior to the neutral gas. However, if the ionized and neutral gas were cospatial, then the scattered and line flux would pass through the ionized gas. The low column, optically thin ionized gas that we have observed would add negligible width to the Fe K line, rendering this inconsistency negligible as well. For much higher ionized columns, however, the inconsistency may not be negligible.
3.4. The Inner Extent of the “Torus”
Above, fits to the Fe K line with a simple Gaussian measured a width consistent with the optical BLR in most AGN. Indeed, studies of narrow Fe K lines observed with the Chandra/HETGS find that approximately half have widths consistent with an origin in the optical BLR (Shu et al. 2010). In Chandra spectra of NGC 4151, weakly relativistic dynamical imprints on the Fe K line and its variability appear to directly constrain the line to originate in regions even closer to the black hole than the optical BLR (Miller et al. 2018, Zoghbi et al. 2019 in prep).
Direct measurements of the broadening expected from Keplerian orbital motion in the BLR is likely beyond the reach of NICER. However, we can investigate the greatest degree of broadening that is consistent with the NICER data, and interpret this as a lower limit on the innermost extent of the obscuring material. To this end, we added an rdblur relativistic blurring function to modify the pexmon model. This function is analytic, and based on the diskline model (e.g. Fabian et al. 1989), which describes the line profile expected due to gravitational red-shifts and strong Doppler-shifts around a Schwarzschild black hole. This model is not appropriate close to a spinning black hole, but sufficient at the distances of interest in this work, and has the advantage of extending to arbitrarily large radii. The variable parameters of the rdblur model include the line emissivity, the inner and outer line production radii, and the inclination at which the geometry is observed.
In our fits, the emissivity index was fixed at a value of (where the emissivity is given by ), and the outermost line production radius was fixed at . We considered a set of fixed inclination values in order to be unbiased concerning the reflecting geometry; thus, the only variable parameter was the inner radius. The fit made assuming is consistent with that detailed in Table 1, but the fits made assuming higher inclination values are progressively worse. Table 2 details the inclinations, fit statistics, and lower radius limits obtained throught this fitting experiment.
4. Discussion and Conclusions
We have analyzed a summed, time-averaged NICER spectrum of the Seyfert-2 AGN NGC 4388, with a total exposure of 105.6 ks. The data have excellent sensitivity across the 0.6-10.0 keV band, permitting strong constraints on the column density and covering factor of neutral obscuration along our line of sight, enabling a limit on the innermost extent of this obscuration, and facilitating the detection of ionized absorption like that found in many Seyfert-1 AGN. In this section, we compare our results to prior studies of NGC 4388, and suggest methods for further improving our knowledge of this source with future observatories.
The values that we have measured for the equivalent neutral hydrogen column density within the nucleus of NGC 4388 (see Table 1) are in broad agreement with measurements made using Suzaku and XMM-Newton. The Suzaku data were analyzed by Shirai et al. (2008); using two related models, values of and were measured. Fits to the spectra obtained in two XMM-Newton/EPIC observations of NGC 4388 measured column densities of and (Beckmann et al. 2004).
A NuSTAR observation of NGC 4388 made in late 2013 was analyzed by Kamraj et al. (2017). Two measurements of the absorbing column were obtained in separate fits to the NuSTAR data: , and ; the former was made using pexrav, and the latter using mytorus. As noted above, pexrav does not include line emission, though the strength of the Fe K line relative to the edge is set by atomic physics and this scaling is key to accurately constraining the crucial parameters. The mytorus modeling undertaken by Kamraj et al. (2017) included only a single scattering and line component group, and a single inclination (fixed to the viewing angle of the accretion flow).
Masini et al. (2016) had previously analyzed the NuSTAR spectra of NGC 4388 as part of a larger analysis of water maser AGN. They examined a small set of self-consistent mytorus models, including one that is essentially the same as our implementation. That treatment resulted in an obscuring column of . The fact that a higher column is measured using the same model suggests that the difference could reflect a genuine reduction in the obscuring column between the NuSTAR observations in 2013, and our more recent NICER program. It is interesting to note that – similar to our findings – Masini et al. (2016) also report that scattering within the obscuring gas between the central engine and the observer dominates over forward-scattering from the same material on the far side of the central engine.
In the absence of a direct density constraint, writing allows an upper limit on the absorption radius via the ionization parameter, . As noted above, and in Table 1, is 0.0078–0.0104. A modest bolometric correction is likely more appropriate, based on the work of Vasudevan & Fabian (2007). Adopting a correction factor of 20 then implies . Using this value, and the absorption parameters listed in Table 1, the ionization parameter formalism implies a radius limit of , or for the mass of NGC 4388. However, assuming a density of – consistent with ionized absorber density constraints in some Seyferts (e.g., Krongold et al. 2007) – a radius of results, broadly consistent with an origin in the optical BLR. There, it might help to pressure-confine cold, clumpy gas. We note that the photoionization model assumed a power-law index of whereas values consistent with are measured, but this difference is minor compared to uncertainties in the bolometric correction factor.
Using the neutral reflected spectrum as a trace of the innermost extent of the cold obscuration, we are able to estimate lower limits on the innermost extent of this absorption. The smallest value, , is 1–2 orders of magnitude smaller than a typical optical BLR. If the reflector in NGC 4388 originates at such small radii, it would likely trace an X-ray BLR, warp, or other geometry. A larger limit that is not strongly rejected by an increased fit statistic, (corresponding to the fit made assuming ), is consistent with the inner extent of the optical BLR in many sources.
Especially in galaxies for which our line of sight passes close to the plane of the galactic disk, such as NGC 4388, the host galaxy itself can contribute significantly to the gaseous and dust obscuration detected in Seyferts and even some Compton-thick AGN (see, e.g., Shi et al. 2006, Gandhi et al. 2009, Goulding et al. 2012, Puccetti et al. 2014). It is therefore possible that the host galaxy contributes to the gaseous column density observed in NGC 4388, but the bulk of the neutral and ionized column likely arises on much smaller scales, based on the variability, line widths, and ionization arguments discussed above. However, Shi et al. (2006) measure a strong 9.7 m silicate feature in NGC 4388, and Hubble images of NGC 4388 reveal strong spiral arms and prominent dust lanes (Greene et al. 2013); the host galaxy could contribute significantly to the dust obscuration.
If the majority of the gaseous obscuration occurs on small scales within the nucleus, and if at least some part of the dust obscuration occurs within the host galaxy, is there a role for a conventional parsec-scale torus in NGC 4388? Dust reverberation mapping – actually reverberation using the K-band continuum at 2.2m because it is suitably close to the peak emissivity of hot dust grains – finds clear evidence of dust on parsec scales (e.g., Koshida et al. 2014) in nearby Seyferts. However, mid-IR interferometry has shown that the bulk of the IR emission occurs in polar regions rather than in equatorial regions (e.g., Raban et al. 2009; Honig et al. 2012, 2013). This may indicate that in NGC 4388 and other Seyferts, a traditional torus geometry is only a minor factor in shaping the broadband SED; however, this does not mean that different obscuration zones are completely disconnected. Recent studies of several AGN link X-ray activity in the central engine to dust flows on galactic scales (e.g., Cicone et al. 2014).
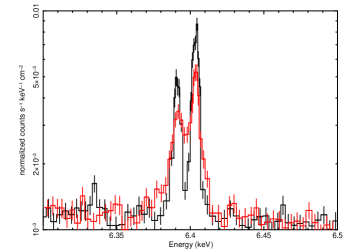
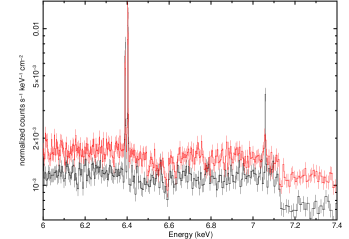
Future missions will combine spectral resolution and sensitivity, and may be able to build on the results achieved with NICER. Figure 6 shows simulated XRISM/Resolve (Tashiro et al. 2018) and Athena/X-IFU (Barret et al. 2018) spectra of NGC 4388, based on the results presented in this work. The XRISM/Resolve spectra were simulated using Hitomi responses with a resolution of 5 eV. Based on the best-fit mytorus model in Table 1, if the reflector traces the innermost extent of the obscuration and originates at (see above), dynamical broadening would be detected in a 100 ks exposure. The X-IFU simulation was constructed using the current public response matrices, with a resolution of 2 eV. We find that the X-IFU will be able to detect small changes (factors of ) in the high resolution features tied to the neutral and ionized absorbers on time scales as short as 10 ks, commensurate with the variability reported in Elvis et al. (2004) but based on low-resolution data. This would represent a very strong confirmation of the prior variability, and open a window into the nature of obscuration in Seyferts on dynamical time scales.
Finally, it is worth noting some of the limitations of our spectral modeling. Both pexmon and mytorus assume cold, neutral gas. If the gas that drives obscuration along our line of sight (and, reflection from the far side of the central engine) is as close as the optical BLR, the gas may not be entirely neutral. A model such as xillver (Garcia et al. 2013) describes reflection from a broad range of gas ionization levels. Exploratory fits with xillver replacing pexmon, for instance, yield equally good fits. Whereas pexmon only includes lines from Fe and Ni, xillver includes a broad range of abundant elements, and contributes some line flux (particularly Si) that is described by the mekal components in our models. However, more self-consistent implementations of xillver that replace the neutral obscuration with ionized obscuration through zxipcf, yield significantly worse fits. This may indicate that the absorption and reflection at least occur in a mixed medium, potentially with an ionization gradient. Future refinements in the calibration of NICER, and future missions, may be able to address such points.
We thank the anonymous referee for comments that improved the paper. JMM acknowledges helpful conversations with Richard Mushotzky.
References
- (1)
- (2) Antonucci, R., 1993, ARA&A, 31, 473
- (3)
- (4) Arnaud, K., 1996, Astronomical Data Analysis Software and Systems V, ASP Converence Series, eds. G. H. Jacoby and J. Barnes, 101, 17
- (5)
- (6) Barret, D., Lam Trong, T., den Herder, J.-W., Piro, L., Cappi, M., et al., 2018, SPIE, 10699, 1
- (7)
- (8) Bartels, J., Heck, N. H., Johnston, H. F., 1939, Terrestrial Magnetism and Atmospheric Activity, 44
- (9)
- (10) Beckmann, V., Gehrels, N., Favre, P., Walter, R., Courvoisier, T., Petrucci, P.-O., Malzac, J., 2004, ApJ, 614, 641
- (11)
- (12) Bianchi, S., La Franca, F., Matt, G., Guainazzi, M., Jimenez Bailon, E., Longinotti, A. L., Nicastro, F., Pentericci, L., 2008, MNRAS, 389, L52
- (13)
- (14) Boorman, P., Gandhi, P., Balokovic, M., Brightman, M., Harrison, F., Ricci, C., Stern, D., 2018, MNRAS, 477, 3775
- (15)
- (16) Cicone, C., Maiolino, R., Sturm, E., Garcia-Carpio, J., Feruglio, C., et al., 2014, A&A, 526, 21
- (17)
- (18) Czerny, B., & Hryniewicz, K., 2011, A&A, 525, L8
- (19)
- (20) Czerny, B., Modzelewska, J., Ptrogalli, F., Pych, W., Adhikari, T., Zycki, P., Hryniewicz, K., Krupa, M., Swieton, A., Nikolajuk, M., 2015, AdSpR, 55, 1806
- (21)
- (22) Elvis, M., Risaliti, G., Nicastro, F., Miller, J. M., Fiore, F., Puccetti, S., 2004, ApJ, 615, L25
- (23)
- (24) Fabian, A. C., Rees, M. J., Stella, L., White, N., 1989, MNRAS, 238, 729
- (25)
- (26) Gandhi, P., Honig, S. F., & Kishimoto, M., 2015, ApJ, 812, 113
- (27)
- (28) Garcia, J., Dauser, T., Reynolds, C. S., Kallman, T. R., McClintock, J. E., Wilms, J., Eikmann, W., 2013, ApJ, 768, 146
- (29)
- (30) Gendreau, K. C., Arzoumanian, Z., Adkins, P. w., Albert, C. L., Anders, J. F., et al., 2016, SPIE 9905, 1
- (31)
- (32) George, I. M., & Fabian, A. C., 1991, MNRAS, 249, 352
- (33)
- (34) Goodman, J. & Weare, J., 2010, Comm. App. Math. Comp. Sci, 5, 65
- (35)
- (36) Goulding, A. D., Alexander, D. M., Bauer, F. E., Forman, W. R., Hickox, R. C., Jones, C., Mullaney, J. R., Trichas, M., 2012, ApJ, 755, 5
- (37)
- (38) Greene, J. E., Seth, A., den Brok, M., Braatz, J. A., Henbkel, c., Sun, A.-L., Peng, C. Y., Kuo C.-Y., Voilette Impellizzeri, C. M., Lo, K. Y., 2013, ApJ, 771, 121
- (39)
- (40) Honig, S. F. & Kishimoto, M., 2017, ApJ, 838, L20
- (41)
- (42) Honig, S. F., Kishimoto, M., Antonucci, R., et al., 2012, ApJ, 755, 149
- (43)
- (44) Honig, S., Kioshimoto, M., Tristram, K., Prieto, M., Gandhi, P., Asmus, D., Antonucci, R., Burtscher, L. , Duschl, W., Weigelt, G., 2013, ApJ, 771, 87
- (45)
- (46) Jahoda, K,. Swank, J., Giles, A., Stark, M., Strohmayer, T., Zhang, W., Morgan, E., 1996, SPIE, 2808, 59
- (47)
- (48) Kallman, T., & Bautista, M., 2001, ApJS, 133, 221
- (49)
- (50) Kammoun, E., Miller, J. M., Zoghbi, A., Oh, K., Koss, M., et al., 2019, ApJ, in press, arxiv:1904.11028
- (51)
- (52) Kamraj, N., Rivers, E., Harrison, F. A., Brighman, M., Balokovic, M., 2017, ApJ, 843, 89
- (53)
- (54) Koshida, S., Minezaki, T., Yoshii, Y., Kobayashi, Y., Sakata, Y., et al., 2014, ApJ, 788, 159
- (55)
- (56) Krongold, Y., Nicastro, F., Elvis, M., Brickhouse, N., Binette, L., Mathur, S., Jimenez-Bailon, E., 2007, ApJ, 659, 1022
- (57)
- (58) Kuo, C., Braatz, J., Condon, J., Impellizzeri, C., Lo, K., et al., 2011, ApJ, 727, 20
- (59)
- (60) Ludlam, R. M., Miller, J. M., Arzoumanian, Z., Bult, P. M., Cackett, E. M., et al., 2018, ApJ, 858, L5
- (61)
- (62) Magdziarz, P., & Zdziarski, A., 1995, MNRAS, 273, 837
- (63)
- (64) Masini, A., Comastri, A., Balokovic, M., Zaw, I., Puccetti, S., et al., 2016, A&A, 589, 59
- (65)
- (66) Miller, J. M., Fabian, A. C., Kaastra, J., Kallman, T., King, A. L., Proga, D., Raymond, J., Reynolds, C. S., 2015, ApJ, 814, 87
- (67)
- (68) Miller, J. M., Raymond, J., Fabian, A. C., Gallo, E., Kaastra, J., Kallman, T., King, A. L., Proga, D., Reynolds, C. S., Zoghbi, A., 2016, ApJ, 821, L9
- (69)
- (70) Miller, J. M., Gendreau, K., Ludlam, R. M., Fabian, A. C., Altamirano, D., 2018, ApJ, 860, L28
- (71)
- (72) Miller, J. M., Cackett, E., Zoghbi, A., Barret, D., Behar, E., Brenneman, L. W., Fabian, A. C., Kaastra, J. S., Lohfink, A., Mushotzky, R., Nandra, K., Raymond, J., 2018, ApJ, 865, 97
- (73)
- (74) Murphy, K., & Yaqoob, T., 2009, MNRAS, 397, 1549
- (75)
- (76) Nandra, K, O’Neill, P. M., George, I. M., Reeves, J. N., 2007, MNRAS, 382, 194
- (77)
- (78) Peterson, B. M., Ferrarese, L., Gilbert, K. M., Kaspi, S., Malkan, M. A., et al., 2004, ApJ, 613, 682
- (79)
- (80) Puccetti, S., Comastri, A., Fiore, F., Arevalo, P., Risaliti, G., et al., 2014, ApJ, 793, 36
- (81)
- (82) Raban, D., Jaffe, W., Rottgering, H., Meisenheimer, K., & Tristram, K. R. W., 2009, MNRAS, 394, 1325
- (83)
- (84) Ramos Almeida, C., & Ricci, C., 2017, Nature Astronomy, 1, 679
- (85)
- (86) Risaliti, G., 2002, A&A, 386, 379
- (87)
- (88) Shi, Y., Rieke, G. H., Hines, D. C., Gorjian, V., Werner, M. W., Cleary, K., Low, F. J., Smith, P. S., Bouwman, J., 2006, ApJ, 653, 127
- (89)
- (90) Shirai, H., Fukuzawa, Y., Sasada, M., Ohno, M., Yonetoku, D., et al., 2008, PASJ, 60, 263
- (91)
- (92) Shu, X. W., Yaqoob, T., Wang, J. X., 2010, ApJ, 738, 147
- (93)
- (94) Sorce, J. G., Tully, R. B., Courtois, H. M., Jarret, T. H., Neill, J. D., Shaya, E. J., 2014, MNRAS, 444, 527
- (95)
- (96) Tashiro, M., Maejima, H., Toda, K., Kelley, R., Reichenthal, L., et al., 2018, SPIE, 10699, 22
- (97)
- (98) Vasudevan, R. V., & Fabian, A. C., 2007, MNRAS, 381, 1235
- (99)
- (100) Vasudevan, R. V., & Fabian, A. C., 2009, MNRAS, 392, 1124
- (101)
- (102) Yaqoob, T., 2012, MNRAS, 423, 3360
- (103)
- (104) Yaqoob, T., & Murphy, K., 2010, MNRAS, 412, 277
- (105)


| Parameter | pexmon | mytorus |
| 3.2(1) | ||
| – | ||
| – | ||
| – | ||
| (keV) | 0.29(1) | |
| (keV) | ||
| (keV) | ||
| F0.6-10 | 6.2(2) | 6.23(4) |
| F0.6-10,unabs. | 2.21(7) | 2.63(2) |
| LX,0.6-10 | 0.86(3) | 1.03(1) |
| LX/LEdd. | 8.1(3) | 9.7(7) |
| pKS | 60.6% | 65.0% |
| Inclination | radius limit | |
|---|---|---|
| (deg.) | () | |
| 1123.5 | ||
| 1126.2 | ||
| 1128.2 | ||
| 1133.3 |