Suppression of ferromagnetic spin fluctuations in the filled skutterudite superconductor SrOs4As12 revealed by 75As NMR-NQR measurements
Abstract
Motivated by the recent observation of ferromagnetic spin correlations in the filled skutterudite SrFe4As12 [Ding et al. Phys. Rev. B 98, 155149 (2018)], we have carried out 75As nuclear magnetic resonance (NMR) and nuclear quadrupole resonance (NQR) measurements to investigate the role of magnetic fluctuations in a newly discovered isostructural superconductor SrOs4As12 with a superconducting transition temperature of 4.8 K. Knight shift determined by the NQR spectrum under a small magnetic field ( 0.5 T) is nearly independent of temperature, consistent with the temperature dependence of the magnetic susceptibility. The nuclear spin-lattice relaxation rate divided by temperature, 1/, is nearly independent of temperature above 50 K and increases slightly with decreasing temperature below the temperature. The temperature dependence is reasonably explained by a simple model where a flat band structure with a small ledge near the Fermi energy is assumed. By comparing the present NMR data with those in SrFe4As12, we found that the values of and in SrOs4As12 are smaller than those in SrFe4As12, indicating no obvious ferromagnetic spin correlations in SrOs4As12. From the temperature dependence of 1/ in the superconducting state, an -wave superconductivity is realized.
I Introduction
Magnetic fluctuation is one of the key parameters to characterize the physical properties of strongly correlated electron systems. Antiferromagnetic spin fluctuations are considered to play an important role in many unconventional superconductors such as high cuprates HTS , iron-based superconductors Johnston2010 ; Dai2015 ; Paul2018 ; DingQCP , organic superconductors Organic , and also heavy fermion superconductors HF . Alternatively, ferromagnetic spin fluctuations are also considered to be important in the mechanism of superconductivity in U-based superconductors Aoki2012 ; Aoki2019 , and in iron-based superconductors Johnston2010 ; Nakai2008 ; PaulPRB ; PaulPRL ; Jean2017 ; Li2019 .
The importance of magnetic fluctuations has also been pointed out in the filled skutterudite compound Fe ( = alkali metal, alkaline earth metal, lanthanide, and actinide; = P, and Sb) whose magnetic properties largely depend on the number of valence electrons of the ions Leithe-Jasper2003 ; Leithe-Jasper2004 ; Schnelle2008 ; Ishida2005 ; Matsuoka2005 ; Matsumura2005 ; Nakai2005 ; Matsumura20071 ; Magishi2014 ; Schnelle2005 ; K ; Gippius2006 ; Magishi2006 . In the case of = monovalent Na and K ions with = Sb, a weak ferromagnetism with a Cuire temperature of = 85 K has been observed Leithe-Jasper2003 ; Leithe-Jasper2004 , while no magnetic order has been reported for the case of divalent alkaline-earth ions such as Ca, Sr, and Ba, where ferromagnetic spin fluctuations are considered to play an important role Schnelle2005 ; Schnelle2008 ; Matsuoka2005 ; K . On the other hand, the importance of antiferromagnetic spin fluctuations has been pointed out in the trivalent ion systems of LaFe4Sb12 Schnelle2008 ; Gippius2006 and in LaFe4P12 Nakai2005 , although ferromagnetic fluctuations are also reported in LaFe4Sb12 Magishi2006 .
The effects of magnetic fluctuations on the physical properties of filled skutterudite compounds with different electrons from 3 to 4 and 5 have also been investigated by replacing Fe by Ru or Os Takabatake2006 ; Matsuoka2006 ; Takegahara2008 . From the magnetization, transport and specific heat measurements, the 5-electron compounds of Os4Sb12 ( = Sr, Ba) are found to be placed between the Fe 3 compounds with ferromagnetic spin fluctuations and the Ru 4 compounds having no obvious strong electron correlation effects Takabatake2006 ; Matsuoka2006 . Although it is important to systematically study these physical properties of electron systems by changing ions such as P and As for deeper understandings of the role of electrons, not many studies have been carried out because of the difficulty in preparing those compounds.
Recently, new filled-skutterudite arsenide compounds SrAs12 ( = Fe, Ru, Os) have been synthesized using a high-pressure synthesis technique Nishine2017 , which provides a new opportunity of systematic studies of the role of electrons with 3, 4 and 5. For the 5 electron system, SrOs4As12 was found to be a new superconductor with a transition temperature of = 4.8 K Nishine2017 . For the 3 and 4 electron systems, on the other hand, SrFe4As12 and SrRu4As12 do not exhibit superconductivity down to 2 K, although the electrical resistivities show metallic behavior Nishine2017 . Magnetization and specific heat measurements Nishine2017 and theoretical studies Shankar2017 pointed out a ferromagnetic nature of SrFe4As12. Quite recently, ferromagnetic spin correlations were actually reported in the 3-compound SrFe4As12 Ding2018 , similar to the case of Fe4Sb12 ( = Ba, Sr) Schnelle2008 ; Matsuoka2005 ; Matsumura2005 . Since the 5-compound SrOs4As12 exhibits superconductivity in contrast to the non-superconductors Os4Sb12 ( = Ba, Sr) Evers1994 , it is very interesting to investigate how the magnetic fluctuations changes in the newly discovered superconductor SrOs4As12.
Nuclear magnetic resonance (NMR) and nuclear quadrupole resonance (NQR) measurements are powerful techniques to investigate the magnetic and electronic properties of materials from a microscopic point of view. It is known that the temperature () dependence of the nuclear spin-lattice relaxation rate (1/) reflects the wave vector -summed dynamical susceptibility. On the other hand, NMR spectrum measurements, in particular the Knight shift , give us information on static magnetic susceptibility . Thus from the temperature dependence of 1/ and , one can obtain valuable insights into magnetic fluctuations in materials. Furthermore, 1/ measurements in the superconducting state provide important information in understanding the symmetry of Cooper pairs in superconductors.
In this paper, we report the results of 75As NMR, NQR and magnetic susceptibility measurements performed to investigate the magnetic and electronic properties of SrOs4As12 from a microscopic point of view. Our experimental data indicate the strong suppressions of ferromagnetic spin correlations in the superconductor SrOs4As12, in comparison with SrFe4As12 which exhibits electron correlations enhanced around ferromagnetic wavenumber = 0 Ding2018 . The temperature dependence of 1/ in the superconducting state evidences an -wave superconductivity in SrOs4As12.
II Experimental
Polycrystalline SrOs4As12 samples were prepared at high temperatures and high pressures using a Kawai-type double-stage multianvil high-pressure apparatus Nishine2017 . The lattice constant of SrOs4As12 with a body centered cubic structure (space group: ) has been determined by x-ray diffraction measurements to be 8.561 Å Nishine2017 . Magnetic susceptibility measurement was performed using a magnetic properties measurement system (MPMS, Quantum Design, Inc.) under a magnetic field of 5 T. NMR and NQR measurements of 75As ( = , = 7.2919 MHz/T, 0.29 barns) nuclei were conducted using a lab-built phase-coherent spin-echo pulse spectrometer. The 75As-NMR spectra were obtained by sweeping the magnetic field at a fixed frequency = 37 MHz, while 75As-NQR spectra were measured in steps of frequency by measuring the intensity of the Hahn spin echo. The 75As nuclear spin-lattice relaxation rate (1/) was measured with a saturation recovery method. at each temperature was determined by fitting the nuclear magnetization versus time using the exponential function for 75As NQR, where and are the nuclear magnetization at time after the saturation and the equilibrium nuclear magnetization at , respectively. 0.8 is nearly independent of temperature in the paramagnetic state, however, the values of show a complicated temperature dependence in the superconducting state below 4.8 K, as will be discussed later.
III 75As NMR and NQR spectra

Figure 1 shows the field-swept 75As-NMR spectrum of SrOs4As12 at = 4.3 K where a complex NMR spectrum is observed. A similar complicated 75As NMR spectrum has been observed in the isostructural compound SrFe4As12, which is due to a large nuclear quadrupolar interaction and a finite asymmetric parameter of the electric field gradient (EFG) tensor at the As site Ding2018 . One can calculate NMR spectrum from a nuclear spin Hamiltonian which is a sum of the nuclear Zeeman () and electric quadrupole () interactions:
| (1) |
where
| (2) |
and
| (3) |
in the coordinate of the principal , , and axes of electric field gradient (EFG). Here is the applied field, is Planck’s constant, is Knight shift, is nuclear quadrupole frequency defined by = /2 where is the quadrupole moment of the As nucleus, is the EFG at the As site, = is the asymmetry parameter of the EFG, and and are the polar and azimuthal angles between the direction of the applied field and the axis of EFG, respectively. As has been done in our previous paper Ding2018 , we have calculated a powder-pattern NMR spectrum by diagonalizing exactly the nuclear spin Hamiltonian without using perturbation theory. The calculated spectrum with the NMR frequency = 37 MHz, = 0, NQR frequency = 60.1 MHz and = 0.45 reasonably reproduces the characteristic shape of the observed spectrum, as shown by the red curve in Fig. 1. However, we notice that, in addition to the calculated spectrum (red curve), there is another contribution ( 2 spectral weight) of 75As NMR spectrum with = 23.6 MHz and = 0 to the total NMR spectrum. Similar contribution of the spectrum has been observed in SrFe4As12 where the contribution has been assigned to the impurity phase of arsenic metal Ding2018 .
As for the principal axis of EFG at the As site, one cannot determine it from NMR spectrum measurements on the powder compound. As described in our previous paper Ding2018 , Tou et al. Tou2005 ; Tou2011 have determined the principal axis of the EFG at the Sb sites in the isostructural PrOs4Sb12 compound from NMR measurements using a single crystal, which reports that, although there is one crystallographically equivalent Sb site in the filled skutterudite structure, there are three different Sb sites with the principal axis parallel to [100], [010], and [001] of the crystal, respectively, due to the local symmetry of the 24g site of the Sb ions. The same conclusion for the direction of the EFG at the Sb sites in CeOs4Sb12 has been reported from 121Sb NMR using an oriented powder sample Yogi2009 . Since the crystal structure of the Sb compounds is the same as that of SrOs4As12, we consider the directions of EFG at the As sites are the same.
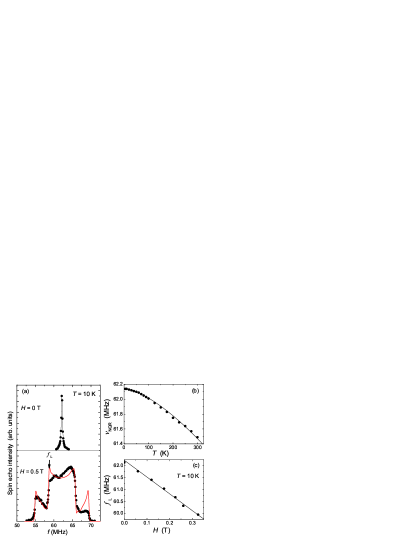
In NQR spectrum under zero magnetic field for = 3/2 where has only , one can observe a single transition line at a frequency of . Using the = 60.1 MHz and = 0.45 at = 10 K estimated from the analysis of the NMR spectrum, one expects the NQR line at 62.1 MHz which is actually observed as shown at the upper panel in Fig. 2 (a). The peak position slightly shifts to lower frequency with increasing temperature, corresponding to the decrease in on increasing temperature as shown in Fig. 2 (b). Similar temperature dependence of has been observed in SrFe4As12 Ding2018 and also in other filled skutterudite compounds Matsumura2007 ; Shimizu2007 ; Magishi2014 ; Nowak2009 ; Nowak2011 ; Yogi2014 where the temperature dependence at higher temperatures is found to obey an empirical relation with a fitting parameter . This temperature dependence is considered to be due to thermal lattice expansion alphaQ . As shown by the solid curve in Fig. 2 (b), the temperature dependence of in SrOs4As12 also follows the relation with K-3/2. The value of K-3/2 is slightly smaller than 3.21 K-3/2 for SrFe4As12 Ding2018 . The linewidth of the NQR spectra (full-width at half maximum, 0.4 MHz) is nearly independent of temperature from 4.3 K to 300 K. This indicates that there is no any structural or magnetic phase transition in the normal state of SrOs4As12.
IV 75As Knight shift
Determination of the Knight shift from the complex NMR spectrum shown in Fig. 1 is relatively difficult due to the strong quadrupole interaction and relatively large asymmetric parameter value. This is due to the fact that small changes in and produce a change in , making large ambiguity in determining from the simulation of NMR spectrum. However, as has been reported Ding2018 , we have succeeded in determining the Knight shift data from NQR spectrum under small magnetic fields lower than 0.5 T in SrFe4As12. Here we have applied the same method to SrOs4As12 to obtain the Knight shift data. As described in detail in Refs. K ; Ding2018 , the NQR resonance frequency [] under a small magnetic field can be written by Dean1954
| (4) |
where is at = 0, = , and is a factor close to unity which depends on the value of . Under magnetic fields, the random distribution of produces the rectangular shape of the powder-pattern spectrum where = 0 (and also ) produce both higher- and lower-frequency edges. By measuring the external magnetic field dependence of the edge position of the NQR spectrum, one can determine the coefficient of the second term of eq. (4), , and thus the Knight shift if one knows the value of since the values of is known. At the lower panel of Fig. 2 (a), a typical NQR spectrum observed at = 0.5 T is shown, where the rectangular shape of the powder pattern spectrum is clearly seen. The small peaks (at 55 and 70 MHz) on both sides of the central rectangular spectrum are due to the mixing of states and as a result of zero-order mixing effect PQR . These features of the observed spectrum are relatively well reproduced by the calculated powder-pattern spectrum with = 60.1 MHz, = 0.45 and = 0.5 T using the Hamiltonian of eq. (1), as shown by the red curve in Fig. 2 (a).
Fig. 2 (c) shows a typical magnetic field dependence of at the lower edge position indicated by the black arrow in Fig. 2 (a), exhibiting a clear linear behavior. From the slope, the Knight shift at 10 K was determined to be -1.2 2.5 . Here we used = 0.9794 as in the case of SrFe4As12 Ding2018 where the value of = 0.4 is close to 0.45. Although the error is relatively large, this is much better than the case of NMR spectrum from which we could not determine . It is also noted that we did not include any anisotropy in the Knight shift in the calculated spectrum which reproduces the observed one as shown above. This suggests that, although one expects an anisotropic part in the Knight shift due to the local symmetry of the Os ions (trigonal), the anisotropy is not significant and could not be detected within our experimental uncertainty. Therefore, the Knight shift discussed below is considered as an isotropic part of Knight shift.
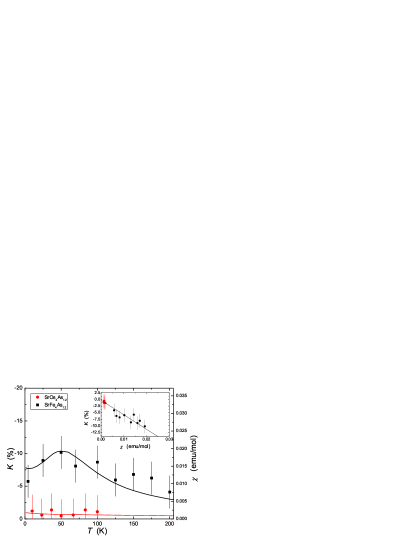
Following the method described above, we determined at different temperature. Its temperature dependence is shown in Fig. 3 where the data in SrFe4As12 are also plotted Ding2018 . In contrast to the case of SrFe4As12 where the broad minimum around 50 K has been observed (note the sign of the vertical axis of Fig. 3 for the Knight shifts), values of SrOs4As12 are much smaller than those of SrFe4As12 and are nearly independent of temperature. These results are consistent with the magnetic susceptibility data whose temperature dependencies are also shown by solid curves in Fig. 3 where the maximum in corresponds to the minimum in in SrFe4As12 due to the negative hyperfine coupling constant Ding2018 . It is also noted that the values of in SrOs4As12 is more than one order of magnitude smaller than those in SrFe4As12. These results clearly evidence that the spin susceptibility of SrOs4As12 is much smaller than that of SrFe4As12.
In order to check whether or not the small values of actually correspond to the suppression of spin susceptibility, we have plotted Knight shifts for both compounds as a function of the corresponding as shown in the inset of Fig. 3. Since NMR shift consists of temperature dependent spin shift and independent orbital shift , one needs to know to estimate . can be obtained from the intercept of the so-called plot shown in the inset. The solid line in the inset is the linear fit for data including both compounds, giving a nearly zero intercept, i.e., nearly zero . Therefore, the observed can be considered as mainly , again indicating that the strong suppression of the spin susceptibility in SrOs4As12. The slope gives a hyperfine coupling constant = -3.84 1.60 kOe/ Hyperfine coupling .
V 75As spin-lattice relaxation rate 1/
V.1 Normal state
Figure 4 shows the temperature dependence of the 75As spin-lattice relaxation rate divided by temperature (1/) measured at the peak positions of the NQR spectra under zero magnetic field, together with the data for SrFe4As12 reported previously Ding2018 . Contrary to the case in SrFe4As12 where the large enhancement of 1/ at low temperatures has been observed, 1/ in SrOs4As12 seems follow Korringa law, = constant, at high temperature above 50 K though the small increase can be observed at low temperatures in the normal state.
In the previous paper, to reproduce the temperature dependence of 1/ for SrFe4As12, we have employed a simple model where a concave-shaped band structure shown in the inset of Fig. 4 is assumed Ding2018 . In the model, the Fermi energy () is assumed to be at the center of the dip, and , , the density of states and characterize the band structure near . Using the formula,
| (5) |
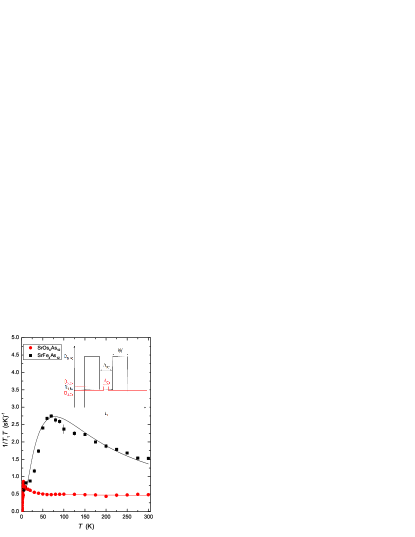
where is the Fermi distribution function, we calculated with a set of parameters of = 88 K, = 220 K, and / = 2.63, which reasonably reproduces the experimental data, as shown by the black curve in Fig. 4. The model is also used to reproduce the temperature dependence of the magnetic susceptibility in SrFe4As12 Ding2018 . It is interesting to note that a similar model (but with no finite density of state at ) has been applied to FeSi for explaining the characteristic temperature dependence of magnetic susceptibility, specific heat and thermal expansion Mandrus1995 .
In the case of SrOs4As12, the nearly temperature independent behavior of 1/ indicates a almost flat band near , contrary to the case of SrFe4As12. In fact, as shown in by the red solid curve in Fig. 4, the observed temperature dependence of 1/ can be reproduced by the band model with a nearly flat structure near with a small ledge having the width = 40 K with / = 1.2. It turns out that the difference in the band structure produces the significantly different behavior in 1/ and could originate from the fact that Fe 3 electrons have more localized nature than Os 5 electrons.
Now we discuss magnetic correlations in both systems based on the NMR data. As has been discussed in our previous paper, in order to discuss the magnetic correlations, it is useful to estimate the quantity where is the spin part of the Knight shift Moriya1963 ; Narath1968 ; Li2010 . The so-called Korringa ratio is unity for uncorrelated metals. Here = where and are the electron and nuclear gyromagnetic ratios, respectively. Since 1/ probes the dynamical spin susceptibility averaged over the Brillouin zone, it can be enhanced either ferromagnetic or antiferromagnetic spin correlations. On the contrary, will be enhanced only for ferromagnetic spin correlations. Therefore, for antiferromagnetic correlated metals, is expected to be greater than unity. On the other hand, one can expect much smaller than unity for ferromagnetic spin correlations. 0.02, much less than unity, was reported in SrFe4As12 Ding2018 , evidencing the ferromagnetic spin correlations. On th other hand, the small values of for SrOs4As12 increase the values, suggesting much less ferromagnetic spin correlations in SrOs4As12. However, the estimate of is rather difficult due to large errors in . In addition, it should be noted that the observed 1/ is the sum of two contributions: the spin and orbital relaxation rates. This also makes difficulty in estimating . Assuming = 1 for uncorrelated metals, is estimated to be 0.21 using the 1/ values above 50 K in the normal state. The would be consistent with the observed small values of for SrOs4As12 within our large experimental uncertainty. Thus one can conclude that the ferromagnetic spin correlations observed in SrFe4As12 are strongly suppressed in SrOs4As12 T1 .
It is interesting to point out that the 1/ values for both systems are almost comparable at low temperatures below 20 K in the normal state. This indicates that the effective density of states at , , is nearly the same for the compounds at low temperatures, as actually illustrated in the inset of Fig. 4. Since generally correlates with in conventional BCS superconductors, one may expect an appearance of superconductivity in SrFe4As12. No superconductivity is, however, observed in SrFe4As12. Therefore, we speculate that the strong ferromagnetic fluctuations prevent superconductivity. As will be discussed below, the superconductivity in SrOs4As12 is revealed to be a spin-singlet -wave state where ferromagnetic fluctuations may compete since it would be favorable to inducing triplet Cooper pairs. In other word, the strong suppression of the ferromagnetic spin correlations could induce the superconductivity in SrOs4As12. Therefore, one may expect the superconductivity in SrFe4As12 if the ferromagnetic correlations could be suppressed. This would be possible by applying pressure since the nature of localization of 3 electrons responsible for the ferromagnetic spin correlations may be decreased. This interesting project is currently in progress.
V.2 Superconducting state
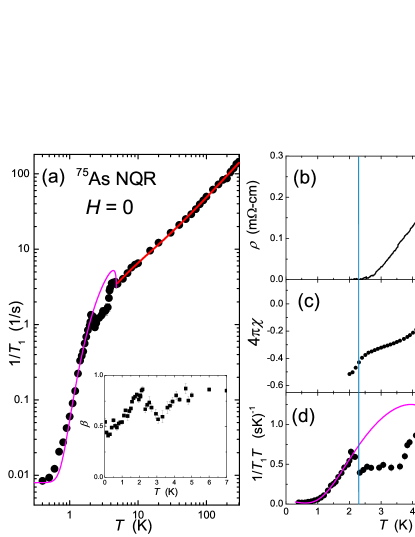
Finally we show the data in the superconducting state below 4.8 K. As shown in Fig. 5 (a), 1/ shows a tiny, but visible, coherence peak (also known as Hebel-Slichter peak) just below , and decreases below 4 K, then exhibits a small peak around 2 K following the sudden decrease below 2 K where 1/ seems to level off below 0.4 K. Although the temperature dependence of 1/ is complicated, it is important to point out that 1/ decreases largely by more than two orders of magnitude below down to the lowest temperature 0.4 K. This clearly indicates that the superconductivity observed in SrOs4As12 is not filamentary or surface, but bulk in nature at least below 2 K. In addition, the observation of the coherence peak just below [more clearly seen in Fig. 5 (d)] is direct evidence of a conventional -wave BCS superconductor. The observation of the peak also indicates that the relaxation process of the As nuclei in SrOs4As12 can be characterized to be magnetic, not electric Hammond1960 ; Wada1973 . The unusual and complicated behavior in in the temperature range of 2 - 4 K could be due to the distribution of in our sample as can be seen in the resistivity and magnetization data Nishine2017 . As shown in Fig. 5 (b), the electrical resistivity starts to decreases below 4.8 K and reaches nearly zero resistivity at 2.2 K with a relatively broad superconducting-transition width = 2.6 K. The distribution of can be also inferred from the two step behavior in the volume magnetic susceptibility in the superconducting state estimated from the zero-field cooled magnetic susceptibility measurements as shown in Fig. 5 (c). It is noted that the superconducting volume starts to increase below 4.8 K on cooling and reaches 45 around 2.2 K where the zero resistivity is observed. The distribution of would make problems in estimating since the observed spectrum may compose of at least two components of 75As NQR signals from the superconducting and the normal states. In addition, the ratio of the signals from the superconducting and normal states could be changed with temperature due to Meissner effect, which will produce complicated nuclear relaxation curves. In fact, as shown in the inset of Fig. 5 (a), the temperature dependence of exhibits a complicated behavior with a local minimum around 3.5 K, showing the large distribution of 1/. Thus, since we consider that the temperature dependence of 1/ in = K is not intrinsic but extrinsic and more artificially, we will not discuss it in this paper. It is noted that, although similar complicated behavior of 1/ has been observed in SrtPtAs Bruckner2014 , the later measurements with high quality samples do not show the complicated behavior Matano2014 , suggesting that the quality of samples strongly affects the temperature dependence of 1/.
In order to test whether the observed temperature dependence of 1/ can be explained by a -wave conventional superconductor model, we have calculated 1/ using BCS theory. Here, the relaxation rate 1/ in the superconducting state normalized by in the normal state is expressed as Hebel1959
| (6) |
where = / is the anomalous density of states (DOS) due to the coherence factor, = / is the DOS in the superconducting state, is the energy gap, is the DOS in the normal state, and is the Fermi distribution function. We convolute and with a broadening function assuming a triangle shape with a width 2 and a height 1/ Ding2016 . The pink curve in Fig. 5 (a) [also shown in Fig. 5 (d)] is the calculated result with = 6 K and . Here we added a constant term of 1/ = 0.008 (1/s) into the calculated result to reproduce the temperature independent behavior of 1/ observed below 0.4 K. The origin of the temperature independent behavior of 1/ is not clear at present but it may originate from some sort of impurity effects. Although the calculated results does not reproduce the height of the observed coherence peak, it seems to capture the observed temperature dependence of 1/ (here again, except for the intermediate temperature range of K). The value of 2 is estimated to be 2.5 using the on-set of 4.8 K. This value is slightly smaller than that of the BCS weak-coupling limit 2 = 3.53. It should be noted that the isostructural compound CaOs4P12, has been suggested to be a BCS-type superconductor with = 2.5 K Kawamura2018 . In order to discuss the superconducting properties of SrOs4As12 in detail, one needs good quality samples with much smaller distribution of and the detailed study of the superconducting properties of SrOs4As12 is a future project. However, it should be noted that our NMR measurements clearly indicate the -wave BCS superconducting nature in SrOs4As12, even though the present samples show the relatively broad superconducting transition.
VI Summary
In summary, we have carried out 75As NMR and NQR measurements on the superconductor SrOs4As12 and compared the results with those in non-superconducting metallic compound SrFe4As12 in which ferromagnetic spin correlations play an important role. Knight shift determined by the NQR spectrum under a small magnetic field ( 0.5 T) is nearly independent of temperature, which is consistent with the temperature dependence of the magnetic susceptibility. The values of in SrOs4As12 are much smaller than those in SrFe4As12, indicating the spin susceptibility in SrFe4As12 is strongly suppressed in SrOs4As12. Similar strong suppression in SrOs4As12 can also be observed in 1/ data whose temperature dependence is explained by a simple model where we assume a flat band structure with a small ledge near the Fermi energy. The large suppression in the and in SrOs4As12 compared with those in SrFe4As12 indicates no obvious ferromagnetic spin correlations in SrOs4As12. Furthermore, the temperature dependence of 1/ in the superconducting state evidences a conventional -wave superconductivity in SrOs4As12. These results suggest that the ferromagnetic spin correlations compete the appearance of superconductivity in the Sr-based filled skutterudite arsenides, which may be consistent with the conventional spin-singlet -wave superconducting state revealed by 1/ measurements.
VII Acknowledgments
The research was supported by the U.S. Department of Energy (DOE), Office of Basic Energy Sciences, Division of Materials Sciences and Engineering. Ames Laboratory is operated for the U.S. DOE by Iowa State University under Contract No. DE-AC02-07CH11358. Part of this work was supported by JSPS KAKENHI Grant Number 23340092.
References
- (1) Dynamics of Magnetic Fluctuations in High-Temperature Superconductors, edited by G. Reiter, P. Horsch, and G. C. Psaltakis (Springer-Verlag, 1991).
- (2) D. C. Johnston, Adv. Phys. 59, 803 (2010).
- (3) P. Dai, Rev. Mod. Phys. 87, 855 (2015).
- (4) P. Wiecki, K. Rana, A. E. Böhmer, Y. Lee, S. L. Bud’ko, P. C. Canfield, and Y. Furukawa, Phys. Rev. B 98, 020507(R) (2018).
- (5) Q.-P. Ding, W. R. Meier, J. Cui, M. Xu, A. E. Böhmer, S. L. Bud’ko, P. C. Canfield, and Y. Furukawa, Phys. Rev. Lett. 121, 137204 (2018).
- (6) The Physics of Organic Superconductors and Conductors, edited by A. Lebed (Springer-Verlag, 2008).
- (7) G. R. Stewart, Rev. Mod. Phys. 56, 755 (1984).
- (8) D. Aoki and J. Flouquet, J. Phys. Soc. Jpn. 81, 011003 (2012).
- (9) D. Aoki, K. Ishida, and J. Flouquet, J. Phys. Soc. Jpn. 88, 022001 (2019).
- (10) Y. Nakai, K. Ishida, Y. Kamihara, M. Hirano, and H. Hosono, Phys. Rev. Lett. 101, 077006 (2008).
- (11) P. Wiecki, V. Ogloblichev, A. Pandey, D. C. Johnston, and Y. Furukawa, Phys. Rev. B 91, 220406(R) (2015).
- (12) P. Wiecki, B. Roy, D. C. Johnston, S. L. Bud’ko, P. C. Canfield, and Y. Furukawa, Phys. Rev. Lett. 115, 137001 (2015).
- (13) J. Cui, Q.-P. Ding, W. R. Meier, A. E. Böhmer, T. Kong, V. Borisov, Y. Lee, S. L. Bud’ko, R. Valentí, P. C. Canfield, and Y. Furukawa, Phys. Rev. B 96, 104512 (2017).
- (14) Y. Li, Z. Yin, Z. Liu, W. Wang, Z. Xu, Y. Song, L. Tian, Y. Huang, D. Shen, D. L. Abernathy, J. L. Niedziela, R. A. Ewings, T.G. Perring, D. M. Pajerowski, M. Matsuda, P. Bourges, E. Mechthild, Y. Su, and P. Dai, Phys. Rev. Lett. 122, 117204 (2019).
- (15) A. Leithe-Jasper, W. Schnelle, H. Rosner, N. Senthilkumaran, A. Rabis, M. Baenitz, A. Gippius, E. Morozova, J. A. Mydosh, and Y. Grin, Phys. Rev. Lett. 91, 037208 (2003).
- (16) A. Leithe-Jasper, W. Schnelle, H. Rosner, M. Baenitz, A. Rabis, A. A. Gippius, E. N. Morozova, H. Borrmann, U. Burkhardt, R. Ramlau, U. Schwarz, J. A. Mydosh, Y. Grin, V. Ksenofontov, and S. Reiman, Phys. Rev. B 70, 214418 (2004).
- (17) W. Schnelle, A. Leithe-Jasper, H. Rosner, R. Cardoso-Gil, R. Gumeniuk, D. Trots, J. A. Mydosh, and Y. Grin, Phys. Rev. B 77, 094421 (2008).
- (18) E. Matsuoka, K. Hayashi, A. Ikeda, K. Tanaka, T. Takabatake, and M. Matsumura, J. Phys. Soc. Jpn. 74, 1382 (2005).
- (19) M. Matsumura, G. Hyoudou, H. Kato, T. Nishioka, E. Matsuoka, H. Tou, T. Takabatake, and M. Sera, J. Phys. Soc. Jpn. 74, 2205 (2005).
- (20) K. Ishida, H. Murakawa, K. Kitagawa, Y. Ihara, H. Kotegawa, M. Yogi, Y. Kitaoka, Ben-Li Young, M. S. Rose, D. E. MacLaughlin, H. Sugawara, T. D. Matsuda, Y. Aoki, H. Sato, and H. Harima, Phys. Rev. B 71, 024424 (2005).
- (21) Y. Nakai, K. Ishida, D. Kikuchi, H. Sugawara, and H. Sato, J. Phys. Soc. Jpn. 74, 3370 (2005)
- (22) M. Matsumura, H. Kato, T. Nishioka, E. Matsuoka, K. Hayashi, and T. Takabatake, J. Magn. Magn. Mater. 310, 1035 (2007).
- (23) K. Magishi, R. Watanabe, A. Hisada, T. Saito, K. Koyama, J. Phys. Soc. Jpn. 83, 84712 (2014).
- (24) W. Schnelle, A. Leithe-Jasper, M. Schmidt, H. Rosner, H. Borrmann, U. Burkhardt, J. A. Mydosh, and Y. Grin, Phys. Rev. B 72, 020402(R) (2005).
- (25) A. Sakurai, M. Matsumura, H. Kato, T. Nishioka, E. Matsuoka, K. Hayashi, and T. Takabatake, J. Phys. Soc. Jpn. 77, 063701 (2008).
- (26) A. Gippius, M. Baenitz, E. Morozova, A. Leithe-Jasper, W. Schnelle, A. Shevelkov, E. Alkaev, A. Rabis, J. Mydosh, Y. Grin, and F. Steglich, J. Magn. Magn. Mater. 300, 403(E) (2006).
- (27) K. Magishi, Y. Nakai, K. Ishida, H. Sugawara, I. Mori, T. Satito, and K. Koyama, J. Phys. Soc. Jpn. 75, 023701 (2006).
- (28) T. Takabatake, E. Matsuoka, S. Narazu, K. Hayashi, S. Morimoto, T. Sasakawa, K. Umeo, and M. Sera, Physica B 383, 93 (2006).
- (29) E. Matsuoka, S. Narazu, K. Hayashi, K. Umeo, and T. Takabatake, J. Phys.Soc. Jpn. 75, 014602 (2006).
- (30) K. Takegaraha, M. Kudoh, H. Harima, J. Phys. Soc. Jpn, 77, Supp. A. 294 (2008).
- (31) K. Nishine, Y. Kawamura, J. Hayashi, and C. Sekine, Jpn. J. Appl. Phys. 56, 05FB01 (2017).
- (32) A. Shankar, Sandeep, D. P. Rai, R. K. Thapa, and P. K. Mandal, J. App. Phys. 121, 055103 (2017).
- (33) Q.-P. Ding, K. Rana, K. Nishine, Y. Kawamura, J. Hayashi, C. Sekine, and Y. Furukawa, Phys. Rev. B 98, 155149 (2018).
- (34) C. B. H. Evers, L. Boonk, and W. Jeitschko, Z. Anorg. Allg. Chem. 620, 1028 (1994).
- (35) H. Tou, M. Doi, M. Sera, M. Yogi, Y. Kitaoka, H. Kotegawa, G.-q. Zheng, H. Harima, H. Sugawara, H. Sato, Physica B 359-361, 892 (2005).
- (36) H. Tou, Y. Inaoka, M. Doi, M. Sera, K. Asaki, H. Kotegawa, H. Sugawara, and H. Sato, J. Phys. Soc. Jpn. 80, 074703 (2011).
- (37) M. Yogi, H. Niki, M. Yashima, H. Mukuda, Y. Kitaoka, H. Sugawara, and H. Sato, J. Phys. Soc. Jpn. 78, 053703 (2009).
- (38) M. Shimizu, H. Amanuma, K. Hachitani, H. Fukazawa, Y. Kohori, T. Namiki, C. Sekine, and I. Shirotani, J. Phys. Soc. Jpn. 76, 104705 (2007).
- (39) M. Matsumura, G. Hyoudou, M. Itoh, H. Kato, T. Nishioka, E. Matsuoka, H. Tou, T. Takabatake, and M. Sera, J. Phys. Soc. Jpn. 76, 084716 (2007).
- (40) B. Nowak, O. Żogał, A. Pietraszko, R. E. Baumbach, M. B. Maple, and Z. Henkie, Phys. Rev. B 79, 214411 (2009).
- (41) B. Nowak, O. Żogał, Z. Henkie, and M.B. Maple, Solid State Commun. 151, 550 (2011).
- (42) M. Yogi, H. Niki, T. Kawata, and C. Sekine, JPS Conf. Proc. 3, 011046 (2014).
- (43) S. Takagi, H. Muraoka, T. D. Matsuda, Y. Haga, S. Kambe, R. E. Walstedt, E. Yamamoto, and Y. nuki, J. Phys. Soc. Jpn. 73, 469 (2004).
- (44) C. Dean, Phys. Rev. 96, 1053 (1954).
- (45) T. P. Das and E. L. Hahn, Nuclear Quadrupole Resonance Spectroscopy in Solid State Physics, Supplement I (Academic Press Inc., New York, 1958).
- (46) is proportional to the spin part of magnetic susceptibility () via hyperfine coupling constant : = . Here is Avogadro’s number and = 2 is the number of the nearest neighbor Os ions at the As site. In previous paper Ding2018 , = -2.24 0.60 kOe/ has been estimated from the above equation in SrFe4As12. This value is slightly smaller than the estimated hyperfine coupling constant = -3.84 1.60 kOe/ for the present case where the coupling constant is estimated from the linear fit of the plot using the data for both systems.
- (47) D. Mandrus, J. L. Sarrao, A. Migliori, J. D. Thompson, and Z. Fisk, Phys. Rev. B 51, 4763 (1995).
- (48) T. Moriya, J. Phys. Soc. Jpn. 18, 516 (1963).
- (49) A. Narath and H. T. Weaver, Phys. Rev. 175, 373 (1968).
- (50) Z. Li, Y. Ooe, X.- C Wang, Q.-Q. Liu, C.-Q. Jin, M. Ichioka, and G.-q. Zheng, J. Phys. Soc. Jpn. 79, 083702 (2010).
- (51) In this analysis, we have assumed that 1/ is isotropic. In order to check the anisotropy in 1/, we have measured the position dependence of 1/ in the As NQR spectrum under a magnetic field of 0.5 T. We do not observe significant change in 1/ at different positions (i.e., different ) of the spectrum within our experimental uncertainty, indicating that is nearly isotropic.
- (52) R. H.Hammond and W. D.Knight, Phys. Rev. 120, 762 (1960).
- (53) S. Wada, and K. Asayama, J. Phys. Soc. Jpn., 34, 1168 (1973).
- (54) F. Brückner, R. Sarkar, M. Günther, H. Kühne, H. Luetkens, T. Neupert, A. P. Reyes, P. L. Kuhns, P. K. Biswas, T. Stürzer, D. Johrendt, and H.-H. Klauss, Phys. Rev. B 90, 220503(R) (2014).
- (55) K. Matano, K. Arima, S. Maeda, Y. Nishikubo, K. Kudo, M. Nohara, and G.-q. Zheng, Phys. Rev. B 89, 140504(R) (2014).
- (56) L. C. Hebel, Phys. Rev. 116, 79 (1959).
- (57) Q.-P. Ding, P. Wiecki, V. K. Anand, N. S. Sangeetha, Y. Lee, D. C. Johnston, and Y. Furukawa, Phys. Rev. B 93, 140502(R) (2016).
- (58) Y. Kawamura, S. Deminami, L. Salamakha, A. Sidorenko, P. Heinrich, H. Michor, E. Bauer, and C. Sekine, Phys. Rev. B 98, 024513 (2018).