The ALPINE-ALMA [CII] Survey: A Triple Merger at
Abstract
We report the detection of [CII] emission from a system of three closely-separated sources in the COSMOS field at , as part of the ALMA Large Program to INvestigate CII at Early times (ALPINE). The two dominant sources are closely associated, both spatially ( kpc) and in velocity ( km s-1), while the third source is slightly more distant (kpc, km s-1). The second strongest source features a slight velocity gradient, while no significant velocity gradient is seen in the other two sources. Using the observed [C II] luminosities, we derive a total log, which may be split into contributions of 59%, 31%, and 10% from the central, east, and west sources, respectively. Comparison of these [C II] detections to recent zoom-in cosmological simulations suggests an ongoing major merger. We are thus witnessing a system in a major phase of mass build-up by merging, including an on-going major merger and an upcoming minor merger, which is expected to end up in a single massive galaxy by .
keywords:
galaxies: evolution – galaxies: interaction – galaxies: high-redshift1 Introduction
Cosmological zoom-in simulations of high-redshift galaxies (i.e., ) show that they built up mass through a complex process, with both continuous gas accretion from diffuse haloes and discrete episodes of major and minor mergers (e.g., Vallini et al. 2013; Pallottini et al. 2017; Kohandel et al. 2019; Pallottini et al. 2019).
While secular accretion is difficult to directly observe due to its low-excitation nature, observational evidence of merging at these high redshifts is pervasive. The brightest examples of merging are galaxies undergoing bursts in star formation apparently driven by major mergers (e.g., Oteo et al. 2016; Riechers et al. 2017; Pavesi et al. 2018; Marrone et al. 2018). In addition, resolved spectral observations have revealed evidence of merging in star-forming main-sequence galaxies (SFGs; e.g., Noeske et al. 2007; Speagle et al. 2014), or galaxies whose stellar masses and star formation rate show a correlation, with a normalization that evolves with redshift. This evidence of merging is manifest as a clumpy morphology (Ouchi et al. 2013; Riechers et al. 2014; Maiolino et al. 2015; Capak et al. 2015; Willott et al. 2015; Carniani et al. 2017; Barisic et al. 2017; Jones et al. 2017; Matthee et al. 2017; Ribeiro et al. 2017; Carniani et al. 2018b; Carniani et al. 2018a; Matthee et al. 2019), which is interpreted as ongoing galaxy assembly via minor mergers. The presence of clumps may also be explained by gravitational instabilities inside disk galaxies (e.g., Agertz et al. 2009), and the true nature of a source may only be revealed using detailed kinematic information (e.g., from spectroscopy). Despite the number of individual detections, the sample of observed mergers at confirmed from dynamical arguments is still statistically low, and more detections are required in order to characterize the merger rate as a function of cosmological time at these high redshifts.
The need for a more systematic merger identification and characterization at can be fulfilled by the ALMA Large Program to INvestigate CII at Early times (ALPINE; Faisst et al. 2019, Le Fèvre et al. in prep.), which observed [C II] emission and rest-frame m continuum emission from 118 SFGs in the Cosmic Evolution Survey (COSMOS) and Extended Chandra Deep Field-South (ECDFS) fields with , SFR M⊙ year-1, log(M∗/M, and L L∗. These cuts were made to ensure that the sample represents the overall galaxy population at this epoch
Since [C II] is generally the brightest FIR emission line for star forming galaxies (Carilli & Walter, 2013) and is emitted from all the gas phases (ionized, neutral and molecular) of the interstellar medium (ISM; Pineda et al. 2013), it is a prime tracer of the gas kinematics of high-redshift galaxies. As an example of mergers identified in the ALPINE survey, we detail here the detection of [C II] and dust continuum emission from the dusty triple merger DEIMOS_COSMOS_818760 (hereafter DC 818760).
Because it is located in the well-studied COSMOS field (Scoville et al. 2007a, b), DC 818760 has been observed with a number of NUV-NIR instruments, including HST, Subaru, and Spitzer (Laigle et al., 2016). Using the broadband (i.e., CFHT u through Spitzer IRAC 8.0 m) SED of DC 818760 and the SED modelling code LePHARE (Arnouts et al. 1999; Ilbert et al. 2006; Arnouts & Ilbert 2011) with a Chabrier initial mass function and Calzetti starburst extinction law, Faisst et al. (in prep) find a stellar mass of log(M and a star formation rate log(SFR year M⊙ year-1. These values place DC 818760 on the upper envelope of the main sequence at (Speagle et al., 2014; Tasca et al., 2015).
In addition, DC 818760 is nearby (i.e., proper Mpc and km s-1) the massive protocluster PC1 J1001+0220 (Lemaux et al., 2018). Since it lies along the major axis of the protocluster, and is only proper Mpc from the northeast component of this protocluster, DC 818760 may be associated with the system in a filamentary structure.
In this work, we discuss new ALMA observations of [C II] and submm continuum emission from DC 818760 obtained as part of the ALMA large program ALPINE, and examine its triple merger nature. We assume a flat -CDM cosmology (, , H km s-1) throughout. At the redshift of DC 818760 (), 1 arcsecond corresponds to 6.563 proper kpc .
2 Observations & Data Reduction
The [C II] emission from DC 818760 was observed with ALMA on 25 May, 2018 in cycle 5 (project 2017.1.00428.L, PI O. Le Fèvre) using configuration C43-2 (baselines m), 45 antennas, and an on-source time of 17 minutes. J0158+0133 was used as a bandpass and flux calibrator, while J0948+0022 was used as a phase calibrator.
The spectral setup consisted of two sidebands, each constructed of two spectral windows (SPWs) of width 1.875 GHz. Each SPW was made of channels of width 15.625 MHz. The lower sideband is tuned to the redshifted [C II] frequency, while the upper sideband is solely used for continuum.
Calibration was performed using the heuristic-based CASA 5.4.1 automatic pipeline, with reduced automatic band-edge channel flagging (Béthermin et al. in prep). The pipeline calibration diagnostics were inspected carefully and no issues were found. To maximise sensitivity, we adopted natural weighting.
Continuum and line emission were separated using the CASA task uvcontsub. The lower sideband was made into a data cube using the CASA task tclean, resulting in an average RMS noise level per 15.625 MHz ( km s-1) channel of 0.6 mJy beam-1 and a synthesized beam of at. To maximize sensitivity, one continuum image was created using all line-free data in both sidebands using tclean in multi-frequency synthesis mode. This results in a continuum image with an RMS noise level of 0.05 mJy beam-1 and the same synthesized beam as the upper sideband.
3 Imaging Results
In order to investigate the [C II] emission in this source, we first examine which channels show emission with (=0.6 mJy beam-1). Using these channels (see shaded channel range of Figure 2) and the CASA task immoments, we create a moment zero image of the total [C II] emission (contours of Figure 1). Three [C II] sources are present, all roughly at the same declination.
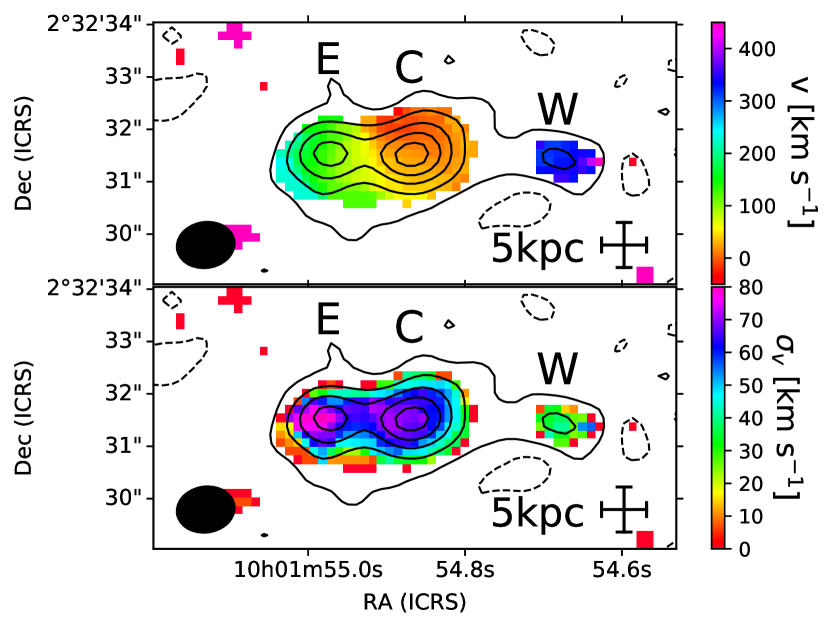
Using the CASA task imfit, we simultaneously fit three two-dimensional Gaussians to the moment zero map. The central source of this best fit (C) features an integrated flux density Jy km s-1, a peak flux density Jy beam-1 km s-1, and a beam-deconvolved size at a position angle , defined counterclockwise from north. The second source (E), which is ( kpc) to the east of source C, shows an integrated flux density Jy km s-1, a peak flux density Jy beam-1 km s-1, and a deconvolved size at a position angle . Lastly, the weakest source, (W) which is ( kpc) west of source C, has an integrated flux density Jy km s-1, a peak flux density Jy beam-1 km s-1, and is unresolved.
The kinematics of this field are revealed by the velocity field (moment one image), created using the CASA task immoments (top panel color of Figure 1). While the two brightest sources (i.e., C and E) are only separated by km s-1, source W is km s-1 offset from source C. Sources C and W show nearly constant velocity, while source E shows a strong gradient ( km s-1).
The immoments task may also be used to create a velocity dispersion (moment two) map (bottom panel color of Figure 1). Source W shows a relatively low velocity dispersion ( km s-1), while sources C and E exhibit strong peaks in velocity dispersion ( km s-1, km s-1). These peaks may be artificially enhanced by beam smearing (e.g., Weiner et al. 2006), but each is spatially coincident with a [C II] source.
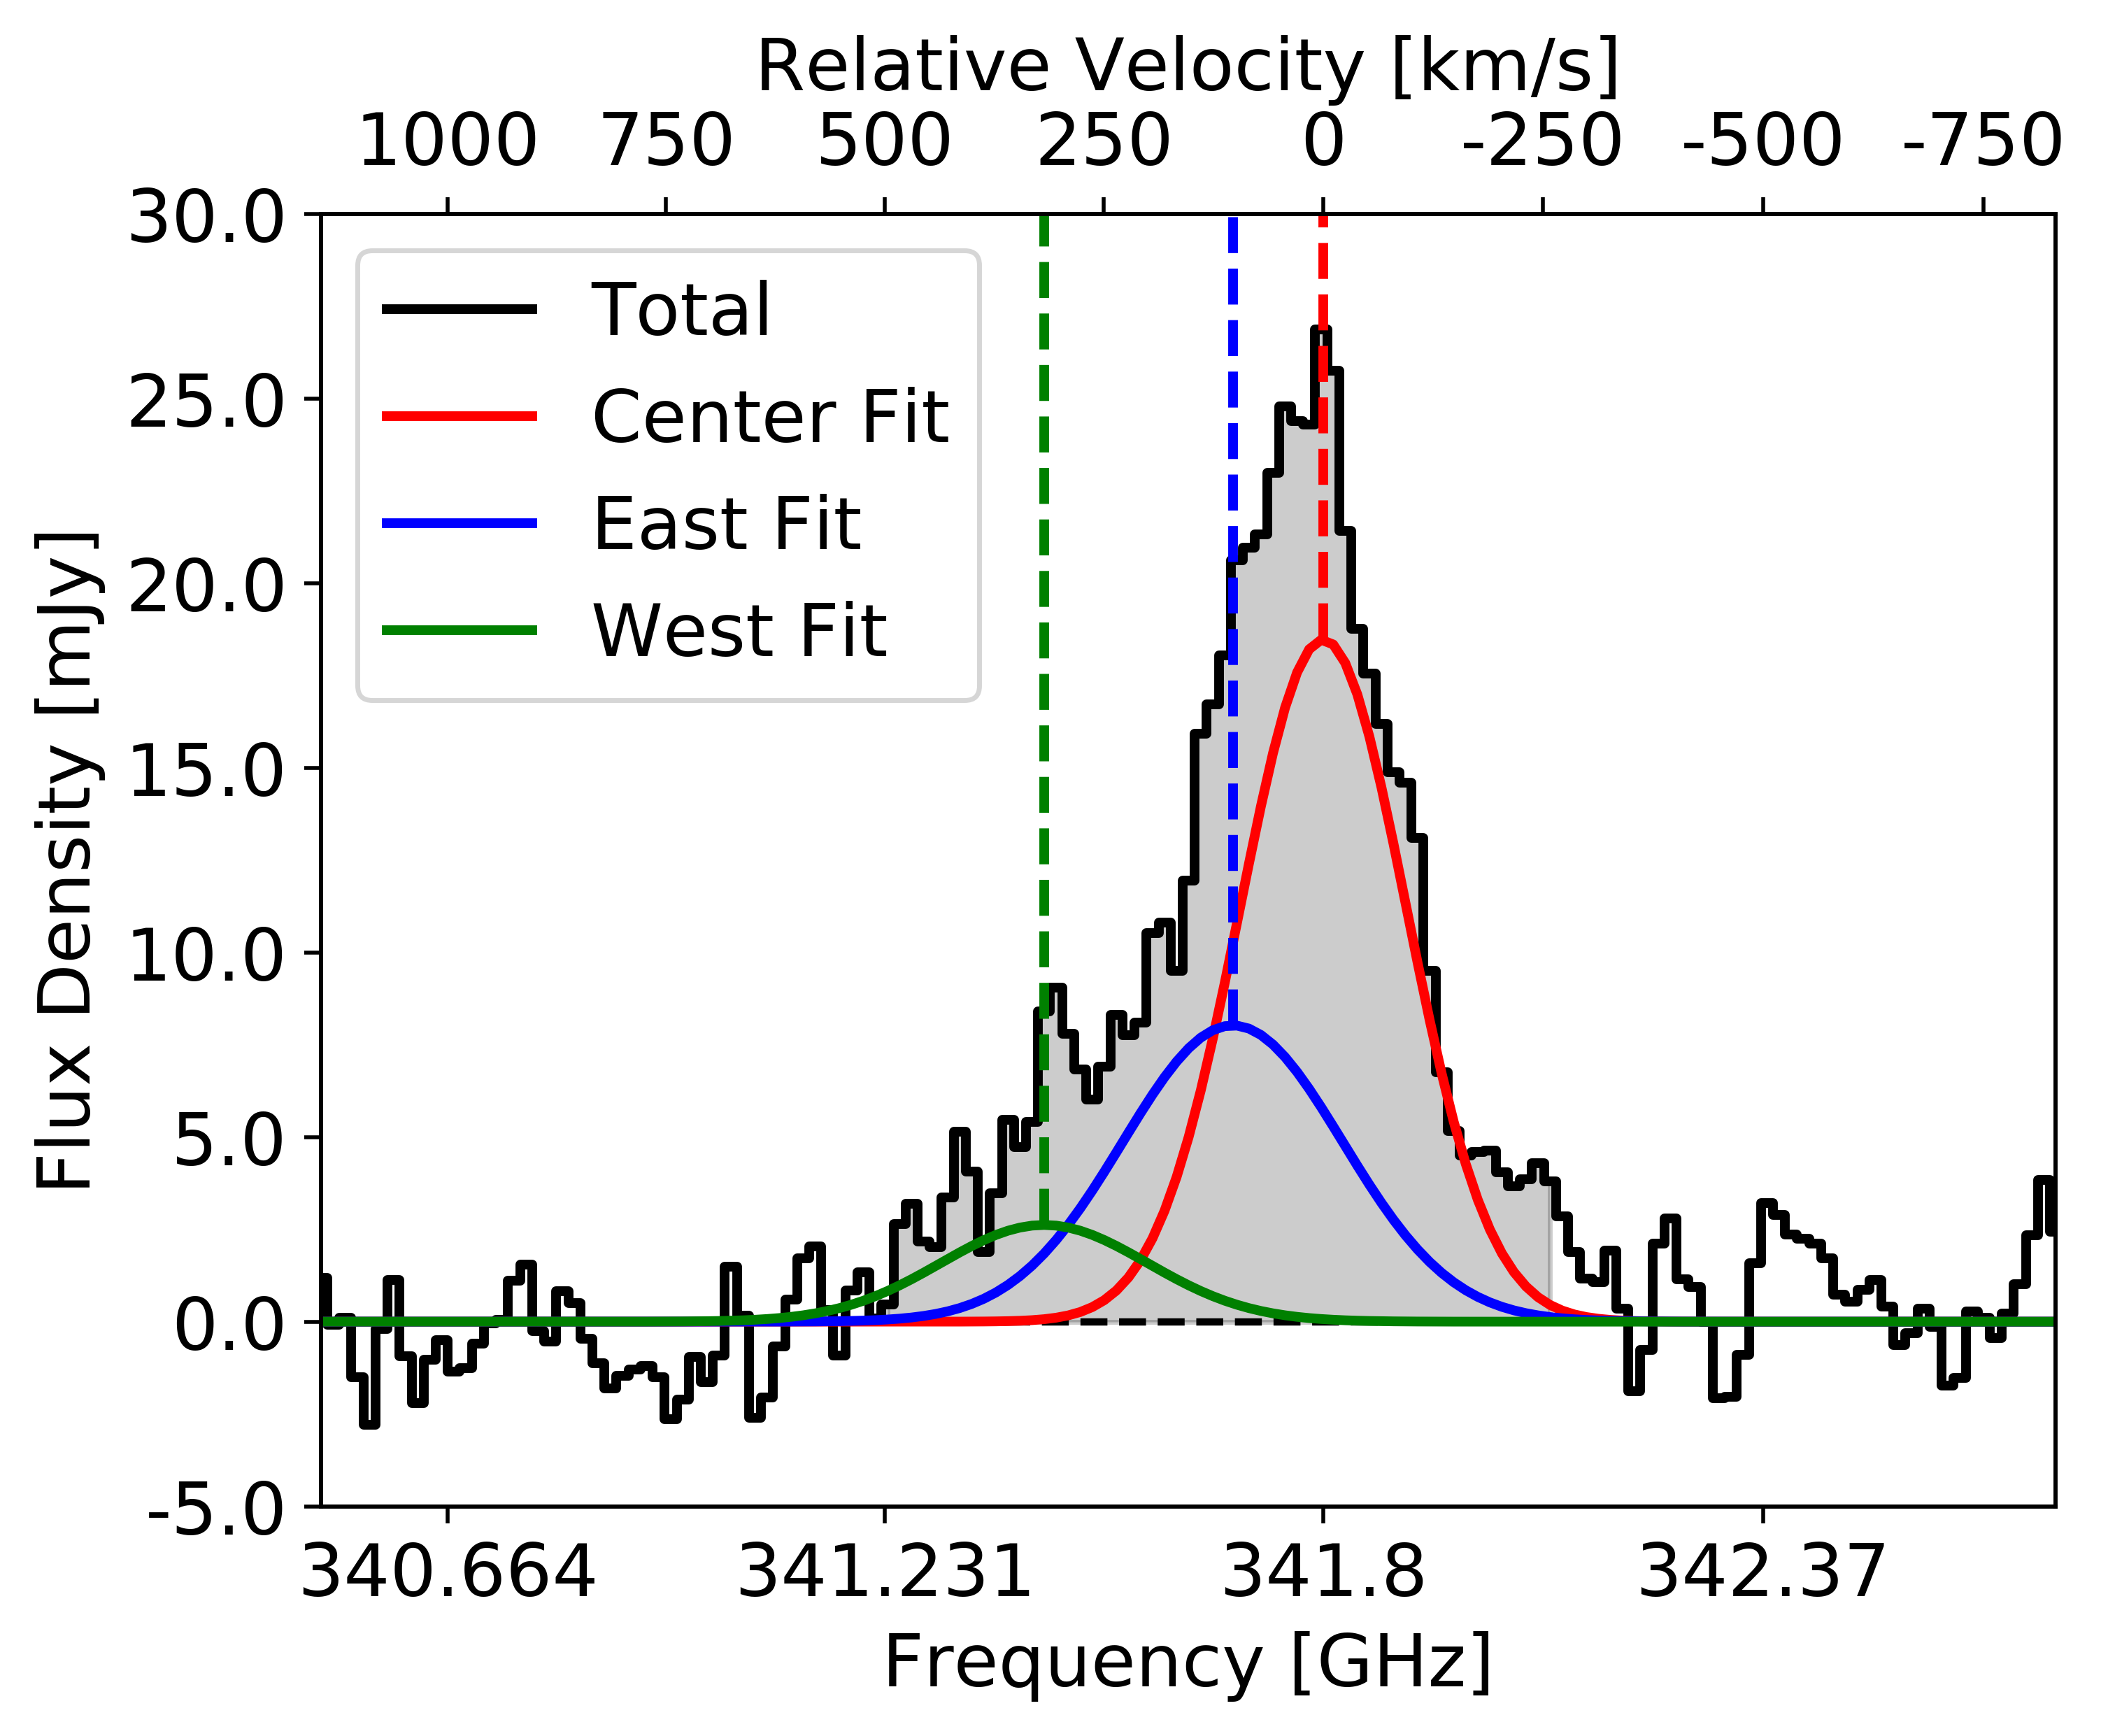
Extracting a spectrum over the contour of the moment zero map, which contains all three sources, we obtain the profile shown in Figure 2 (black line). In order to determine the contribution of each source, we first assign each spaxel within the moment zero contour to one of the three sources, based on the relative contributions of each of the three Gaussian components output from CASA imfit. The corresponding pixels for each source are then integrated to produce three integrated spectra. For clarity, each spectrum is fit with a one-dimensional Gaussian, and displayed in Figure 2, along with its centroid velocity. We find that sources E and W are both redshifted with respect to source C by and km s-1, respectively. The redshift of the dominant source C, which will be used as the redshift of this field, is .
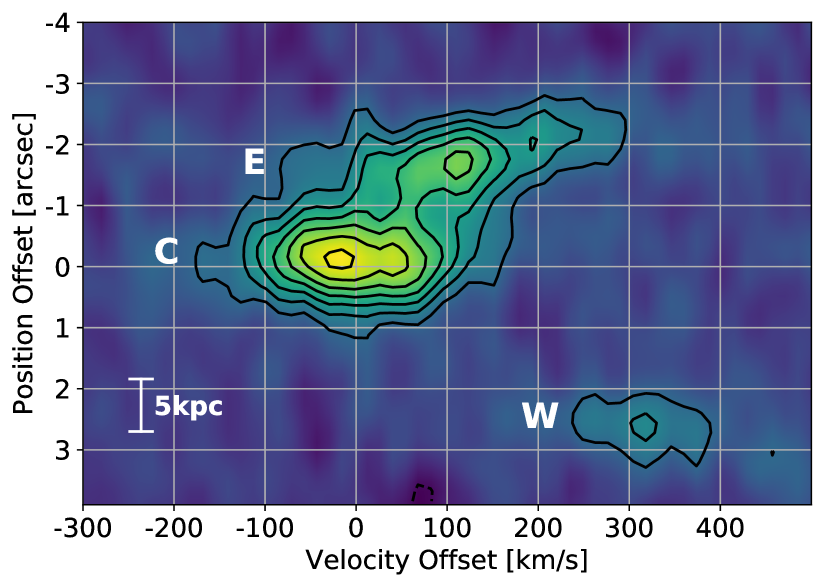
To examine the kinematics of this system in another way, we create a position-velocity (PV) diagram (CASA impv) by extracting a 5 pixel thick (1 pixel=), long slice across the right ascension axis of the data cube, centered on the central source. This 3D slice was then averaged in declination to create a single intensity plane (see Figure 3). This PV diagram confirms that both of the fainter sources (i.e., E and W) are moving at positive velocities with respect to source C, as seen in the spectra (Figure 2). While the sources C and E are closely connected, the source C and W are separated by kpc and km s-1 .
In addition to [C II] emission, dust continuum emission is detected at the location of all three sources (white contours of Figure 4). While the [C II] emission features three distinct peaks, the bulk of the continuum emission is concentrated in source C, with a strong extension to the east, and a component coincident with source W. A single component, two-dimensional Gaussian fit to the combined emission of the source C and its eastern extension using CASA imfit yields a peak flux density of mJy beam-1, an integrated flux density of mJy, and a deconvolved size of at . The continuum emission from source W is unresolved, with a peak flux density of mJy beam-1 and integrated flux density of mJy.
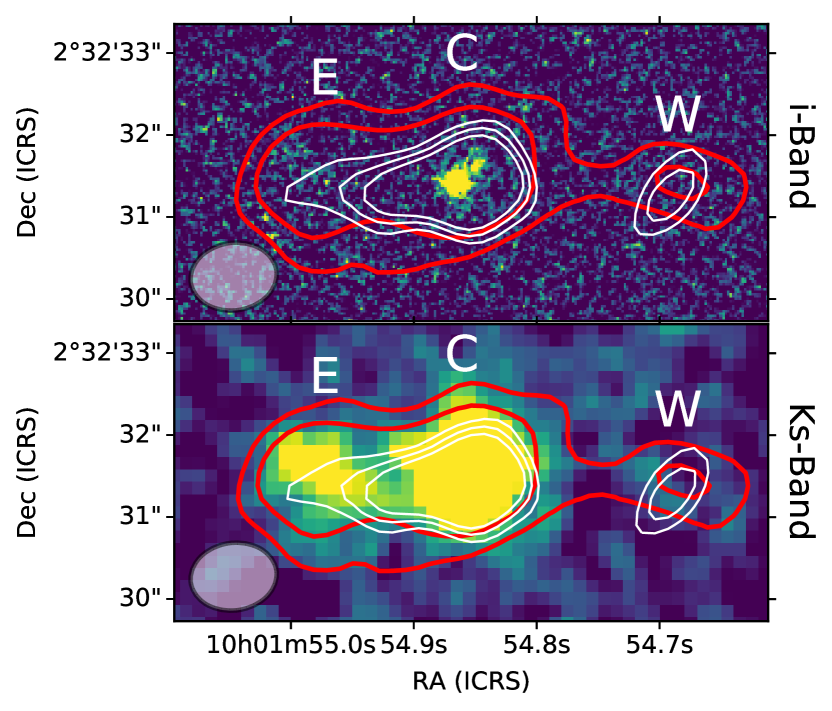
The HST/ACS F814W (i-band) image of this source reveals emission from only source C. This emission may be decomposed into two components separated by only (1.9 kpc), possibly indicating a small-separation merger. On the other hand, the UltraVISTA Ks-band image of this field (which is magnitudes less sensitive) shows emission from both source C and E. Neither image shows significant emission from source W. This dramatic increase in the emission between the i-band (Å) and Ks-band (Å) for source E may indicate a steep UV slope, implying a significant dust presence (e.g., Calzetti et al. 2000).
4 Analysis
4.1 Star Formation Rate
The empirical L[CII] to SFR calibration of De Looze et al. (2014) for their full sample of star-forming galaxies may be used to estimate the SFR of each source individually. We note that Carniani et al. (2018a) found that a sample of [C II] star-forming galaxies featured a larger dispersion in this relation than is stated in De Looze et al. (2014) for local galaxies, so the resulting uncertainties in SFR for DC 818760 are likely slightly underestimated. The three L[CII]-derived star formation rates (see Table 1) sum to log. Comparing the different sources, we find that the star formation activity of the system may be split into contributions from source C (), E (), and W ().
Using flux densities extracted from an aperture centered on source C of diameter , which encloses only source C and a portion of source E, Faisst et al. (in prep) created a broadband SED of DC 818760, and fit it with LePHARE. The resulting value of log is in agreement with our value for the source C of log, suggesting that [CII] is an appropriate SFR tracer in this source.
| C | E | W | CE | CEW | |
| Right Ascension | 10h01m54.865s | 10h01m54.978s | 10h01m54.683s | ||
| Declination | +2∘32′31.53′′ | +2∘32′31.50′′ | +2∘32′31.44′′ | ||
| v[CII] [Jy km s-1] | |||||
| Scont [mJy] | |||||
| log(L[CII] [L⊙]) | |||||
| log(SFR[CII] [M⊙ year-1]) |
4.2 Comparison to Simulations
The recent zoom-in cosmological simulations of Kohandel et al. (2019) detail the evolution of a disk galaxy (“Althæa”) undergoing minor and major merger events between , and give both face-on and edge-on spectra for several evolutionary stages. In order to further characterize DC 818760, we compare our [C II] observations with the results of these simulations.
First, the global spectrum of DC 818760 (Figure 2) shows an asymmetric Gaussian, composed of the dominant source C and the slightly weaker source E. This feature is also seen in the face-on merger spectrum of Althæa (figure 6 of Kohandel et al. 2019). This similarity supports the merger interpretation of these two sources.
In addition, Kohandel et al. (2019) highlight the fact that galaxies with narrow spectral profiles (i.e., face-on disks, dispersion-dominated systems) are more easily observed than galaxies whose emission is spread over a broad velocity range (i.e., edge-on disks, mergers), due to their high peak flux density. This implies that additional components of the DC 818760 system may also be present, but are too faint to be detected in our current observation. Indeed, the simulated galaxy Dahlia (, SFR M⊙ year-1; Pallottini et al. 2017) features 14 satellite clumps within 100 kpc of its central galaxy, but only three of them were detected in [C II] emission in a simulated observation. Thus, the DC 818760 system is likely more complex than the three sources that we observe.
5 Conclusions
In this letter, we have presented the detection of [C II] emission from three sources in the field DC 818760, as observed with ALMA as part of the large program ALPINE. The two dominant sources (C and E) are closely associated, both spatially ( kpc) and in velocity ( km s-1), while the third source (W) is separate (kpc, km s-1). Source E features a strong velocity gradient, which may either suggest a rotating galaxy or a tidally disrupted galaxy, while the others exhibit nearly constant velocity. All three show velocity dispersion peaks coincident with the peak of [CII] emission. Due to their kinematical properties, we conclude that the three sources in this field are separate objects, not members of the same galaxy.
The close spatial separation, low velocity offset, and similar [C II] luminosities (LL) of sources C and E suggest an ongoing major merger (Lotz et al., 2011). Dynamical arguments from merger simulations (e.g. Kitzbichler & White 2008) indicate that these two sources will merge within Gyr. On the other hand, sources C and W are spatially and kinematically separate, but only by kpc and km s-1. This close separation and their large luminosity ratio (LL) suggests that they will coalesce in a minor merger at a later time.
Based on both rest-frame UV observations and FIR continuum detections, there is strong evidence for significant internal extinction. Regarding the former, DC 818760 was originally targeted with DEIMOS (Hasinger et al., 2018) using a slit coincident only with the central source. Ly emission was not detected, but rather only UV ISM absorption lines, which strengthens the argument for dust obscuration.
Using the observed [C II] luminosities, we derive a total log, which may be split into 59%, 31%, and 10% from sources C, E, and W, respectively. Comparison to cosmological zoom-in simulations show that the two dominant components resemble a merger and that the field likely contains multiple undetected sources
We are thus witnessing a massive galaxy in the early phase of mass assembly with merging playing a major role. This system contains three kinematically distinct components: two currently undergoing a major merger (i.e., C and E), and a third minor component that will likely merge with the other two in the future (i.e., W). While the example given by this system is striking, larger samples are needed in order to assess how frequent such systems may be. The ALPINE sample is providing the opportunity to acquire a robust statistical knowledge of normal star-forming galaxies undergoing rapid mass growth, as will be presented in forthcoming papers.
Acknowledgements
This paper is based on data obtained with the ALMA Observatory, under Large Program 2017.1.00428.L. ALMA is a partnership of ESO (representing its member states), NSF (USA) and NINS (Japan), together with NRC (Canada), MOST and ASIAA (Taiwan), and KASI (Republic of Korea), in cooperation with the Republic of Chile. The Joint ALMA Observatory is operated by ESO, AUI/NRAO and NAOJ. Based on data products from observations made with ESO Telescopes at the La Silla Paranal Observatory under ESO programme ID 179.A-2005 and on data products produced by TERAPIX and the Cambridge Astronomy Survey Unit on behalf of the UltraVISTA consortium. This program is supported by the national program Cosmology and Galaxies from the CNRS in France. G.C.J. and R.M. acknowledge ERC Advanced Grant 695671 “QUENCH” and support by the Science and Technology Facilities Council (STFC). D.R. acknowledges support from the National Science Foundation under grant number AST-1614213 and from the Alexander von Humboldt Foundation through a Humboldt Research Fellowship for Experienced Researchers. A.C., F.P. and M.T. acknowledge the grant MIUR PRIN2017. L.V. acknowledges funding from the European Union’s Horizon 2020 research and innovation program under the Marie Sklodowska-Curie Grant agreement No. 746119. E.I. acknowledges partial support from FONDECYT through grant N∘ 1171710.
References
- Agertz et al. (2009) Agertz O., Teyssier R., Moore B., 2009, MNRAS, 397, L64
- Arnouts & Ilbert (2011) Arnouts S., Ilbert O., 2011, LePHARE: Photometric Analysis for Redshift Estimate (ascl:1108.009)
- Arnouts et al. (1999) Arnouts S., Cristiani S., Moscardini L., Matarrese S., Lucchin F., Fontana A., Giallongo E., 1999, MNRAS, 310, 540
- Barisic et al. (2017) Barisic I., et al., 2017, ApJ, 845, 41
- Calzetti et al. (2000) Calzetti D., Armus L., Bohlin R. C., Kinney A. L., Koornneef J., Storchi-Bergmann T., 2000, ApJ, 533, 682
- Capak et al. (2015) Capak P. L., et al., 2015, Nature, 522, 455
- Carilli & Walter (2013) Carilli C. L., Walter F., 2013, ARA&A, 51, 105
- Carniani et al. (2017) Carniani S., et al., 2017, A&A, 605, A42
- Carniani et al. (2018a) Carniani S., et al., 2018a, MNRAS, 478, 1170
- Carniani et al. (2018b) Carniani S., Maiolino R., Smit R., Amorín R., 2018b, ApJ, 854, L7
- De Looze et al. (2014) De Looze I., et al., 2014, A&A, 568, A62
- Faisst et al. (2019) Faisst A., Bethermin M., Capak P., Cassata P., LeFevre O., Schaerer D., Silverman J., Yan L., 2019, arXiv e-prints, p. arXiv:1901.01268
- Hasinger et al. (2018) Hasinger G., et al., 2018, ApJ, 858, 77
- Ilbert et al. (2006) Ilbert O., et al., 2006, A&A, 457, 841
- Jones et al. (2017) Jones G. C., Willott C. J., Carilli C. L., Ferrara A., Wang R., Wagg J., 2017, ApJ, 845, 175
- Kitzbichler & White (2008) Kitzbichler M. G., White S. D. M., 2008, MNRAS, 391, 1489
- Koekemoer et al. (2007) Koekemoer A. M., et al., 2007, ApJS, 172, 196
- Kohandel et al. (2019) Kohandel M., Pallottini A., Ferrara A., Zanella A., Behrens C., Carniani S., Gallerani S., Vallini L., 2019, MNRAS, p. 1423
- Laigle et al. (2016) Laigle C., et al., 2016, ApJS, 224, 24
- Lemaux et al. (2018) Lemaux B. C., et al., 2018, A&A, 615, A77
- Lotz et al. (2011) Lotz J. M., Jonsson P., Cox T. J., Croton D., Primack J. R., Somerville R. S., Stewart K., 2011, ApJ, 742, 103
- Maiolino et al. (2015) Maiolino R., et al., 2015, MNRAS, 452, 54
- Marrone et al. (2018) Marrone D. P., et al., 2018, Nature, 553, 51
- Matthee et al. (2017) Matthee J., et al., 2017, ApJ, 851, 145
- Matthee et al. (2019) Matthee J., et al., 2019, arXiv e-prints, p. arXiv:1903.08171
- McCracken et al. (2012) McCracken H. J., et al., 2012, A&A, 544, A156
- Noeske et al. (2007) Noeske K. G., et al., 2007, ApJ, 660, L43
- Oteo et al. (2016) Oteo I., et al., 2016, ApJ, 827, 34
- Ouchi et al. (2013) Ouchi M., et al., 2013, ApJ, 778, 102
- Pallottini et al. (2017) Pallottini A., Ferrara A., Gallerani S., Vallini L., Maiolino R., Salvadori S., 2017, MNRAS, 465, 2540
- Pallottini et al. (2019) Pallottini A., et al., 2019, MNRAS, 487, 1689
- Pavesi et al. (2018) Pavesi R., et al., 2018, ApJ, 861, 43
- Pineda et al. (2013) Pineda J. L., Langer W. D., Velusamy T., Goldsmith P. F., 2013, A&A, 554, A103
- Ribeiro et al. (2017) Ribeiro B., et al., 2017, A&A, 608, A16
- Riechers et al. (2014) Riechers D. A., et al., 2014, ApJ, 796, 84
- Riechers et al. (2017) Riechers D. A., et al., 2017, ApJ, 850, 1
- Scoville et al. (2007a) Scoville N., et al., 2007a, ApJS, 172, 1
- Scoville et al. (2007b) Scoville N., et al., 2007b, ApJS, 172, 38
- Speagle et al. (2014) Speagle J. S., Steinhardt C. L., Capak P. L., Silverman J. D., 2014, ApJS, 214, 15
- Tasca et al. (2015) Tasca L. A. M., et al., 2015, A&A, 581, A54
- Vallini et al. (2013) Vallini L., Gallerani S., Ferrara A., Baek S., 2013, MNRAS, 433, 1567
- Weiner et al. (2006) Weiner B. J., et al., 2006, ApJ, 653, 1027
- Willott et al. (2015) Willott C. J., Carilli C. L., Wagg J., Wang R., 2015, ApJ, 807, 180