Satrajit Roychoudhury, Pfizer Inc, New York, NY, USA
Beyond p-values: a phase II dual-criterion design with statistical significance and clinical relevance
Abstract
Background
Well-designed phase II trials must have acceptable error rates
relative to a pre-specified success criterion, usually a statistically
significant p-value. Such standard designs may not always suffice from
a clinical perspective because clinical relevance may call for more. For
example, proof-of-concept in phase II often requires not only statistical
significance but also a sufficiently large effect estimate.
Purpose
We propose dual-criterion designs to complement statistical
significance with clinical relevance, discuss their methodology,
and illustrate their implementation in phase II.
Methods
Clinical relevance requires the effect estimate to pass a clinically
motivated threshold (the decision value). In contrast to standard
designs, the required effect estimate is an explicit design input
whereas study power is implicit. The sample size for a dual-criterion
design needs careful considerations of the study’s operating characteristics
(type-I error, power).
Results
Dual-criterion designs are discussed for a randomized controlled and a
single-arm phase II trial, including decision criteria, sample size
calculations, decisions under various data scenarios, and operating
characteristics. The designs facilitate GO/NO-GO decisions due to
their complementary statistical-clinical criterion.
Limitations
While conceptually simple, implementing a dual-criterion design needs
care. The clinical decision value must be elicited carefully in
collaboration with clinicians, and understanding similarities and
differences to a standard design is crucial.
Conclusion
To improve evidence-based decision-making, a formal yet transparent
quantitative framework is important. Dual-criterion designs offer an
appealing statistical-clinical compromise, which may be preferable to
standard designs if evidence against the null hypothesis alone
does not suffice for an efficacy claim.
keywords:
Clinical relevance, dual-criterion, evidence, GO/NO-GO, operating characteristics, phase II design, proof-of-concept, statistical significance1 Introduction
Making evidence-based decisions is essential in drug development. To conclude activity of a drug, such decisions usually require a statistically significant p-value from a well-designed trial. However, statistical significance alone may not suffice if the trial does not deliver a clinically relevant effect estimate (Wasserstein and Lazar 1). We discuss a simple dual-criterion design that formally combines a statistical (significance) and clinical (effect size estimate) criterion.
Here we focus on phase II trials, which play a key role in drug development. In particular, Proof-of-Concept (PoC) is a milestone, the earliest point when the efficacy of an experimental drug is formally investigated. PoC trials typically lead to one of the following decisions: continue further development (GO), stop development (NO-GO), or seek further information.
The consequences of false decisions in phase II can be severe. Therefore, irrespective of the chosen design, understanding statistical error rates is important. For example, false-positive results (type-I errors) in PoC trials will lead to phase III trials with ineffective experimental drugs and likely cause negative results. On the other hand, false negative results (type-II errors) will often stop the development of a potentially useful drug. Various phase II design options have been proposed, with primary focus on error rate control (e.g. Fleming 2, Herson and Carter 3, Simon 4, Schaid et al. 5, Storer 6, Liu et al.7, 8, Sargent et al. 9, Korn et al. 10, Rubinstein et al. 11, Simon et al.12, Parashar et al. 13).
GO or NO-GO decisions should always be seen in the context of the clinical needs and the competitive landscape (Cartwright et al. 14), which requires discussions among clinical teams, governance boards, and key opinion leaders. Consensus is important and easier to reach if trial results meet a pre-defined clinical criterion. A few proposals to formally account for a relevant effect size in clinical and other settings have been discussed (Nicewander and Price 15, Chuang-Stein et al. 16,17, Neuenschwander et al. 18, Fisch et al. 19, Frewer et al.20). Here, we will discuss a simple dual-criterion, which we have applied in many phase II trials.
We will first review three generic phase II designs: the standard, dual-criterion, and precision design. We then describe the dual-criterion design in more detail and show a frequentist and Bayesian application.
2 Design choices for phase II trials
In this section, we introduce the main components of three basic phase II designs: the standard, dual-criterion, and precision design (Table 1).
2.1 The standard design
The standard design is very popular in drug development. For comparative (treatment vs. control) trials, it puts forward stringent statistical criteria expressed as error rates:
-
1.
type-I error control: if there is no treatment effect (the null hypothesis), the probability to declare success at the end of the trial is at most . Typical values for (one-sided) are 2.5% for confirmatory trials, and 5% or 10% for early phase trials. Here, success means statistical significance.
-
2.
power: for a selected effect size of interest (the alternative hypothesis), the probability of trial success is 80% or 90%.
While the standard design prevails in the confirmatory setting, its limitations are well-known (Senn 21). The main issue is that statistical significance only guarantees sufficient evidence to reject the null hypothesis (no effect), which may not suffice from a clinical perspective. Importantly, statistical significance does not necessarily support the alternative hypothesis, except when the p-value is highly significant.
2.2 The dual-criterion design
The dual-criterion design addresses the limitation of the standard design. It is appealing if one wants to base trial success not only on statistical significance but also on the effect estimate, which is more tangible for clinicians. The design requires the following inputs (Table 1):
-
1.
Like the standard design, type-I error control is needed, which requires a null hypothesis and type-I error . Eventually, a significant p-value will provide sufficient evidence for a positive treatment effect.
-
2.
Unlike the standard design, the dual-criterion design requires a decision value, which is clinically motivated. The decision value is the minimum effect estimate needed for trial success. Estimates superior to this value justify a GO decision, whereas inferior values do not and will usually require additional considerations.
Compared to the standard design, the dual-criterion design combines the rigid statistical criteria (significant p-value, type-I error control) with a clinical criterion that guarantees a sufficiently large effect estimate.
2.3 The precision design
The two previous designs rely on error rates (type-I error, power), which require clearly defined criteria for trial success. For the special case where the null hypothesis and other benchmark values (alternative hypothesis or decision value) cannot be determined, a precision design may be an option. It requires a sufficiently precise effect estimate, usually defined via the width of the 95% confidence interval.
2.4 Example
We now illustrate the three designs with a simple example. Consider a randomized trial with patients equally randomized to the experimental drug and control. The outcome of interest is the hazard-ratio (HR) for progression-free survival (PFS), where the HR is less than one if the experimental drug is better than the control.
The standard design requires a null hypothesis with corresponding type-I error and an alternative parameter with corresponding power (Table 1). For example, assume a superiority trial (null hypothesis HR=1), one-sided type-I error 2.5%, and 90% power under a 25% hazard reduction (alternative hypothesis HR=0.75). The number of events to meet these requirements is 508. For this design, statistical significance is achieved if the estimated HR is 0.84, a hazard reduction of 16%. Note that this estimate threshold is implicit; that is, it follows from the design specifications.
The dual-criterion design requires a null hypothesis (with corresponding one-sided type-I error ) and the decision value for the effect estimate. As seen above, success for the standard design (with n=508 events) requires an estimated hazard reduction of at least 16%. If clinical considerations require an estimated reduction of at least 20%, the number of events must be at least 309 (see next section for details). Importantly, the dual-criterion design also controls the type-I error at 2.5%, but the power is implicit; that is, it follows from the type-I error and the decision value criterion. For 309 events, the power is smaller than for the standard design. The reason is simple: an estimated hazard reduction of 20% (the clinical criterion) is more difficult to achieve than a 16% hazard reduction (considered clinically insufficient) for the standard design.
For the precision design, which assumes no comparative benchmarks (null hypothesis, alternative hypothesis, decision value), assume that the aim is to estimate the HR with ”20% precision”: 95%-interval = (HR/1.2, HR1.2). This requires 462 events. For ”25% precision”, 95%-interval = (HR/1.25, HR1.25), the number of events is 309.
| standard design | dual-criterion design | precision design | |
| null value | required | required | - |
| alternative value | required | - | - |
| decision value | (implied) | required | - |
| type-I error | required | required | - |
| power | required | (implied) | - |
| precision of estimate | (implied) | (implied) | required |
| sample size | (implied) | (implied) | (implied) |
2.5 Dual-criterion designs: criteria, outcomes, and decisions
The dual-criterion design is recommended for comparative trials if the required evidence for an effect can be expressed for two benchmarks: the null value (null hypothesis) and the decision value for the effect estimate. For a GO-decision, the evidence must be sufficiently strong that the effect is better than the null value and that the effect estimate reaches the clinically relevant decision value. The criteria are
-
1.
statistical significance: the one-sided p-value must be less than . Equivalently, the one-sided confidence interval must exclude the null value.
-
2.
clinical relevance: the estimated effect must reach the decision value.
Regarding the statistical criterion, 10%, 5%, and 2.5% are commonly used for the one-sided type-I error , depending on the required strength of evidence to reject the null hypothesis. The clinical criterion must be elicited from clinical experts. Table 2 shows the four possible outcomes of a dual-criterion design:
-
•
case 1: if trial results fail both criteria, the decision will be a NO-GO.
-
•
case 2: if the statistical and clinical criteria are both met, the decision will be a GO.
-
•
cases 3 and 4: inconclusive situations arise when only one criterion holds. For example, for large trials or unexpectedly small variability of the outcome, statistical significance may hold, yet the estimate may miss the decision value (case 3). On the other hand, for small trials or unexpectedly large variability of the outcome, the effect estimate may pass the decision value, but statistical significance may not hold (case 4).
| not relevant | relevant | |
| (1) | (4) | |
| not significant | NO-GO | inconclusive |
| insufficient evidence | ||
| of relevant efficacy | ||
| (3) | (2) | |
| significant | inconclusive | GO |
| evidence of | ||
| relevant efficacy |
![[Uncaptioned image]](/html/1908.07751/assets/x1.png)
The planning of a dual-criterion trial requires carefully selected decision criteria and sample size. The dual criterion must be based on clinical input, which necessitates effective collaborations between statisticians and clinicians. Understanding the similarities and differences between a standard and dual-criterion design is important. Graphs and non-statistical language help to explain the main features of a dual-criterion design. In addition, data scenarios with respective decisions may provide further clarification. Finally, operating characteristics (type-I error and power) are crucial to justify the design. Details will be discussed in the following sections.
Since decision making in phase II is complex, a final decision in inconclusive situations should account for other relevant information, such as key secondary endpoints, safety, PK/PD, biomarkers, and subgroups.
In summary, recommendations for selecting a design depend on the context, which informs the required design inputs. In the comparative phase II setting, two benchmarks (null value = no effect, decision value = minimum effect estimate) will often be available, which suggests a dual-criterion design. In other situations, a standard or precision design may be more appropriate. Irrespective of the chosen design, a clear understanding of the development context is crucial, and a consensus about design inputs and decisions related to possible trial outcomes is important.
3 Statistical considerations for dual-criterion designs
This section provides the key statistical components of dual-criterion designs. These refer to the formulation of the dual-criterion, the determination of the sample size, and the design’s operating characteristics.
3.1 Frequentist and Bayesian dual-criteria
The frequentist formulation of the null and decision value has been presented in the previous section. The alternative Bayesian version requires a sufficiently large probability for a positive treatment effect (effect exceeds the null value) and an effect estimate that reaches the decision value.
For the first Bayesian criterion, depending on the required strength of evidence for a positive effect, 90%, 95%, or 97.5% are common values for . These values are selected in analogy to their frequentist counterparts (p-value less than one-sided type-I error level) and will typically lead to type-I errors close to if prior information is weak. Importantly, despite the approximate equality of p-values and Bayesian threshold probabilities, their meaning is different (Casella and Berger 22, Berger and Selke 23, Wasserstein and Lazar 1). In addition, the decision value in a dual-criterion design and the alternative hypothesis in a standard design have entirely different interpretations. It is therefore critical to elicit the decision value properly from clinical considerations. Simply taking the alternative hypothesis from a standard design as the decision value in a dual-criterion design is unwarranted.
For example, for a standard time-to-event design with 80% power at a one-third hazard reduction (HR=0.667), the implied effect size threshold (minimum effect estimate for success) is 0.754. Using 0.667 as the decision value in a dual-criterion trial implies a completely different design. First, the standard design would not fulfill the clinically relevant criterion (estimate threshold 0.754 instead of 0.667). Second, because the dual-criterion is obviously more demanding, the resulting power of the study is less compared to the standard design. For instance, the power at 0.667 is 50% compared to 80% for the standard design.
3.2 Sample size
After the design inputs , null value (NV), and decision value (DV) have been set, the sample size can be derived. For normally distributed data, the minimum sample size is
Here, is the 100(1-)%-quantile of the standard normal distribution, and is the outcome standard deviation; for example, is 2 (under equal randomization) for the standard normal approximation to time-to-event data.
The above is the minimum sample size that implies statistical significance if the effect estimate equals the decision value. Importantly, the sample size of a dual-criterion design must be at least . It can of course be larger than if operating characteristics are considered unsatisfactory otherwise.
For non-normal data, a grid search over sample sizes may be needed to determine the minimum sample size. A search over increasing sample sizes is performed until the sample size is found so that for all sample sizes equal to or larger than , the dual-criterion is fulfilled. For an example, see the single-arm trial design in the next section.
3.3 Operating characteristics
Operating characteristics (type-I error, power) are an integral part of clinical trials designs and should be provided in the study protocol.
For dual-criterion designs, it is important to understand that the power at the decision value is (approximately) 50%: if the true parameter equals the decision value, there is a roughly equal chance that the effect estimate lies on either side of the decision value. Notingly, increasing the sample size will not change the power at the decision value: for parameters superior to the decision value the power increases, whereas for inferior values it decreases. This is warranted because superior values justify a GO, whereas inferior values do not. Thus, if the true value equals the decision value, a power higher (lower) than 50% would bias decisions towards GO (NO-GO), which is unwarranted. Therefore, having 50% power at the decision value value does not mean that the study is underpowered. Such a claim fails to understand the difference between the decision value of a dual-criterion design and the alternative parameter of a standard design.
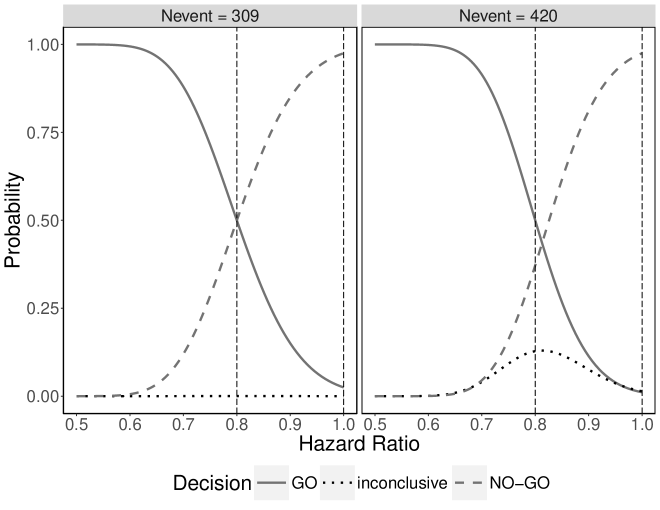
For the previous example, the minimum number of events () is 309. The left panel of Figure 1 shows the operating characteristics. If power for larger effects than the decision value is considered unsatisfactory, the sample size should be increased. However, for larger sample sizes, the effect estimate may not reach the decision value even if statistical significance holds, which is the inconclusive case 3 in Table 2. Moreover, larger sample sizes reduce the type-I error below the required . The right panel of Figure 1 shows the operating characteristics for 420 events: for effect sizes superior to the decision value (HR 0.8), the power increases compared to 309 events, whereas for inferior values it decreases.
In addition to the operating characteristics of a dual-criterion design, data scenarios (effect estimates) with corresponding decisions may help to clarify decisions obtained from a dual-criterion design.
3.4 Final analysis
The final analysis of a trial with a dual-criterion design does not differ from other designs. One needs to calculate the respective frequentist or Bayesian metrics:
-
•
the p-value (or one-sided confidence interval) and the parameter estimate (e.g. the unbiased or maximum-likelihood estimate)
-
•
the posterior probability that the parameter is better than the null-value and the posterior median (or mean). In addition, ploting the posterior density and cumulative distribution function may be useful.
For phase II trials, the ultimate GO or NO-GO decision is based on these dual-criterion metrics and other possibly relevant information.
4 Examples
We now discuss two recent implementations of dual-criterion designs in phase II. To illustrate the broad applicability of such designs, we consider a randomized controlled trial with a time-to-event endpoint and a single-arm trial with a binary endpoint. The implementation will be frequentist for the first and Bayesian for the second. We also investigate alternative designs (Rubinstein et al. 11, Sargent et al. 9), which shows similarities as well as differences in comparison to the dual-criterion design.
4.1 A randomized PoC design with time-to-event data
Example 1 was a randomized, double-blind PoC study of an experimental drug in combination with standard of care in patients with non-small-cell lung cancer. Patients were randomized equally to the experimental drug plus standard of care or to standard of care alone. The primary endpoint was progression-free survival (PFS), assessed with a log-rank test and Cox regression with treatment as a covariate.
In addition to the null value of no effect (HR=1), the specification of the decision value took into account standard of care data, the competitive landscape, and discussions with clinicians, marketing experts, and health authorities. A literature review revealed a median PFS of approximately five months. Based on discussions with experts, an estimated improvement of at least two months, which corresponds to an approximate HR of 0.7, was deemed necessary to be clinically meaningful. Values larger than 0.7 were judged unsatisfactory to clearly justify further development of the experimental drug. The dual-criterion for further development (GO) of the experimental drug was thus
-
1.
statistical significance: one-sided p-value of log-rank test 0.1
-
2.
clinical relevance: estimated HR from Cox regression 0.70
The sample size calculation used approximate normality of the log-hazard-ratio. From the sample size formula in previous section, the minimum number of events is 52. That is, with at least 52 events, if the estimated HR is 0.7, the one sided p-value is 0.1. To improve the power of the study for effect sizes better than 0.7 (decision value), the number of PFS events was increased to 70. To reach 70 events, approximately 200 patients (100 per arm) were expected to be enrolled.
Table 3 shows the operating characteristics of the design, that is, the probability for a GO, NO-GO, or inconclusive outcome.Design 1 was the actually used design. Since 70 exceeds the minimal number of events (52), an inconclusive decision (significant p-value with an estimate inferior to the estimate threshold 0.7) may occur. However, this probability is less than 0.1 for all hazard ratio scenarios. The type-I error is 0.032, considerably less than the required 0.1, and the power is reasonably large for convincing hazard ratios (0.92 for HR 0.5, 0.74 for HR 0.6).
The second design considers the case of 52 events, the minimum number such that statistical significance implies clinical relevance (hazard ratio estimate = 0.7). As can be seen, inconclusive decisions cannot arise. Compared to the first design, the type-I error is now the postulated 0.1, and the power is smaller (compared to design 1) for hazard ratios superior to the 0.7 threshold. The probability that the study fails is larger for hazard ratios inferior to 0.7.
For comparison, we now look at three more classical designs with different choices for type-I error and power at an alternative hazard ratio of 0.5, referred to as Randomized Screening Designs by Rubinstein et al. 11. Design 3 is the most demanding, with one-sided type-I error 0.1 and power 0.9. The number of events is 55, and statistical significance is achieved if the hazard ratio estimate is better than 0.708; in the actual trial such an estimate would have been insufficient for a GO decision. The sample size and estimate threshold are similar to design 2, so type-I error and power are similar too. Power is slightly higher due to the larger number of events and the weaker estimate threshold (0.708 compared to 0.7). However, design 1 differs in two aspects: if the sample size is larger than , inconclusive decisions may arise (statistical significance but clinical irrelevance); and, the type-I error will be smaller than .
Design 4 shows an example with the same type-I error (0.1) but decreased power (0.8). The implied required hazard ratio estimate is now 0.659, which is clearly more aggressive than the explicitly postulated 0.7 in the dual-criterion design.
Finally, design 5 uses type-I error 0.2 and power 0.9. This allows for more GO decisions: the required hazard ratio estimate is now only 0.761, in stark contrast to the clinically relevant value of 0.7. If an estimated 24% hazard reduction had been considered sufficient for a clear GO, a dual-criterion design with decision value 0.76 would have been an alternative to design 5.
| 1. dual-criterion design: =0.1, DV=0.7, n=70 | |||
| true HR | GO: | NO-GO: | inconclusive |
| 0.5 | 0.920 | 0.053 | 0.027 |
| 0.6 | 0.740 | 0.196 | 0.064 |
| 0.7 | 0.500 | 0.417 | 0.083 |
| 0.8 | 0.288 | 0.636 | 0.076 |
| 0.9 | 0.147 | 0.800 | 0.054 |
| 1.0 | 0.068 | 0.900 | 0.032 |
| 2. dual-criterion design: , DV=0.7, n=52 | |||
| GO: | NO-GO: | inconclusive | |
| 0.5 | 0.887 | 0.113 | — |
| 0.6 | 0.711 | 0.289 | — |
| 0.7 | 0.500 | 0.500 | — |
| 0.8 | 0.315 | 0.685 | — |
| 0.9 | 0.182 | 0.818 | — |
| 1.0 | 0.099 | 0.901 | — |
| 3. standard design: , n=55 | |||
| GO: | NO-GO: | inconclusive | |
| 0.5 | 0.901 | 0.099 | — |
| 0.6 | 0.729 | 0.270 | — |
| 0.7 | 0.516 | 0.484 | — |
| 0.8 | 0.325 | 0.675 | — |
| 0.9 | 0.186 | 0.813 | — |
| 1.0 | 0.100 | 0.900 | — |
| 4. standard design: , n=38 | |||
| GO: | NO-GO: | inconclusive | |
| 0.5 | 0.804 | 0.196 | — |
| 0.6 | 0.615 | 0.385 | — |
| 0.7 | 0.428 | 0.572 | — |
| 0.8 | 0.276 | 0.724 | — |
| 0.9 | 0.169 | 0.831 | — |
| 1.0 | 0.100 | 0.900 | — |
| 5. standard design: , n=38 | |||
| GO: | NO-GO: | inconclusive | |
| 0.5 | 0.902 | 0.098 | — |
| 0.6 | 0.768 | 0.232 | — |
| 0.7 | 0.602 | 0.398 | — |
| 0.8 | 0.439 | 0.561 | — |
| 0.9 | 0.303 | 0.697 | — |
| 1.0 | 0.200 | 0.800 | — |
4.2 A single-arm PoC design with binary data
Example 2 was a single-arm PoC trial of an experimental drug in Chinese patients with non-small-cell lung cancer. This type of study is common in early phase Oncology trials, for example in the expansion phase of a dose-escalation trial. The primary endpoint was objective response rate (ORR), which quantifies the preliminary efficacy of the experimental drug. The final analysis, which was Bayesian in this example, used a binomial sampling and a minimally informative unimodal Beta prior distribution with mean 0.075, that is, a Beta(0.0811,1) distribution.
While the null value is usually clear (no effect) in randomized trials, selecting it is more challenging in single-arm trials due to the absence of a comparator. Based on a literature review and clinical discussions, the null value for the ORR was set to 7.5%. Moreover, a minimum improvement of 10% was considered necessary to justify further development. The dual-criterion was thus defined as
-
1.
Bayesian statistical significance: pr( ORR 7.5% data) 0.95
-
2.
clinical relevance: posterior median 17.5%
For this dual-criterion, the minimally required sample size is 22; that is, for , clinical relevance (criterion 2) ensures statistical significance (criterion 1). The final sample size of the trial was set to 25. Figure 2 shows the posterior probability that the ORR exceeds 7.5% as a function of , assuming that the number of responders is the smallest such that the posterior median exceeds the decision value 17.5%.
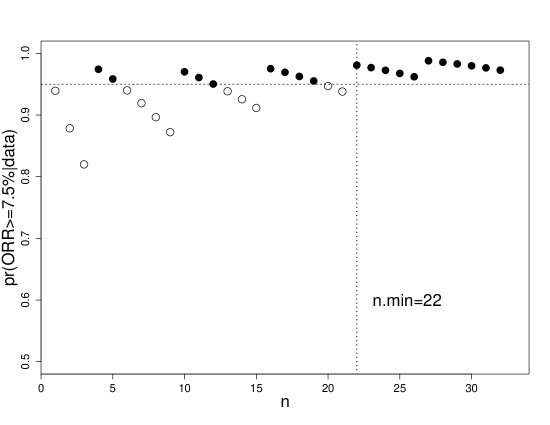
For n=25, the minimum number of responders required for a GO is five, with respective estimate 18.7% (posterior median) and posterior probability for a positive effect (ORR 7.5%) of 0.967. If the number of responders is less than five, both criteria are missed (NO-GO): for four responders, the posterior median is 14.8% and the probability of a positive effect is 0.895. Thus, in contrast to example 1, there will be no inconclusive outcome here.
Table 4 shows the designs’s probabilities of GO or NO-GO (design 1). The type-I error is 0.036, and the power was considered reasonably large.
For comparison, we consider a three-outcome design with : ORR 7.5%, : ORR 27.5%, = 0.05, = 0.1, = 0.8 and = 0.9, which requires 27 patients (for details see Sargent et al. 9). The decisions are as follows: NO-GO for zero to three responders, GO for five or more responders, and inconclusive for four responders.
For comparison to the three-outcome design, assume a larger size (n=36). Now, to meet the dual-criterion, seven responders are necessary: for this, the posterior median is 18.5%, and the probability of a positive effect is 0.985. An inconclusive outcome would occur for six responders: the posterior median is 15.8% (missing clinical relevance), yet the posterior probability of a positive effect is 0.954, reaching the 0.95 threshold. The operating characteristics for this design are also shown in Table 4 (design 2). The comparison to the three-outcome design is interesting. The type-I error and type-II error (for a response rate 0.275) are both small (0.016 and 0.044). In addition, the probability for NO-GO under the null hypothesis is 0.95, and the probability for GO is 0.902 for a response rate of 0.275. Both exceed 0.8, as suggested by Sargent et al. 9. This shows that this dual-criterion design is a three-outcome design with desirable properties.
Finally, design 3 in Table 4 shows possible differences between a dual-criterion and a three-outcome design. First, note that the operating characteristics reveal small error rates and reasonably large power, implying a three-outcome design with acceptable properties. Of special interest is the inconclusive outcome (four responders in 27 patients): the posterior median is 13.7% and the probability of a positive effect (ORR 7.5%) is 0.869. Thus, the dual-criterion fails for both (Bayesian) statistical significance and clinical relevance (NO-GO), whereas the three-outcome design results in an inconclusive outcome.
| 1. dual-criterion design: =0.05, DV=0.175, n=25 | |||
| true ORR (%) | GO: | NO-GO: | inconclusive |
| 7.5 | 0.036 | 0.964 | — |
| 12.5 | 0.195 | 0.805 | — |
| 17.5 | 0.451 | 0.549 | — |
| 22.5 | 0.693 | 0.307 | — |
| 27.5 | 0.858 | 0.142 | — |
| 2. dual-criterion design: =0.05, DV=0.175, n=36 | |||
| GO: | NO-GO: | inconclusive: | |
| 7.5 | 0.016 | 0.950 | 0.033 |
| 12.5 | 0.156 | 0.709 | 0.135 |
| 17.5 | 0.446 | 0.380 | 0.174 |
| 22.5 | 0.731 | 0.149 | 0.121 |
| 27.5 | 0.902 | 0.044 | 0.054 |
| 3. three-outcome design: n=27 | |||
| GO: | NO-GO: | inconclusive: | |
| 7.5 | 0.048 | 0.860 | 0.092 |
| 12.5 | 0.243 | 0.558 | 0.199 |
| 17.5 | 0.523 | 0.280 | 0.197 |
| 22.5 | 0.759 | 0.113 | 0.128 |
| 27.5 | 0.901 | 0.038 | 0.062 |
The computations for the two examples of this section were done with R 3.2 24. Code is available from the main author upon request.
5 Discussion
The development plan of each experimental drug is unique, for which phase II trials are an important screening or early examination step. A good phase II design should be based on clinical needs, already available information about the drug, and the competitive landscape. In addition, it must have acceptable error rates for well-defined success criteria. For comparative efficacy trials, standard designs aim for a statistically significant p-value under type-I error control and sufficiently large power. However, statistical significance only guarantees sufficient evidence that the drug has an effect. It does not guarantee clinical relevance.
We have discussed a dual success criterion that goes beyond a single null-metric, a p-value (Wasserstein and Lazar 1) or posterior threshold probability. The criterion complements statistical significance by a sufficiently large effect estimate. The latter is easily interpretable, ensuring clinical relevance if success is declared. Whether a frequentist or Bayesian design is chosen is rather unimportant in the absence of prior information. Otherwise, a Bayesian implementation is preferred.
There are similarities for dual-criterion and standard designs. Type-I error and power are important for both. For standard designs, they define the design, leading to an implicit success threshold for the effect estimate. To guarantee clinical relevance (a sufficiently large effect estimate), the effect threshold can be changed by changing and . Alternatively, and more directly, a dual-criterion can be used. This, however, has no explicit power requirements, and power should therefore be assessed. Irrespective of the chosen design, the three main metrics (type-I error, power, estimation threshold for success) must be understood to ensure a sensible balance of statistical and clinical requirements.
Beyond these similarities, differences between the two designs should be kept in mind. First, standard designs always result in success (statistical significance) or failure. Dual-criterion designs may lead to a statistically significant but clinically irrelevant result. As we have shown, such inconclusive outcomes are possible if the sample size is larger than the minimum sample size that implies statistical significance if the estimate reaches the clinical success threshold. Second, for standard designs, increasing the sample size increases the power for effects better than the null. For dual-criterion designs, power is only increased for values superior to the decision value since inferior values are clinically irrelevant.
The specification of a dual-criterion should be tailored to the development plan. While conceptually simple, its implementation requires care. We have experienced two related challenges. First, the elicitation of the decision value, the threshold for the effect estimate, is sometimes considered challenging. However, if carefully done, elicitation of the decision value is often easier for clinicians compared to an alternative hypothesis with respective power. Second, the fact that study power is 50% at the decision value has let some reviewers conclude that the study is underpowered. This concern can be alleviated in the protocol by precisely defining the dual-criterion, clarifying that the decision value differs from the alternative hypothesis in a standard design, and providing the power for effect parameters considerably better than the decision value.
We have only discussed the dual-criterion design for two simple phase II examples. A dual-criterion can of course be applied in other settings too because requirements of statistical significance and a reasonably large effect estimate are generally applicable. Examples include non-inferiority (Neuenschwander et al.18), bridging, and dose-finding studies, as well as multiple endpoints. In addition, dual-criterion designs may include interim analyses for futility for which we often use probability of success for interim decisions (Gsponer et al. 25).
Finally, our experience so far has been confined to nonconfirmatory trials. In the confirmatory setting, the size of effect estimates matters but is usually not part of the success criterion. However, a formal criterion may help to avoid negative surprises, in particular for large trials: rather than questioning the relevance of a significant phase III trial with an unconvincing effect estimate, formally introducing the minimum effect estimate in the success criterion may be a better option.
We would like to thank Santosh Sutradhar, Haige Shen, and Titing Yi for their contributions, as well as Michael Branson, Nathalie Fretault, Daniel Lorand, Doug Robinson, and Simon Wandel for valuable discussions and support. In addition, we also thank the two referees and the associate editor for their thoughtful comments, which greatly helped to improve the manuscript.
References
- 1 Wasserstein R and Lazar N. The ASA’s statement on p-values: Context, process, and purpose. The American Statistician 2016; 70(2): 129–133.
- 2 Fleming T. One-sample multiple testing procedure for phase II clinical trials. Biometrics 1982; 38(1): 143–151.
- 3 Herson J and Carter S. Calibrated phase II clinical trials in oncology. Statistics in Medicine 1986; 5(5): 441–447.
- 4 Simon R. Optimal two-stage designs for phase II clinical trials. Control Clin Trials 1989; 10(1): 1–10.
- 5 Schaid D, Wieand S and Therneau T. Optimal two-stage screening designs for survival comparisons. Biometrika 1990; 77(3): 507–513.
- 6 Storer B. A class of phase II designs with three possible outcomes. Biometrics 1992; 48(1): 55–60.
- 7 Liu P, Dahlberg S and Crowley J. Selection designs for pilot studies based on survival. Biometrics 1993; 49(2): 391–398.
- 8 Liu P, LeBlanc M and Desai M. False positive rates of randomized phase II designs. Control Clin Trials 1999; 20(4): 343–352.
- 9 Sargent D, Chan V and Goldberg R. A three-outcome design for phase II clinical trials. Controlled Clinical Trials 2001; 22(2): 117 – 125.
- 10 Korn E, Arbuck S, Pluda J et al. Clinical trial designs for cytostatic agents: Are new approaches needed? Journal of Clinical Oncology 2001; 19(1): 265–272.
- 11 Rubinstein L, Korn E, Freidlin B et al. Design issues of randomized phase ii trials and a proposal for phase II screening trials. Journal of Clinical Oncology 2005; 23(28): 7199–7206.
- 12 Simon R, Steinberg S, Hamilton M et al. Clinical trial designs for the early clinical development of therapeutic cancer vaccines. Journal of Clinical Oncology 2001; 19(6): 1848–1854.
- 13 Parashar D, Bowden J, Starr C et al. An optimal stratified Simon two-stage design. Pharmaceutical Statistics 2016; 15(4): 333–340.
- 14 Cartwright M, Cohen S, Fleishaker J et al. Proof of concept: a PhRMA position paper with recommendations for best practice. Clin Pharmacol Ther 2010; 87(3): 278–285.
- 15 Nicewander W and Price J. A consonance criterion for choosing sample size. The American Statistician 1997; 51: 311–317.
- 16 Chuang-Stein C, Kirby S, Hirsch I et al. The role of the minimum clinically important difference and its impact on designing a trial. Pharmaceutical Statistics 2011; 10(3): 250–256.
- 17 Chuang-Stein C, Kirby s, French J et al. A quantitative approach for making GO/NO-GO decisions in drug development. Drug Information Journal 2011; 45(2): 187–202.
- 18 Neuenschwander B, Rouyrre N, Hollaender N et al. A proof of concept phase II non-inferiority criterion. Statistics in Medicine 2011; 30(13): 1618–1627.
- 19 Fisch R, Jones I, Jones J et al. Bayesian design of proof-of-concept trials. Therapeutic Innovation & Regulatory Science 2015; 49(1): 155–162.
- 20 Frewer P, Mitchell P, Watkins C et al. Decision-making in early clinical drug development. Pharmaceutical Statistics 2016; 15(3): 255–263.
- 21 Senn S. Statistical issues in drug development. New York; Chichester: John Wiley & Sons, 1997.
- 22 Casella G and Berger R. Reconciling Bayesian and frequentist evidence in the one-sided testing problem (C/R: P123-135). Journal of the American Statistical Association 1987; 82: 106–111.
- 23 Berger J and Sellke T. Testing a point null hypothesis: The irreconcilability of values and evidence (C/R: P123-133, 135-139, 1201-1201). Journal of the American Statistical Association 1987; 82: 112–122.
- 24 R Core,, Team,,. R: A Language and Environment for Statistical Computing. R Foundation for Statistical Computing, Vienna, Austria, 2015. URL https://www.R-project.org/.
- 25 Gsponer T, Gerber F, Bornkamp B et al. A practical guide to bayesian group sequential designs. Pharmaceutical Statistics 2014; 13(1): 71–80.