Understanding and Partitioning Mobile Traffic using Internet Activity Records Data - A Spatiotemporal Approach
Abstract
The internet activity records (IARs) of a mobile cellular network posses significant information which can be exploited to identify the network’s efficacy and the mobile users’ behavior. In this work, we extract useful information from the IAR data and identify a healthy predictability of spatio-temporal pattern within the network traffic. The information extracted is helpful for network operators to plan effective network configuration and perform management and optimization of network’s resources. We report experimentation on spatiotemporal analysis of IAR data of the Telecom Italia. Based on this, we present mobile traffic partitioning scheme. Experimental results of the proposed model is helpful in modelling and partitioning of network traffic patterns.
Index Terms:
Internet activity record, data analytics, machine learning, mobile networks.I Introduction
The extensive development of internet of things (IoT) technologies and mobile phones suggests that next generation- networks are going in the direction where everything will be connected. An exponential increase has been seen in the use of mobile devices i.e., smart phones, tablets and smart watches. Ericsson, one of the leading telecomm company predicted the number of connected devices to be in billions in near future [1]. The connectivity of this great number of devices will create huge data traffic. The data volume has increased by 4000 fold during last decade and this may further rise in the next generation networks (NGN)[2, 3]. Moreover, the report by CISCO tells that every month 24 Exabyte data is generated by wireless traffic which is still growing continuously [4].
Useful information about the network and the behavior of subscribers can be retrieved from mobile network traces. However, network traces modeling and analysis is not trivial [5]. The information obtained by recent solutions about the modeling and analysis of these networks provide limited information and further research is needed to understand the key factors affecting the network variations. These limitations results in higher operating cost for the cellular network and dense populated areas face degradation in quality of service..
For the case of networks with ultra-density, the analysis of network traffic is very helpful for mobile operators and network subscribers [6, 7]. Cellular network patterns, if modeled and predicted properly, can be used to further sub divide the regions accordingly i.e., the division can be done according to the traffic conditions. This optimum division of resources prove to be beneficial for subscribers in terms of quality of service and beneficial for network operators in terms of efficiently using their network resources [8].
Network traces have been studied extensively in the last few years to understand and model the dynamics of network. Traffic density of network has been approximated by log normal distribution by Lee et al. [9]. Cellular traces are analyzed spatiotemporally by Wang et al. [10] and proposed that trimodal distribution is followed by cellular traces. Population density has been estimated by Deville et al. [11] by analyzing call data records spatiotemporally. Moreover, traffic prediction and anomalies are proposed to be detected by analyzing network traces by Kashif et al. [12]. Similarly, deep learning methods as reported in [13, 14, 15] can also be exploited for extraction of latent features, but are not covered in this brief review.
Above mentioned work provided motivation to monitor and classify real mobile network traces by using artificial neural network (ANN) clustering. Internet activities record are the network traces used in this work. Spatial and temporal information is contained within the IAR data. So, we analyze the spatial and temporal data separately. Since the nature of IAR data is spatiotemporal, useful information about the network and subscribers is extracted. This information leads us to meet QoS requirement of network, and can aid in improved throughput. In the following the main contributions of this article are mentioned:
-
IAR data is analyzed of large scale cellular network. The dataset used is of Milan city, which contains internet activity for Milan. This large data allowed us in understanding and modeling urban, suburban rural areas network traffic
-
In order to understand the spatiotemporal features of network traffic, a spatiotemporal approach is introduced. The correlation between spatial and temporal features has been investigated to understand traffic dynamics.
-
In order to monitor the traffic of sub regions, clustering is performed. Then, these clusters are used in ANN framework to classify the network traffic. .
The article has been structured as follows: Section II describes the proposed system model and dataset. Section III describes the obtained dataset spatiotemporal analysis and motivations. Section IV classification model proposed is mentioned. In the end, the conclusion is presented V.
II System Architecture and Dataset Description
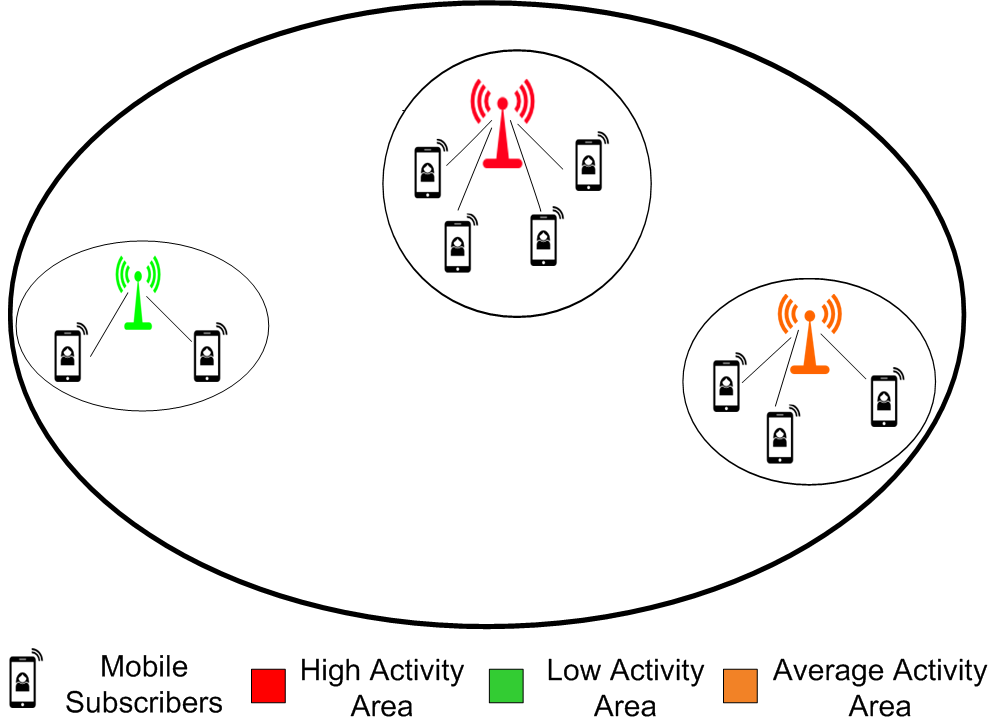
The proposed system model and observed data set is described in this section. The area of Milan city is divided in to three regions namely: low activity area, medium activity area and high activity area. This categorization is done on the basis of the internet activity level and spatiotemporal characteristics. The high activity area represents the city center which include tall buildings, hospitals, shopping malls and other busy areas of city. Medium activity area comprises of city center surroundings. Whereas, low activity area comprises of area far from city center. This categorization is depicted in Fig. 1.
First of all, the internet activity records (IAR) collected is stored and processed i.e., prepared for analysis. In the next step, the spatial and temporal dependencies are observed by analyzing the spatial and temporal feature of data. Further, the IARs categorization is done in to different groups, using clustering analysis. After this step, future network traffic classification based on these clusters are done using artificial neural network (ANN).
II-A Description of Dataset
The dataset used in this article is of Milan city made public by Telecom Italia [16]. This dataset duration is 2 months i.e., between 1st Nov, 2013 and 1st Jan, 2014. The temporal division of the data is done in days, which is further divided in 10 minutes interval. Whereas, the spatial division is done into grids, where the entire Milan city is spatially divided in to 100100 grids space with each grid having area of 0.05 square kilometers each.
Dataset basically comprises voice calls, sms activity and internet activity. But, we only used internet activity, as these days because of rapid advancement of mobile phone technologies, internet call and messages are used more as compared to voice calls and the SMS services offered by the mobile operator. The samples of the dataset are shown in the Table I below with cell ID, time stamp and internet activity.
| Cell ID | Timestamp | Internet activity |
|---|---|---|
| 1 | 10 | 57.78 |
| 10 | 20 | 44.21 |
II-B Data Preprocessing
The dataset in raw form contains irregularities which include unrecognized numbers, misleading patterns and missing values. So, there is a need of preprocessing before analysis phase. This data preprocessing helps to improve the output quality and reduction of processing overhead. The dataset has to be aggregated in the time intervals of 10 minutes, but there are some missing timestamps. In order to overcome this issue, the activity on these missing time intervals is approximated as the average of activity in the previous and the next time interval. This estimation is represented by Eq 1. below.
| (1) |
Where is the value at missing timestamp, is value of previous timestamp and is the value of the next timestamp.
III Spatial and Temporal Explorations of IARs
The preprocessed data is analyzed for spatial and temporal features separately and is mentioned in the following section.
III-A Spatial Analysis
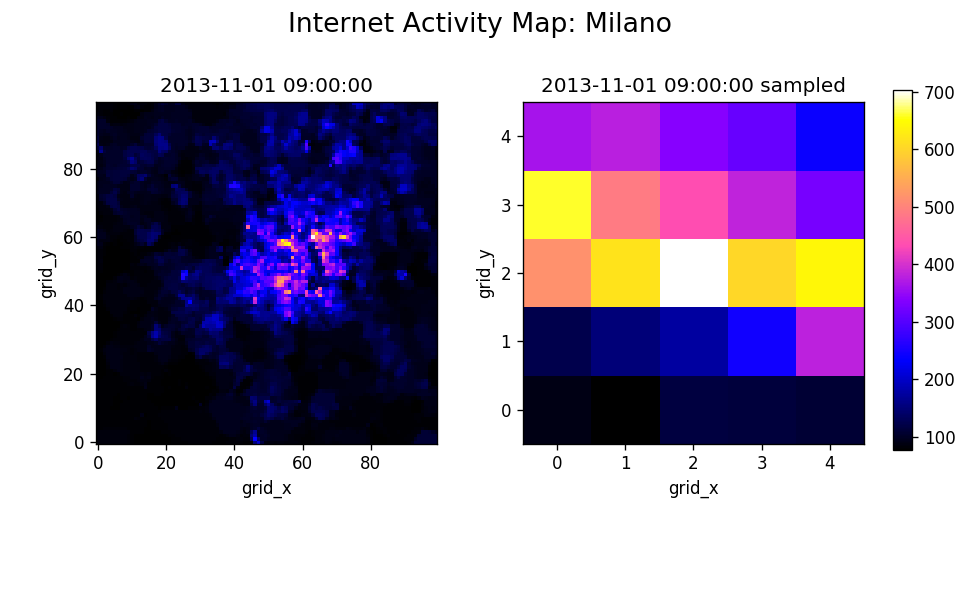
While analyzing spatial feature, the temporal variations are fixed i.e., at one fixed time IARs of entire Milan city are observed. For this regard, first for one specific day, IAR data is used. After this step, the data on the three hour interval basis is aggregated. As a result, the data is further divided into 8 different time slots, over an entire period of 24 hours.
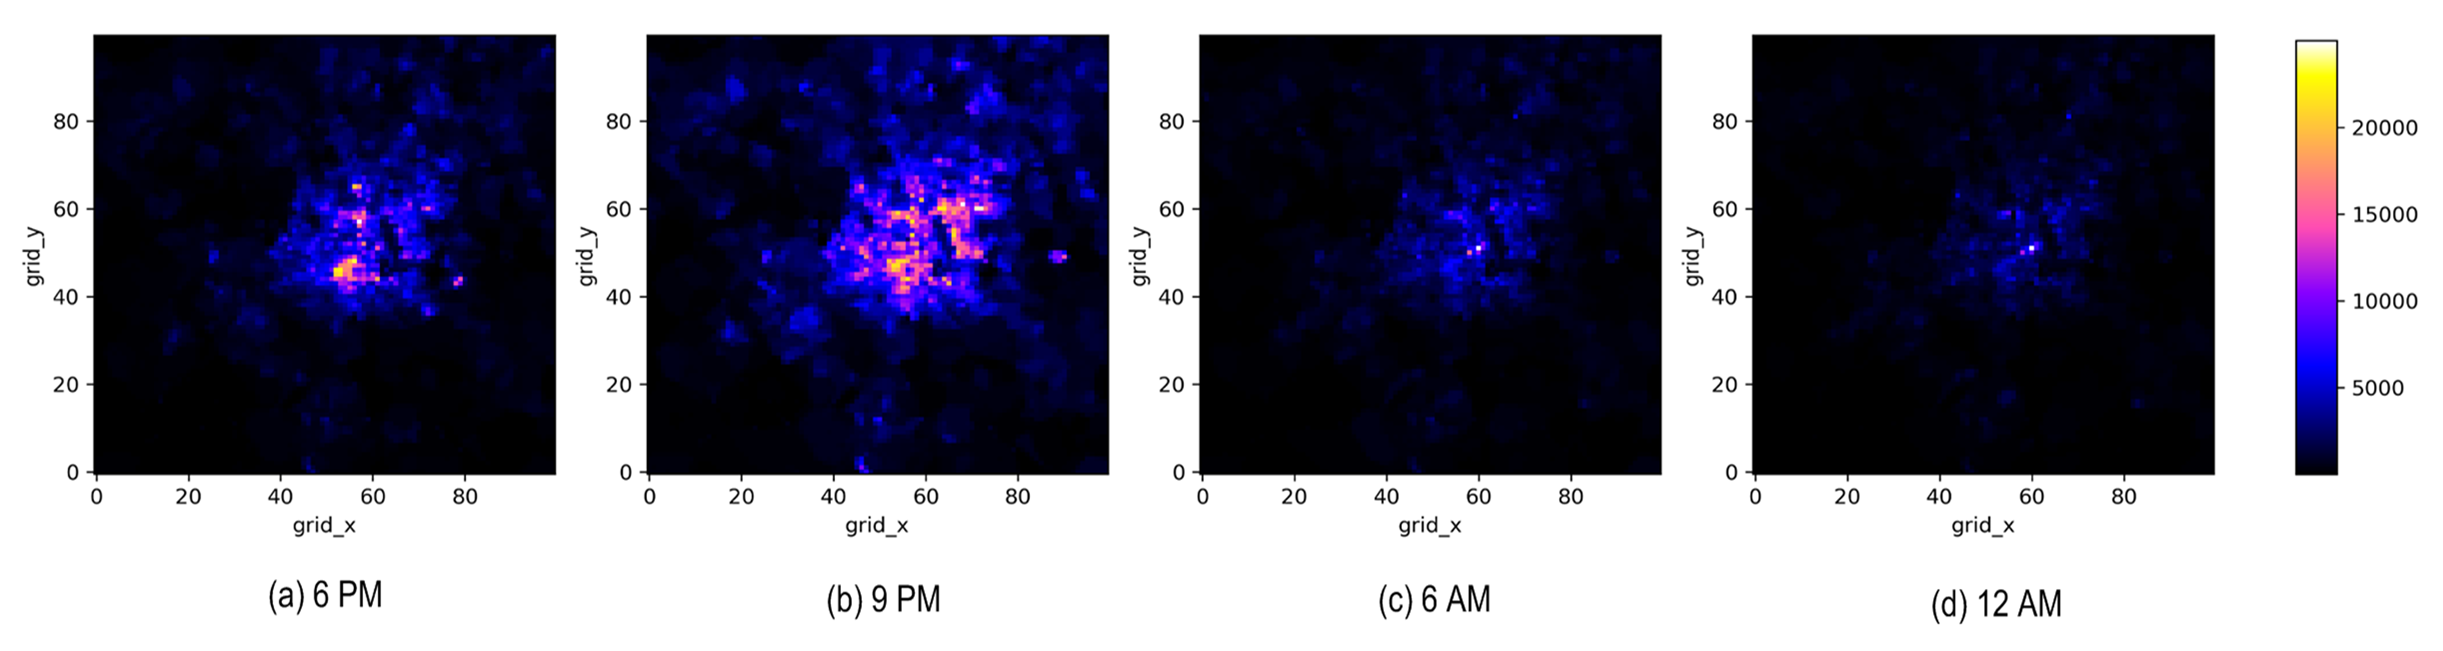
So, the activity of one whole day is observed in this way. The internet activity variation for the entire Milan city at the interval ( 6 am to 9 am) is shown in Figure 2.In order to visualize it the 100100 grids of Milan city are downsampled to 55. The internet activity variations can be easily observed from this 55 grid Figure 2. It is evident from the figure that at the center of the city internet activity is higher and it reduces when we move away from city centers. In the same way, the internet activity variation for the whole day in shown in Figure 3. From the Figure 3, the same phenomenon of internet activity variation can be observed. The internet activity spatial variation has been restricted to only four time slots because of the pages limit.
III-A1 Spatial Correlation
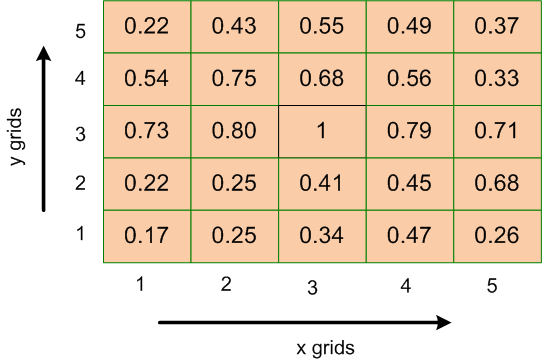
It can be noticed that distribution of the internet activity is not uniform over entire Milan city, as different sub-regions differ in dynamics such as being a residential area or commercial area, etc. The spatial correlation variation is measured by using a widely adapted parameter, the Pearson correlation [17]. The Pearson correlation coefficient has been used to calculate the spatial correlation variation between the targeted grids i.e., city center grids and surrounding grids. This coefficient is expressed by the following relationship:
| (2) |
where is the standard deviation, cov represents the covariance, is the target grid and represents the grid in the vicinity of the target grid. Spatial correlation variation for the whole Milan city is shown in Figure 4. With the down sampling of 100100 grids to a scale of 55, one cell in 55 grid represents 400 grids.
III-B Temporal Analysis
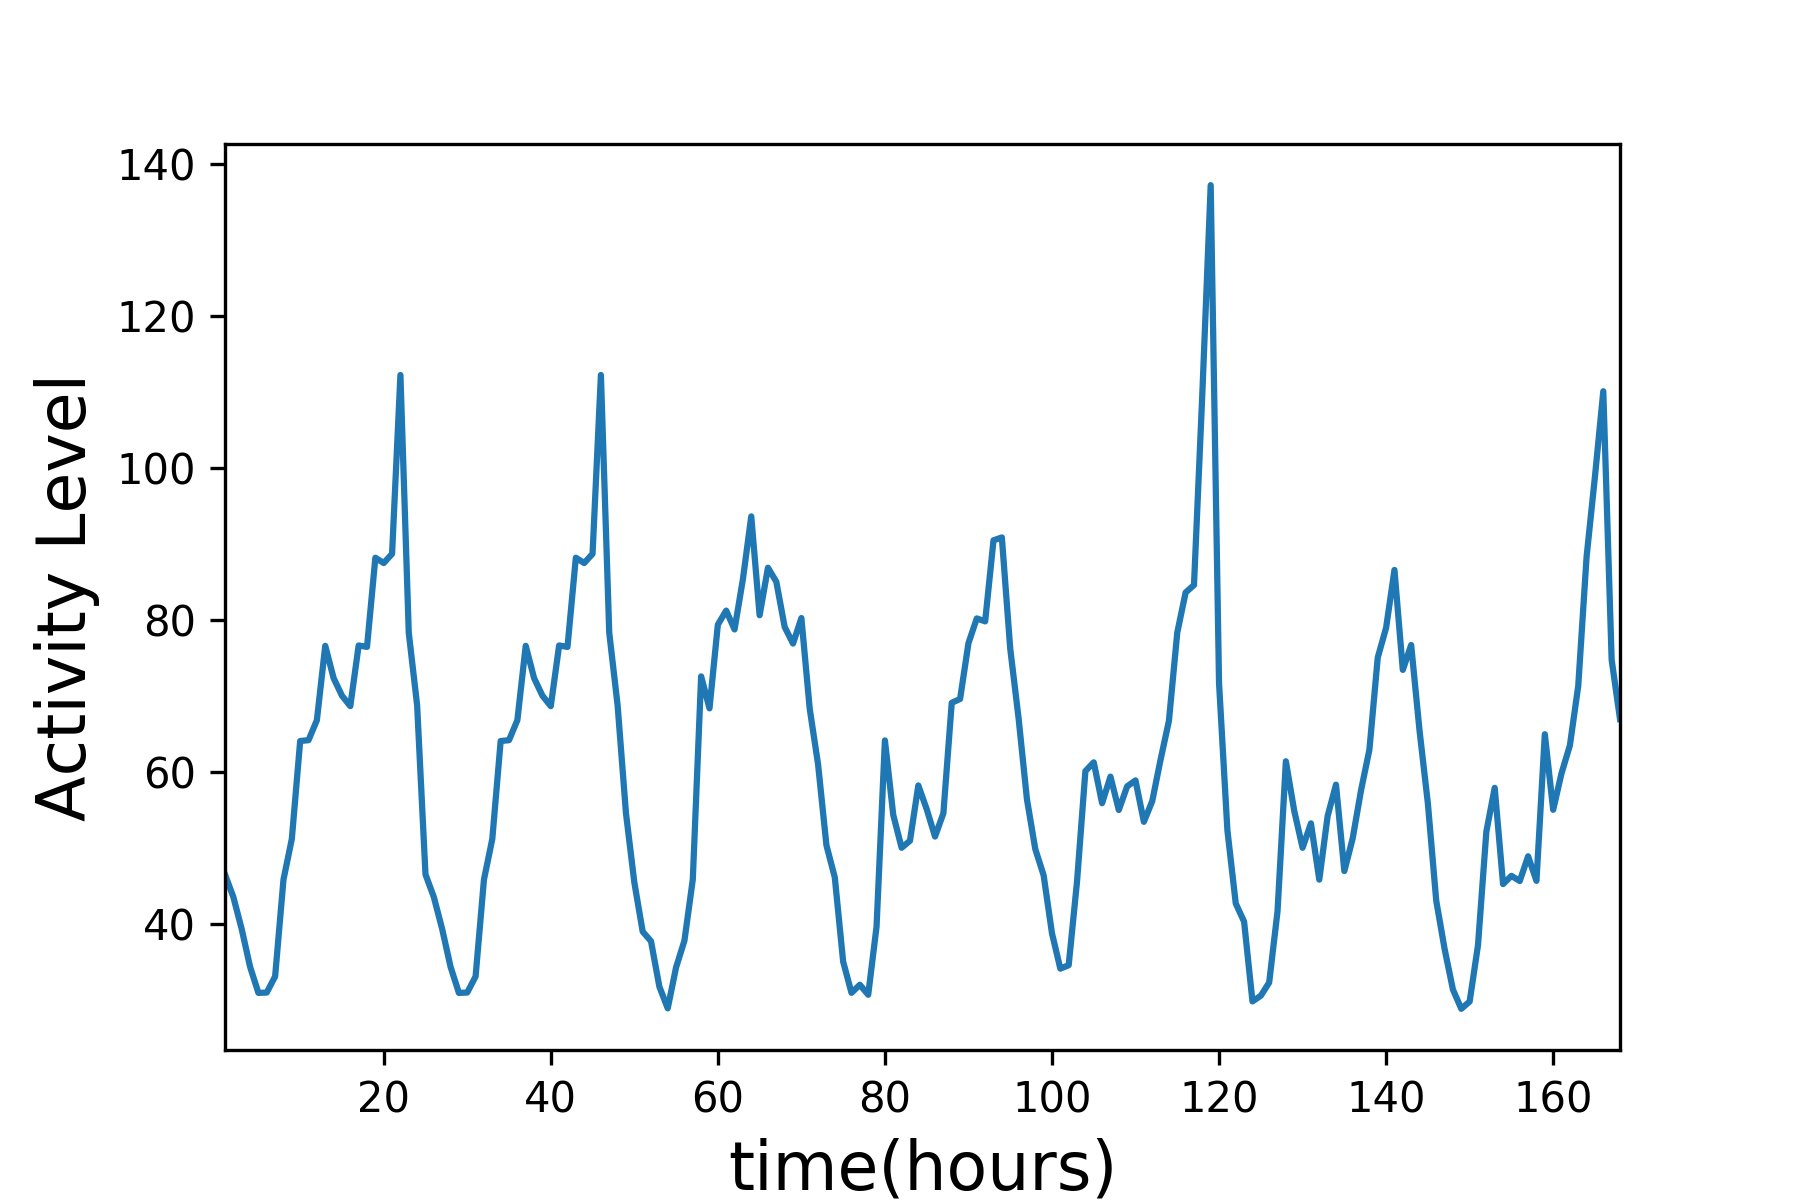
For this case, spatial variation is fixed and the varations in the internet activity are observed over a period of one day, one week and one month. By fixing spatial variation, we mean observing IAR for a particular grid. From Fig. 5 it can be seen that from midnight to morning the internet activity increases, then from noon to afternoon it decreases, and from evening to midnight it rises again. This pattern continues when observing for the case of a day, a week and a month. Fig. 5 shows the IAR time series curve.
III-B1 Temporal Corelation
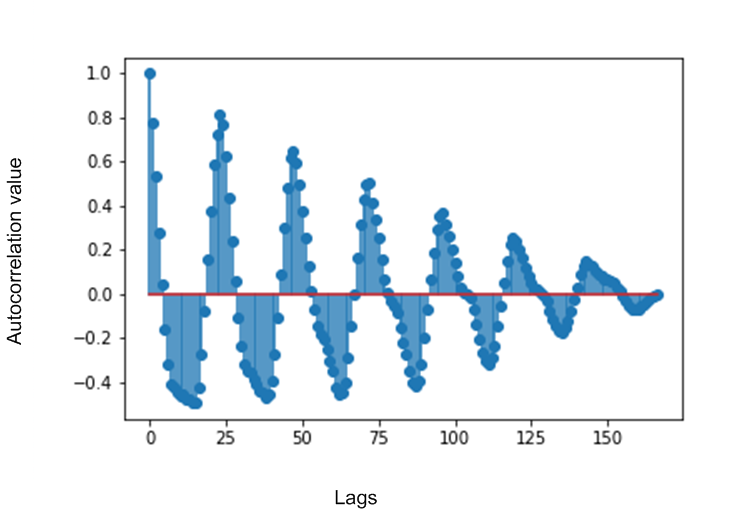
In order to check the temporal relations within IARs, the temporal correlation is measured. The temporal variation in the time series data is measured using Autocorrelation function (ACF) [18]. ACF measures the correlation between the current and the previous time series (also referred as lags). This type of correlation is also known as serial correlation. It is shown mathematically by the following equation 3.
| (3) |
where T represents time steps in time series, represents the average time series data value. The autocorrelation for 168 lags is shown in Fig. 6. The temporal dependencies of IARs are represented by these lags for the period of one week with one hour step size. It can observed from Fig. 6 that hourly pattern exists in IARs as the plot of autocorrelation function shows a peak after 24 lags.
IV Clustering Based ANN Model
The preprocessed data, after analyzed spatiotemporally is classified with respect to spatial distribution and activity level.
IV-A Clustering Analysis
IV-A1 k-means Clustering:
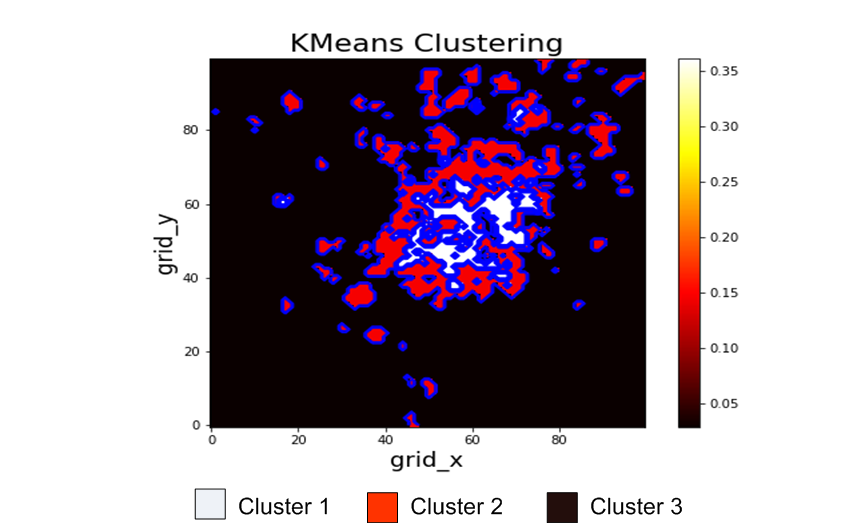
Network activity level and spatiotemporal features are grouped by using clustering algorithm of machine learning’s. Clustering algorithm is used to see the variations in internet activity of entire Milan city. k-means clustering (the most popular with very low complexity) scheme is used on our dataset. The steps of k-means clustering algorithm summarized in Algorithm 1.
By the clustering analysis we obtained three types of clusters which are very low activity, medium activity and high activity clusters. The clustering approach is shown in Figure 8, with different colors representing different clusters. It can be observed from the figure that the clusters which are formed in mid of the city shows very high activities of internet. So, this is named as very high activity cluster. In the same way, the clusters which are formed near the mid of the city also shows high internet activity but lower than the mid clusters. Moreover, the clusters formed away from mid show very low internet activity. Hence, according to these internet activity clusters whole Milan city has been divided in to different groups or sub-regions. Bayesian information criterion (BIC) and Akaike information criterion (AIC) are adapted for determining the number of components/clusters k.
IV-B IARs Partitioning
For predicting the class of IARs, clustering driven artificial neural network model is applied. With the proposed approach, the IARs classification is converted from unsupervised to supervised multi-class classification problem. The output of the artificial neural network (ANN) model is determined with the aid of categorical distribution of IARs which is obtained from clustering analysis. ANN model classifies internet activities according to activity level and spatial characteristic.
IV-B1 Model Evaluation
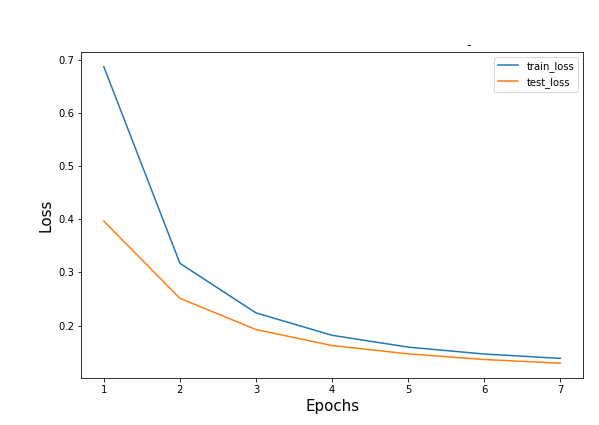
For observing the performance of the proposed model, loss is used as performance metrics. As in our case, the model is performing an IARs partitioning task, so categorical cross entropy is used as a loss function. For performance visualization of the model, the training and testing losses are plotted with respect to epochs. As is observed from the simulation results shown in Fig. 8 that training losses and testing losses are decreasing as the number of epochs is increasing. It is observed from Fig. 8 that the training loss is decreasing rapidly in the first five epochs and after that reach to a stable state. The testing loss also follows the same pattern. This phenomenon proves that the model is fast converging and time efficient. The simulation results show that the model average loss is 18 and average accuracy is 96.
Hence, the proposed internet traffic classification model can be used for real-world applications such as efficient bandwidth allocation or multi-tier radio access network architecture. For example, the proposed IARs classification model can be used to identify the region of interest and region of non-interest. Thus, additional small cells and spectrum can then be allocated to the high activity region. In this way, QoS would be improved and energy consumption would be reduced. As in next-generation networks, there will be billions of connected wireless devices and a higher number of densely connected of small cells, so such type of model is heavily needed for efficient deployment of ultra-dense networks and improvement in QoS.
V Conclusion
In this work, we have presented the potential benefits of IAR data analysis in a mobile cellular network. The proposed work has provided a spatiotemporal analysis applied on mobile traffic data to extract useful pattern and help in understanding as well as monitoring the internet activity data. Results obtained for the proposed approach show that the approach is beneficial towards optimization of resource allocation task in mobile networks. Further, it provides insights into both temporal and spatial characteristics of the network IAR data. Thus, it has potential to contribute to improved performance of the network and better QoS.
VI Acknowledgment
This work was supported in part by the Key Project of the National Natural Science Foundation of China under Grant 61431001, in part by the Beijing Natural Science Foundation under Grant L172026, in part by the Key Laboratory of Cognitive Radio and Information Processing, Ministry of Education, Guilin University of Electronic Technology. The corresponding author is Dr. Zhongshan Zhang
References
- [1] L. Ericsson, “More than 50 billion connected devices,” White Paper, 2011.
- [2] K. Sultan, H. Ali, and Z. Zhang, “Big data perspective and challenges in next generation networks,” Future Internet, vol. 10, no. 7, p. 56, 2018.
- [3] K. Sultan and H. Ali, “Where big data meets 5g?” in Proceedings of the Second International Conference on Internet of things and Cloud Computing. ACM, 2017, p. 103.
- [4] Cisco, “Cisco Visual Networking Index: Global Mobile Data Traffic Forecast Update , 2015-2020,” 2011, White Paper. [Online]. Available: http://www.cisco.com/c/en/us/solutions/collateral/service-provider/visual-networking-index-vni/mobile-white-paper-c11-520862.pdf.
- [5] A. K. Das, P. H. Pathak, C. Chuah, and P. Mohapatra, “Contextual localization through network traffic analysis,” in IEEE INFOCOM 2014 IEEE Conference on Computer Communications, 2014, pp. 925–933.
- [6] Y. Dong, Y. Yang, J. Tang, Y. Yang, and N. V. Chawla, “Inferring user demographics and social strategies in mobile social networks,” in Proceedings of the 20th ACM SIGKDD international conference on Knowledge discovery and data mining. ACM, 2014, pp. 15–24.
- [7] M. Z. Shafiq, L. Ji, A. X. Liu, J. Pang, and J. Wang, “Characterizing geospatial dynamics of application usage in a 3g cellular data network,” in INFOCOM, 2012 Proceedings IEEE. IEEE, 2012, pp. 1341–1349.
- [8] Y. Bao, H. Wu, and X. Liu, “From prediction to action: Improving user experience with data-driven resource allocation,” IEEE Journal on Selected Areas in Communications, vol. 35, no. 5, pp. 1062–1075, 2017.
- [9] D. Lee, S. Zhou, X. Zhong, Z. Niu, X. Zhou, and H. Zhang, “Spatial modeling of the traffic density in cellular networks,” IEEE Wireless Communications, vol. 21, no. 1, pp. 80–88, 2014.
- [10] H. Wang, J. Ding, Y. Li, P. Hui, J. Yuan, and D. Jin, “Characterizing the spatio-temporal inhomogeneity of mobile traffic in large-scale cellular data networks,” in Proceedings of the 7th International Workshop on Hot Topics in Planet-scale mObile computing and online Social neTworking. ACM, 2015, pp. 19–24.
- [11] P. Deville, C. Linard, S. Martin, M. Gilbert, F. R. Stevens, A. E. Gaughan, V. D. Blondel, and A. J. Tatem, “Dynamic population mapping using mobile phone data,” Proceedings of the National Academy of Sciences, vol. 111, no. 45, pp. 15 888–15 893, 2014.
- [12] K. Sultan, H. Ali, and Z. Zhang, “Call detail records driven anomaly detection and traffic prediction in mobile cellular networks,” IEEE Access, vol. 6, pp. 41 728–41 737, 2018.
- [13] T. Iqbal and H. Ali, “Generative adversarial network for medical images (mi-gan),” Journal of medical systems, vol. 42, no. 11, p. 231, 2018.
- [14] M. F. Bulbul, S. Islam, and H. Ali, “3d human action analysis and recognition through glac descriptor on 2d motion and static posture images,” Multimedia Tools and Applications, pp. 1–27, 2019.
- [15] H. Ali, S. N. Tran, E. Benetos, and A. S. d. Garcez, “Speaker recognition with hybrid features from a deep belief network,” Neural Computing and Applications, vol. 29, no. 6, pp. 13–19, 2018.
- [16] [Online]. Available: https://dandelion.eu
- [17] C. Zhang, H. Zhang, D. Yuan, and M. Zhang, “Citywide cellular traffic prediction based on densely connected convolutional neural networks,” IEEE Communications Letters, 2018.
- [18] J. Brownlee, Introduction to time series and forecasting with Python. Machine learning mastery, 2017.