A Three-dimensional Reconstruction of Cosmic Ray Events in IceCube
Abstract:
The IceCube Neutrino Observatory at the geographic South Pole consists of two components, a km2 surface array IceTop and a km3 in-ice array between 1.5 and 2.5 km below the surface. Cosmic ray events with primary energy above a few tens of TeV may trigger both the IceTop and in-ice array and leave a three-dimensional footprint of the electromagnetic and muonic components in the extensive air shower. A new reconstruction based on the minimization of a unified likelihood function involving quantities measured by both IceTop and in-ice detectors was developed. This report describes the new reconstruction algorithm and summarizes its performance tested with Monte Carlo events under two different containment conditions. The advantages of the new reconstruction are discussed in comparison with reconstructions that use IceTop or in-ice data separately. Some possible improvements are also summarized.
Corresponding authors:
Xinhua Bai1, 1, Javier Gonzalez2, Dennis Soldin2
1 Physics Department, South Dakota School of Mines & Technology, Rapid City, SD 57701
2 Department of Physics & Astronomy, University of Delaware, Newark, DE 19716
1 Introduction
The IceCube Neutrino Observatory [1] at the geographic South Pole plays a crucial role in multi-messenger astronomy by observing high energy neutrinos from astrophysical or cosmological origins. With its one km2 surface array IceTop and a km3 in-ice array between 1.5 and 2.5 km deep in the glacial ice, IceCube is also a powerful detector for the study of cosmic rays (CRs), atmospheric muons, atmospheric neutrinos, etc. A series of science results on these topics have been obtained from IceCube data [2, 3].
A prominent feature in astrophysical or cosmological phenomena is that the event rate often decreases dramatically as the energy increases. A typical example is the CR spectrum. Besides a couple of structures, the inverse power law index of the differential flux of CRs is between 2.7 and 3.0 over more than 10 orders of magnitude of energy. The study of high energy phenomena requires large detectors to increase the number of events. Also beneficial is to develop novel techniques that make maximal use of available data. A new three-dimensional (3-D) reconstruction is developed for the studies of CRs in IceCube. It not only largely increases the number of events for physics study at high energies but also provides new parameters that may improve the resolution of the measurement of CR primary energy and composition. The major software components and some updated formulas of the reconstruction are summarized in Section 2. Section 3 describes the performance test of the new reconstruction, followed by an outlook for further improvements.
2 Major software components and key formulas
The 3-D reconstruction takes the size and time of signals observed by both IceTop and the in-ice array and feeds them into a likelihood (LH) maximization process to reconstruct the extensive air shower (EAS) profile and energy losses of high energy muons in the in-ice array. The data/information flow and the key software components are shown in Figure 1. Major service modules and operations are:

Likelihood Services: Provide LH descriptions for an EAS signal hypothesis in IceTop [4], as well as for the muon signals observed in the in-ice array [5].
Signal Models: Define EAS profile by describing the lateral distribution function (LDF) , the shower curvature , etc. for particle signals in the IceTop tanks. These models provide the hit probabilities in order to construct corresponding likelihood functions (LHF).
Likelihood Combiner: Combines the likelihoods which are used for the minimization procedure. It has no constraint on the number of likelihoods so that additional observables or new detector components can be easily implemented into the new reconstruction.
Seed/Parameter Service: Initializes the parameters, defines the boundaries and initial step sizes for the minimization.
Minimizer/Fitter: Combines all information from the services and conducts the minimization for the combined LH using common minimization algorithms, such as Minuit or Simplex [6].
InIce Energy Estimators: Reconstructs muon or muon bundle energy losses at different depths by using the reconstructed muon track information from the ”Minimizer/Fitter” with the existing IceCube reconstruction ”Millipede” [7, 8].
The new framework not only has the freedom to include multiple terms in the combined LHF but also allows changing the functions in the LHFs for the maximum flexibility. In this work the combined LHF has three terms, i.e. the charge term () and time term () for EAS signals in the IceTop tanks, and an InIce term (ex. , etc.) for the muon bundle footprint measured by the in-ice array. The new reconstruction utilizes the following LDF , shower front curvature function , and time fluctuation :
| (1) | ||||
| (2) | ||||
| (3) |
The definition of parameters and coefficients in Eq. (1) and (2) are the same with these used in the standard IceTop-alone reconstruction [4] except that the curvature parameter in Eq. (2) is a free parameter in the 3-D reconstruction instead of a fixed value. This is to take into account the fact that the shape of shower front curvature depends on primary energy and zenith angle. The new per-event based time fluctuation in Eq. (3) is introduced so that it can be consistent with using a flexible curvature that varies for each individual EAS in the likelihood maximization. and (with or ) are the signal time (in ) and size (in , vertical equivalent muon) at two IceTop tanks of the IceTop station. The values of and derived from a MC study are 4.0 and 1.22 . The InIce LHF is based on the probabilities of photon arrival times at DOMs, the signal sizes and the topology of triggered DOMs. The new 3-D reconstruction allows using the probability density function of single-photo-electron (), or multi-photo-electrons (), or of other types. See details of the InIce LHF options in [5, 8].
3 Performance
The 3-D reconstruction was tested using the IceCube MC events of the 2012 detector configuration. The simulated dataset is divided in two groups of events by using their MC true geometry: events with core contained in IceTop and high energy muons contained in the in-ice array (to be referred to as IT-Contained), and events with core landing on the edge or outside of the IceTop array and high energy muon track contained in the in-ice array (IT-Uncontained). Although the main motivation of developing the 3-D reconstruction is to make use of IT-Uncontained events for physics analysis, testing it with IT-Contained events gives us the most convenience in the development since we have much better understanding of them through analyses previously done.
The MC events use EAS generated by CORSIKA [9] (with Sibyll2.1 [10] as high energy interaction model), which include both proton and iron primaries in a zenith range between 0° and 65° with an energy spectrum from to GeV. In the production of MC events, these CORSIKA showers were evenly distributed in four circular areas with four different radii from the center of the IceTop array, i.e. 1100 m, 1700 m, 2600 m and 2900 m for CRs in four primary energy bins GeV, GeV, GeV, and GeV.
We also adopted quality cuts (QC) used in IceTop and InIce coincidence analysis [11] to select quality IT-Contained events. The standard InIce QC and five triggered IceTop stations with a station density are used to select quality IT-Uncontained events for the 3-D reconstruction. Events are weighted to a spectrum for all plots unless noted otherwise. Error bars on all plots represent standard deviation.
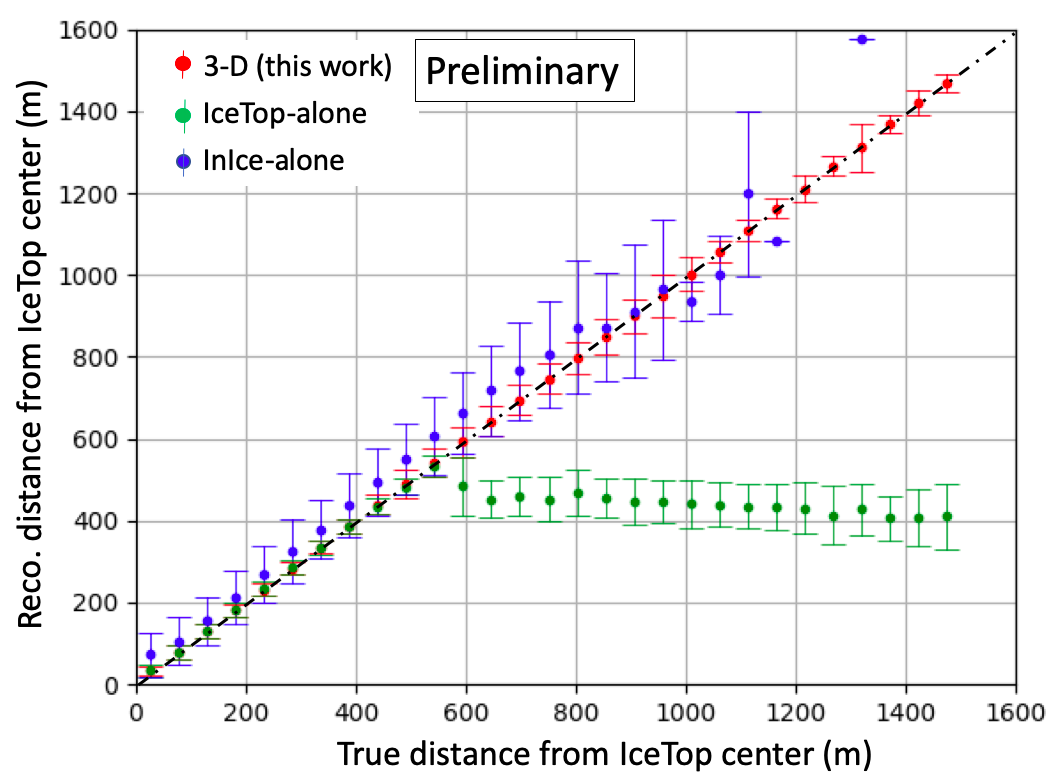
To compare how the MC events can be effectively reconstructed by the IceTop-alone, InIce-alone, and the new 3-D reconstruction, the reconstructed EAS core distance from the IceTop array center after the QC is compared with the true core distance in Figure 2. Except several data points with large statistical errors at very high energies due to the small number of events, the InIce-only reconstruction has a systematic shift away from the IceTop array center. The IceTop-alone reconstruction shifts the reconstructed cores to the inside of the array when the real core position is on the edge or outside of IceTop. Figure 2 also shows that the current IceTop QC cannot remove all the events that have mis-reconstructed core position. Only the 3-D reconstruction, since it is informed by in-ice information as well, does not have this limitation, and is able to correctly find the core of showers that land both inside and outside of IceTop. This is an extraordinary improvement that will help reduce systematic uncertainties associated with geometric effects. In four primary energy bins GeV, GeV, GeV, and GeV, the successful reconstruction rates for IT-Uncontained events by IceTop, InIce, and the 3-D reconstructions after QC are (2.4%, 0.8%, 0.8%, 1.1%)IT, (63.5%, 38.1%, 22.5%, 13.7%)II, (62.6%, 58.1%, 43.5%, 25.3%)3-D. By successfully reconstructing a decent portion of IT-Uncontained events, the 3-D reconstruction helps reduce statistical uncertainties which is a dominant contributor to the uncertainties at high energies.
The 3-D reconstruction also takes advantage of the long lever arm between the IceTop and the in-ice array, which helps reconstruct the CR direction more accurately than either reconstruction can do alone. This is particularly true for the IT-Uncontained events. Plots in Figure 3 show the reconstructed pointing resolution as a function of the CR primary energy for events in both groups.
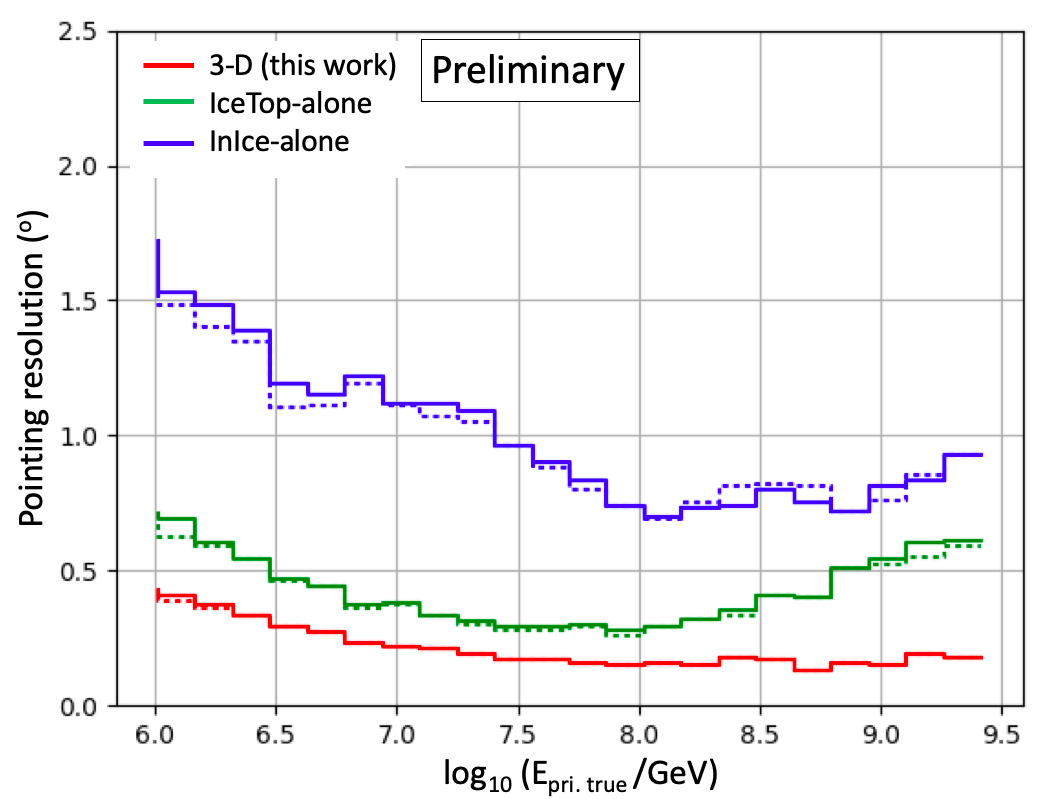
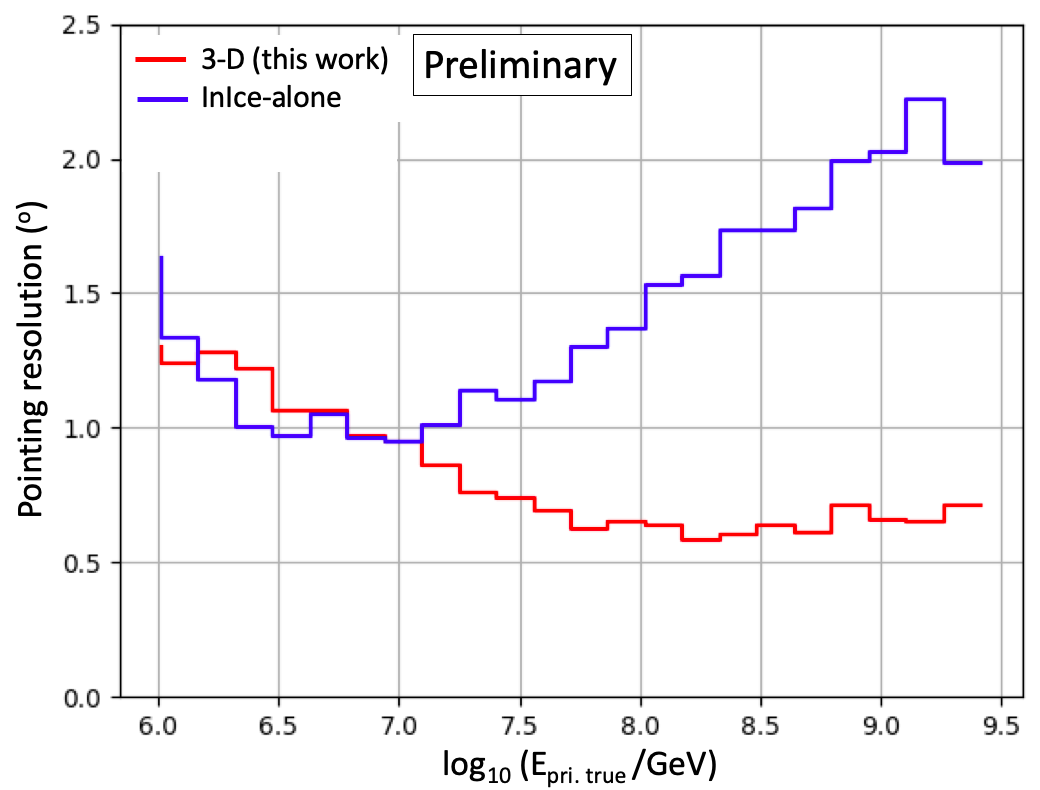
The value of the resolution is defined as the space angle from the true direction which contains 68% of the reconstructed tracks. As shown by the red lines in the plot on the left, the 3-D reconstruction does the best for IT-Contained events over the entire energy range. The comparison using identical QC for IT-Contained events (the dotted lines in the plot of the left) also gives the same result with a slightly improved resolution for all three reconstructions. For IT-Uncontained events (i.e. plot on the right), the 3-D reconstruction result (red line) is much better than the InIce-alone reconstruction except below GeV. This exception is mainly because these low energy IT-Uncontained events trigger much fewer IceTop stations.
Figure 4 shows the resolution of EAS core location reconstructed separately by these three methods for IT-Contained events. The core resolution is defined as the distance from the true core which contains 68% of the reconstructed tracks.
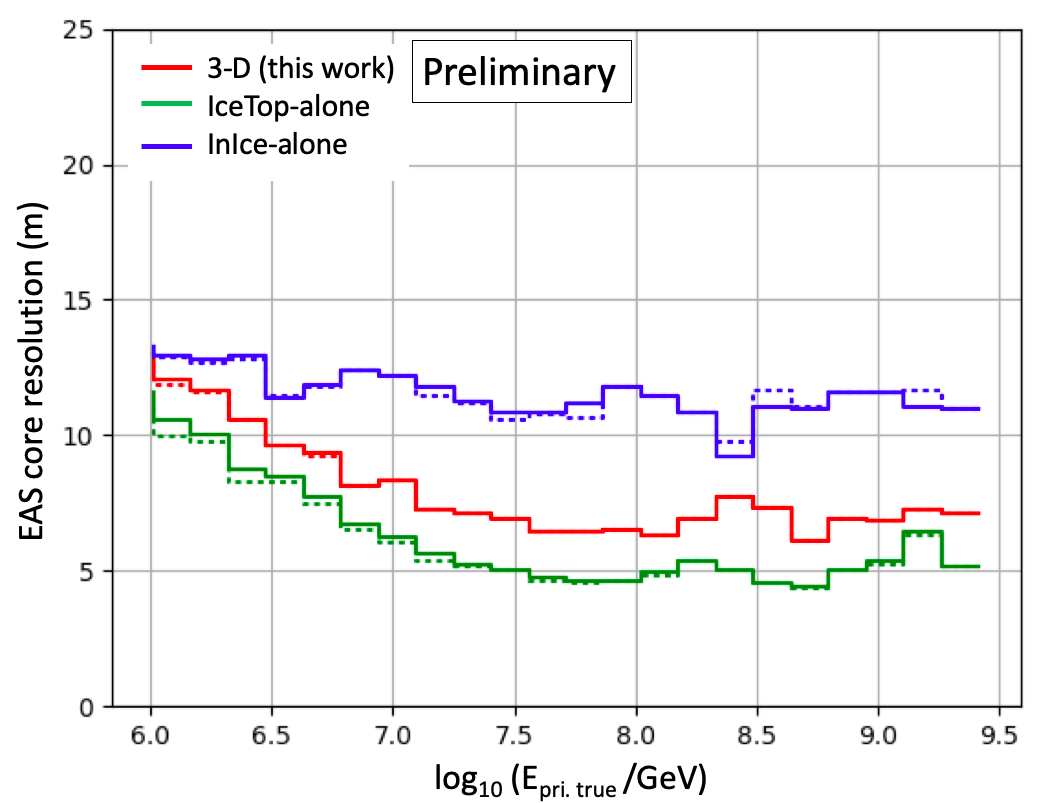
The core resolution of the 3-D reconstruction is worse than the IceTop-alone reconstruction by about 23 meters over the entire energy range being studied, while the InIce-alone reconstruction is worse than the IceTop-alone reconstruction by about 38 meters. As indicated by the dotted lines in the figure, these differences remain the same in the comparison with identical QC for all three reconstructions. The deterioration in the 3-D reconstruction core resolution is not a complete surprise because the core is determined exclusively by the signal sizes in the IceTop detectors. Nevertheless, how the deterioration happens while a better angular resolution is achieved by the 3-D reconstruction and if there is a way to overcome it still needs more study. Since EAS ground particle LDF is very sensitive to the core location (see Eq. 1), the worse core resolution of the 3-D reconstruction also leads to a wider spread in the -primary energy relation shown below.
Energy deposition in the surface array by ground particles at 125 m from the EAS core, , is the most important primary energy estimator in IceCube CR analysis. Figure 5 shows the distribution of the reconstructed as a function of CR true primary energy for IT-Contained proton events that passed the same QC for both IceTop-alone and the 3-D reconstructions.
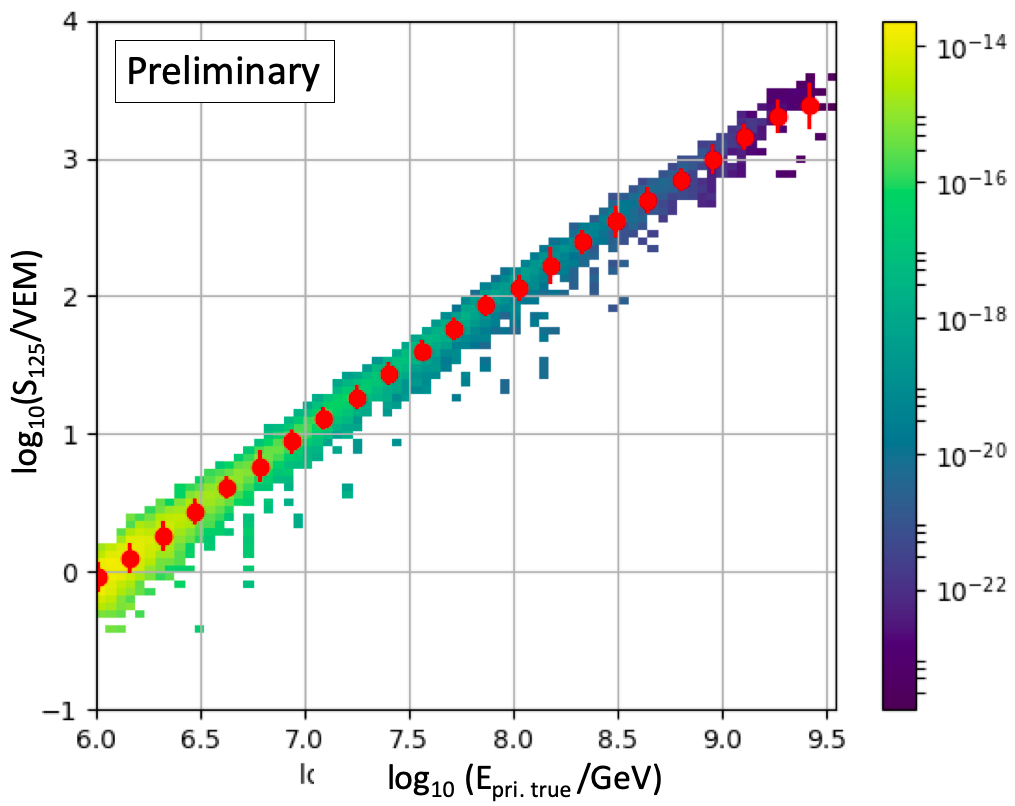
Besides the overall good agreement between these two reconstructions, the 3-D reconstruction results in a wider overall spread in the -energy relationship. Since the 3-D reconstruction has a better pointing resolution than IceTop-alone reconstruction for IT-Contained events (see plot on the left in Figure 3), the wider spread of is more likely related to the deteriorated core resolution by the 3-D reconstruction. Whether this can be improved by fine tuning the likelihood functions, optimizing the minimization iteration sequence, or by improving QC for the 3-D reconstruction needs more study. It is worth to note that, in a ”free-style” comparison for which each reconstruction uses its own QC, the 3-D reconstruction works better at very high energies by eliminating events misreconstructed by IceTop-alone reconstruction. Very similar features are also observed for IT-Contained iron events.
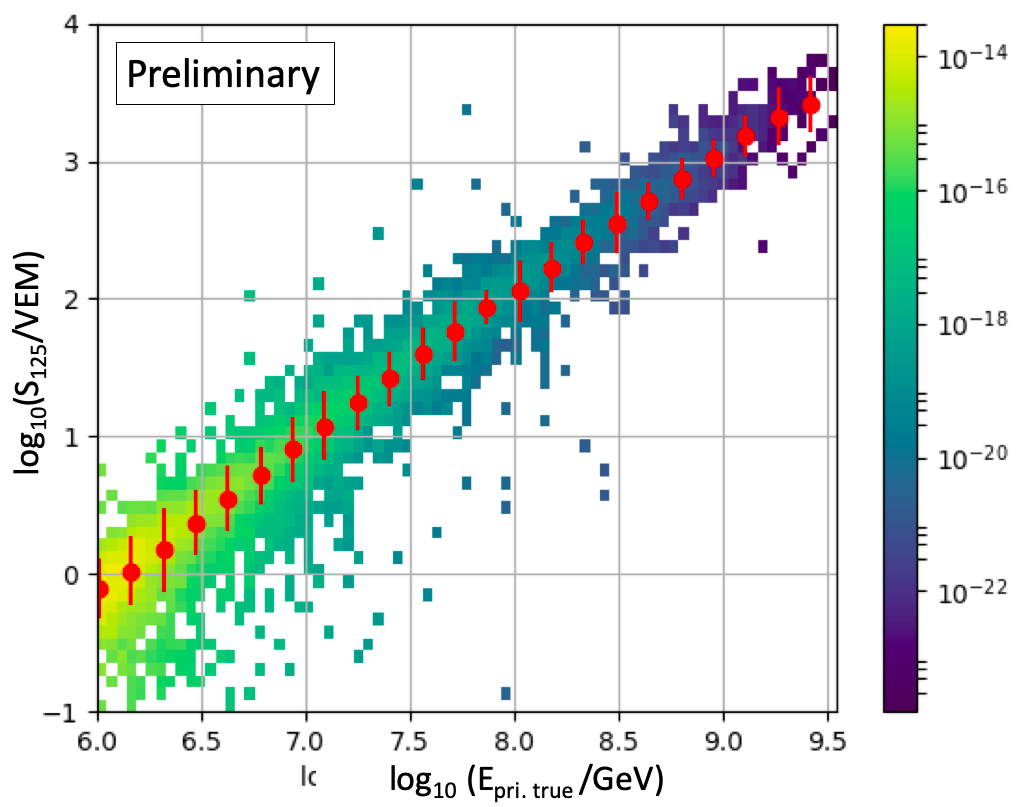
Like for IT-Contained events, the full reconstruction of IT-Uncontained events also needs estimators of primary energy and mass. As a preliminary test of the 3-D reconstruction, the values at different core distances are compared in Figure 6 for IT-Uncontained proton events in two zenith angle bins. The large standard deviation is related to the big zenith bin size and other statistical effects (ex. fluctuations in the EAS development, number of events, etc.) It can be seen that the
mean is zenith-dependent: events with small zenith angles have a mean that is systematically higher than more inclined events. Our study also showed that the mean depends on CR primary mass as well: proton events have higher mean than iron events at low energies; At high energies, the mean of iron events measured at core distances larger than 150 m are systematically higher than those of proton events. Those observations are qualitatively consistent with the fact that the mean shower maximum of proton events is larger (i.e. deeper in the atmosphere) by about 100 g/cm2 than iron events of the same energy, and vertical proton- and iron-induced EASs that reach their at IceTop altitude (692 g/cm2) have primary energy of about 108 GeV and 7109 GeV respectively. For the first time the new 3-D reconstruction enables the study of such relations for IT-Uncontained events that cover larger zenith angle than conventional IceTop-InIce coincident analysis which is primarily based on IT-Contained events. Obviously, more work is needed to quantify these relations in order to find optimal primary energy and mass estimators for physics studies with IT-Uncontained events.
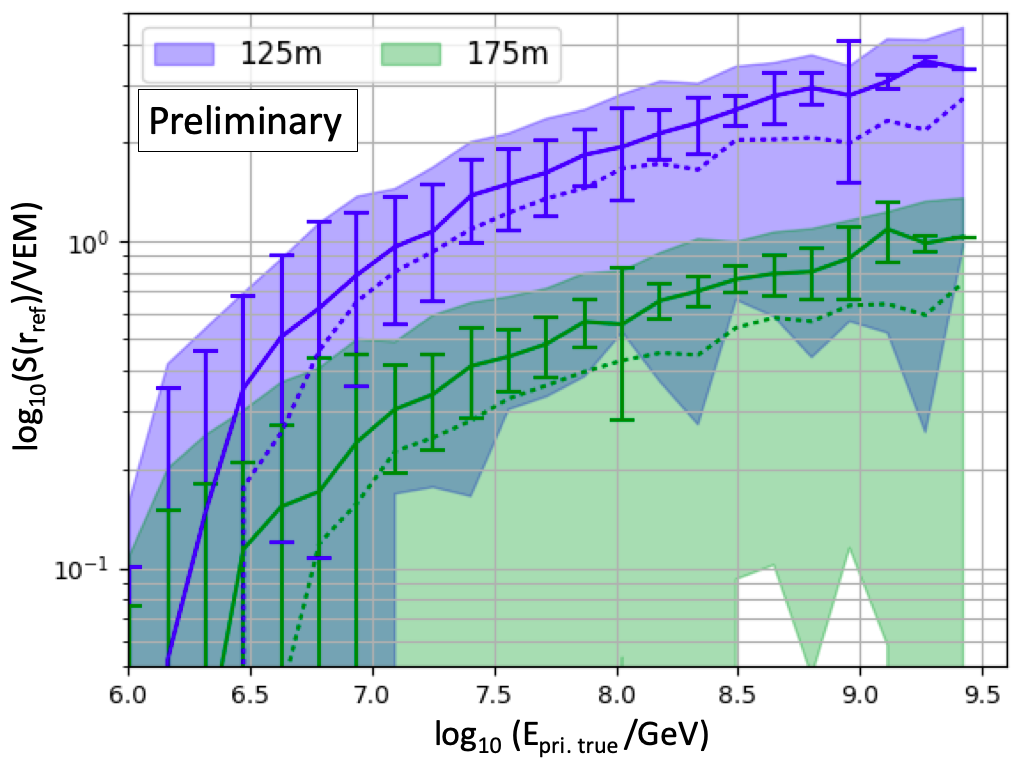
Other investigated quantities include in Eq. (1), curvature parameter in Eq. (2), the average muon bundle energy loss at slant depth 1500 m below the surface, and the number of stochastic losses along muon bundle track [12]. The results of the 3-D reconstruction are either comparable (mostly for IT-Contained events) or better (for IT-Uncontained events) than IceTop-alone or InIce-alone reconstructions.
4 Discussion and outlook
The new 3-D reconstruction can reconstruct CR events in IceCube with resolution comparable with or better than the IceTop-alone or InIce-alone reconstructions in most cases. It also has multiple merits. First, the 3-D reconstruction provides additional EAS parameters for events in both groups (e.g. curvature parameter in Eq. (2), and , etc.) By reconstructing those events landing outside of the IceTop array, i.e. the IT-Uncontained events, the 3-D reconstruction not only reduces the statistical uncertainties with significantly more events but is also expected to improve the systematics related to EAS development over a broader energy range than previous IceTop and in-ice coincident analysis based on IT-Contained events. This is because IT-Uncontained events have zenith peaked at about 25° and extend to about 60° before running out of statistics (versus 15° and 30° for IT-Contained events), which means that the detector can collect data from higher-energy showers that are still near their , due to the increased slant depth through the atmosphere.
More studies are still needed to optimize the new reconstruction. For example, it would be very interesting to see if the additional EAS parameters can help reduce uncertainties in the measurement of the mass or energy of CR primary particles; Besides the single LDF , the 3-D reconstruction can also fit IceTop data to an electromagnetic LDF and a muonic LDF simultaneously (an option provided through ”Signal Models” in Figure 1), which can be optimized to provide additional information for the study of electromagnetic and hadronic processes in EAS development. This work has focused on two groups of EAS events that all have high-energy muon tracks contained in the in-ice array. To measure the property of high-energy muons that are not contained in the in-ice array is also worth a dedicated study. Of course, the quality cuts for the 3-D reconstruction of events in different groups also need to be optimized along with these improvements and in the exploration for suitable estimators of CR primary mass and energy. By realizing the likelihood maximization for observables in both the IceTop and in-ice array simultaneously, the 3-D reconstruction provides a necessary tool for these studies to achieve a better accuracy for the research with IceCube data.
References
- [1] IceCube: South Pole Neutrino Observatory, https://icecube.wisc.edu.
- [2] Dawn Williams, for the IceCube Collaboration, PoS(ICRC2019)016;
- [3] Dennis Soldin, for the IceCube Collaboration, PoS(ICRC2019)014.
- [4] R. Abbasi, et al. (IceCube Collaboration), Nucl. Instrum. Meth. A700 (2013) 188-220, arXiv:1207.6326.
- [5] J. Ahrens, et al. (AMANDA Collaboration), Nucl. Instrum. Meth. A 524 (2004) 169-194, arXiv:astro-ph/0407044.
- [6] F. James, M. Roos, Computer Physics Communications 10 (1975) 343-367; Fred James and Matthias Winkler, MINUIT User’s Guide, INSPIRE-1258345.
- [7] S. Grullon, D. J. Boersma, G. Hill, K. Hoshina, K. Mase, in Proceedings of the 30th International Cosmic Ray Conference, Merida, Yucatan, Mexico, 2007, pp. 1457-1460, arXiv:0711.0353.
- [8] Aartsen, M.G. et al. (IceCube Collaboration), JINST 9 (2014) P03009, arXiv:1311.4767.
- [9] CORSIKA: An Air Shower Simulation Program, http://www-ik.fzk.de/corsika/.
- [10] E. Ahn, R. Engel, T. Gaisser, P. Lipari, and T. Stanev, Phys. Rev. D 80, 94003 (2009).
- [11] M. G. Aartsen, et al. (IceCube Collaboration), arXiv:1906.04317.
- [12] See details of the formulism and previous work on muon bundle energy loss in deep ice in Tom Feusels, Ph.D. dissertation, Ghent University, 2013; Sam De Ridder, Ph.D. dissertation, Ghent University, 2019.