Screening the Coulomb interaction and thermalization of Anderson insulators
Abstract
Long range interactions are relevant for a wide range of phenomena in physics where they often present a challenge to theory. In condensed matter, the interplay of Coulomb interaction and disorder remains largely an unsolved problem. In two dimensional films the long-range part of the Coulomb interaction may be screened by a nearby metallic overlay. This technique is employed in this work to present experimental evidence for its effectiveness in limiting the spatial range of the Coulomb interaction. We use this approach to study the effects of the long-range Coulomb interaction on the out-of-equilibrium dynamics of electron-glasses using amorphous indium-oxide films. The results demonstrate that electronic relaxation times, extending over thousands of seconds, do not hinge on the long-range Coulomb interaction nor on the presence of a real gap in the density of states. Rather, they emphasize the dominant role played by disorder in controlling the slow thermalization processes of Anderson insulators taken far from equilibrium.
pacs:
72.15.Rn 61.43.-jI Introduction
The interplay between disorder and Coulomb interaction has been a challenging problem in condensed matter physics. Effects associated with disorder while neglecting interaction may still be a difficult problem to solve. Such theories however are rarely applicable for experiments as disorder and interactions appear to be connected; increasing one usually increases the other. Few comprehensive studies treating disorder and interactions were made, usually when both are fairly weak or when the spatial range of the interaction is limited. In the strong-disorder regime however, neglecting the long-range part of the interaction is difficult to justify, thus further compounding a difficult problem. This is true in particular for the Anderson localization case where the question of Coulomb interaction originated decades ago 1 ; 2 is still unsolved despite extensive efforts. Some progress has been made on this many-body problem for short-range interaction 3 ; 4 ; 5 but effects of the long-range component are yet largely unresolved.
An intriguing result of the disorder-interaction competition is the appearance of a non-ergodic phase exhibiting glassy features. These involve slow conductance-relaxations of Anderson insulators taken far from the equilibrium and a variety of memory effects 6 ; 7 . Relaxation times that extend over thousands of seconds are observable at temperatures where the hopping-length, which is the effective screening-length in the insulating regime, is of the order of 20nm.
Theoretical models that qualitatively account for these effects are based on the opening up of a soft-gap 8 ; 9 ; 10 ; 11 ; 12 ; 13 ; 14 ; 15 in the system density of states (DOS). This, so called Coulomb-gap 16 , is reflected in the conductance G versus gate-voltage V as a cusp-like minimum centered at the point where the system was allowed to relax (the ‘memory-dip’) 7 . To be observable in G(V) scans, V/t must be fast enough relative to the relaxation-rate of the electronic system 17 . For technical reasons this condition limits the choice of systems to Anderson-insulators with relatively high carrier-concentration N where both disorder and interactions are strong 17 . The importance of strong disorder and interaction is attested by the seven different systems that exhibit these nonequilibrium effects all sharing the feature of high carrier-concentration N10cm. It is yet not clear however what role is played by the long-range Coulomb interaction in these phenomena.
In this work we attempt to find answers to this and related questions by using a metallic ground-plane in proximity to the sample to modify the long-range Coulomb interaction in a controlled way. Using samples configured for field-effect measurements, and furnished with a nearby screening-plane, yield results consistent with the anticipated 18 outcome for a modified Coulomb-gap. The dynamics of these systems, on the other hand, does not show significant difference relative to the reference samples. It seems therefore that, in addition to strong enough quenched disorder, short and medium-range interactions may be sufficient to account for the long relaxation times observed in the experiments. In particular, the results demonstrate that relaxation times extending over hours are sustainable in interacting Anderson insulators even while having a finite density-of-states at the chemical potential.
To optimize the effect of screening by a nearby metal, the system chosen for the study had rather low carrier-concentration. This also resulted in systems with short relaxation-times. We took advantage of the latter to systematically study the deviation from the logarithmic relaxation-law to elucidate the relative importance of disorder and interaction to the slow dynamics of the glassy phase.
II Experimental
II.1 Sample preparation and measurement techniques
Samples used in this study were 200Å thick films of InO. These were made by e-gun evaporation of 99.999% pure InO onto room-temperature Si wafers in a partial pressure of 1.5x10mBar of O and a rate of 0.50.1Å/s. The Si wafers (boron-doped with bulk resistivity 2x10cm) were employed as the gate-electrode in the field-effect and gate-excitation experiments. The samples were deposited on a SiO layer (2m thick) that was thermally-grown on these wafers and acted as the spacer between the sample and the conducting Si:B substrate.
The as-deposited films had sheet-resistance R□G at room-temperature. They were then thermally-treated. This was done by stages; the samples were held at a constant temperature starting from 340K for 20-30 hours then the temperature was raised by 5-10K for the next stage. This was repeated until the desired R□ was attained (see 19 for fuller details of the thermal-annealing and structure analysis). This process yielded samples with R□=18-45k that at T4K spanned the range of 100k to 40M. The carrier-concentration N of these samples, measured by the Hall-Effect at room-temperatures, was in the range N=8.7x10cm to 2x10cm.
The main focus in this work was a study of the effects produced by screening the long range part of the Coulomb interaction on the nonequilibrium transport of Anderson insulators. The experimental methodology we employed is a comparing simultaneously deposited samples, placing a metallic-plane in close proximity to just one of them. Figure 1 illustrates the geometry of the pair of samples, labeled ”screened” and ”reference”, each configured for field-effect measurements.
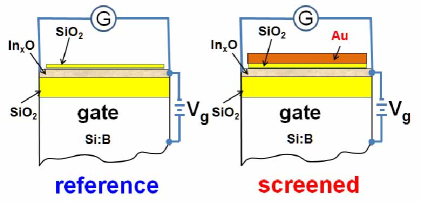
The distance between the screened sample and the screening-layer (a 200Å gold film) is determined by the thickness d of the SiO layer. This spacer, 7-11nm thick, was e-gun deposited on both the screened and reference sample simultaneously using pure quartz as the source. The Anderson insulator that was chosen for these experiments was the version of InO with low carrier-concentration (N2x10cm). This version has several attractive features for these experiments: In the first place, the relatively large inter-carrier distance N5nm, allows the spacer d to be thick enough to minimize pinholes while dN may still be small enough for effective screening. Secondly, the electron-glass dynamics becomes faster as their carrier-concentration falls below N4x10cm while, all other things being equal, the relative value of the excess-conductance in the excited state G/G is more conspicuous than in samples with N4x10cm. These expectations were borne out in our experiments which made it possible to quantify the system dynamics as it approaches the quantum phase transition.
Conductivity of the samples was measured using a two-terminal ac technique employing a 1211-ITHACO current preamplifier and a PAR-124A lock-in amplifier. Measurements were performed with the samples immersed in liquid helium at T4.1K held by a 100 liters storage-dewar. This allowed up to two months measurements on a given sample while keeping it cold. These conditions are essential for the measurements described below where extended times of relaxation processes are required at a constant temperature, especially when running multiple excitation-relaxation experiment on the same sample.
The gate-sample voltage (referred to as V in this work) in the field-effect measurements was controlled by the potential difference across a 10F capacitor charged with a constant current fed by the Keithley K220. The rate of change of V is determined by the value of this current. The range of V used in this study reached in some cases 50V which is equivalent to the 12V used in previous studies where the gate-sample separation was 0.5m as compared with the 2m SiO spacer used here.
The ac voltage bias in conductivity measurements was small enough to ensure near-ohmic conditions. The voltage used in the relaxation experiments was checked to be in the linear response regime by plotting the current-voltage characteristics of each sample.
III Results and discussion
III.1 Modifying the memory-dip by a screening-plane
The idea behind the use of the elaborate construction described in Fig.1 was to find out the effect of eliminating (or at least weakening) the long-range part of the Coulomb interaction. This relies on comparing results of identical measurements on the screened and reference samples. For that to be a tenable procedure, one has to ascertain that the two samples differ only by the image-charges created in the nearby gold layer. This is not a trivial undertaking to secure as the act of depositing the gold layer may inadvertently break the symmetry between the reference and screened samples; For example, the heat produced during deposition of the gold layer will unavoidably cause some annealing in the screened sample. A different disorder in the screened sample may also arise from the strain related to mismatch in mechanical properties of the Au/SiO interface. In principle, a difference in disorder between the screened-reference samples can be compensated by a judicious thermal annealing of the samples to make their room-temperature resistivity close to one another. However, being Anderson insulators, a few percent difference in room-temperature resistance may translate to orders of magnitude disparity at liquid helium temperatures.
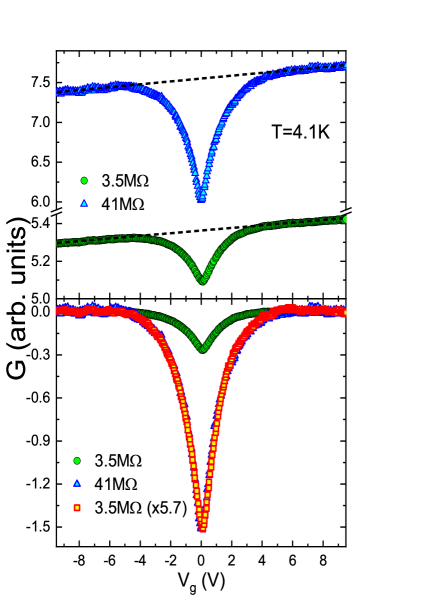
Fortunately, the feature that is targeted for investigation here is not susceptible to these artifacts; The shape of the memory-dip which reflects the underlying Coulomb-gap is a robust feature. At a given temperature, the MD shape is independent of the sample disorder, the sweep-rate, time since cooldown, magnetic-fields etc., it depends only on the carrier-concentration which is set by the In/O ratio as demonstrated in 7 . To illustrate, figure 2 shows the dependence of the conductance G on gate-voltage V for two of the studied ‘reference’ samples. These share the same composition but were subjected to different degree of annealing and thus exhibit different sheet-resistance (and thus disorder).
The top plate of Fig.2 show the raw data for the field-effect G(V) of these samples. Two features are observed in this figure; an asymmetric component characterized by G(V)/V0 that reflects the increased thermodynamic density-of-states with energy (the thermodynamic field-effect), and a cusp-like dip centered at V=0 where the system was allowed to relax before sweeping the gate voltage (the memory-dip). By subtracting from each plot the respective thermodynamic G(V) component, one gets the two MD’s that, after multiplication by a constant are shown to have the same shape despite the large disparity in their resistance.
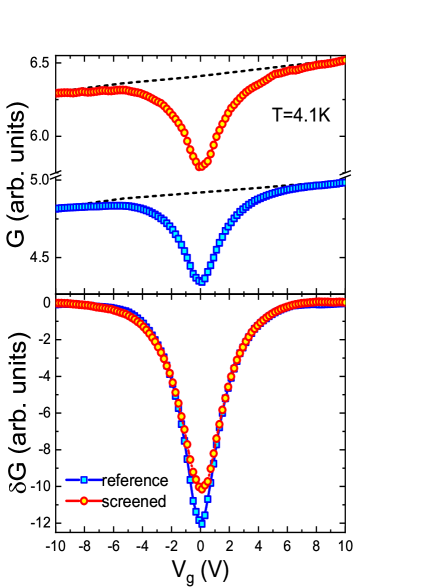
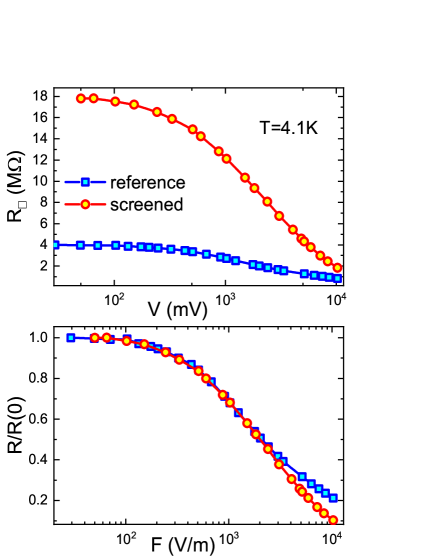
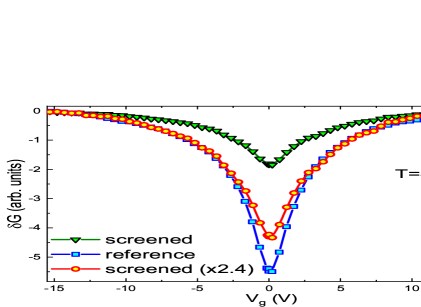
By contrast, the MD’s of the reference-screened samples fail to show similar data collapse. Figure 3 shows the results of an attempt to match the memory-dips for a specific couple. In this case, factor-scaling the data for the two memory-dips is possible for most of the range of G(V) but not near its equilibrium point where the screened dip falls short of the reference. Figure 4 shows however that the current-field characteristics of these samples is nearly identical even deeper into the non-ohmic regime and there is no sign of a current-short from the active sample to the screening-layer.
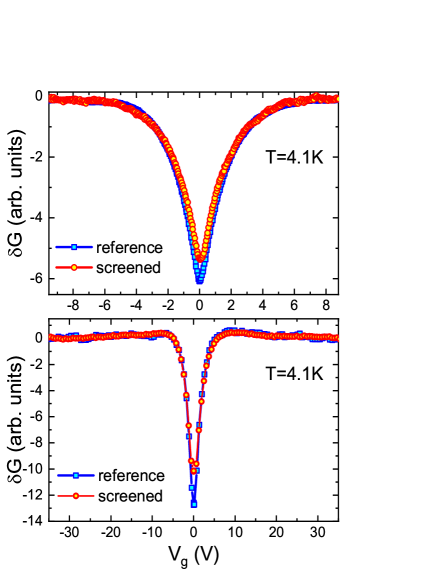
Note that in this pair, the resistance of the screened sample was larger than that of the reference. The cutback-shaped MD of the screened sample relative to the reference has been observed in all six pairs studied in this work, This was independent of the relative value of the resistances involved. The scaled results for a pair where the sheet-resistance R□ of the screened sample is smaller than that of the reference sample are shown in Fig.5 which depicts the same qualitative features as in Fig.3.
Finally, Fig.6 shows two more reference-screened pairs taken from a single specific deposition-batch with carrier-concentration N1.9x10cm. The figure includes both R□(reference)R□(screened) and R□(reference)R□(screened) cases as well as an extended range of the field-effect vs. a higher resolution view of the memory-dip main features.
Screening by a nearby metallic plane has been shown to change the spatial dependence of the Coulomb interaction even in diffusive systems; Some features of the single-particle DOS found in tunneling experiments on two and three-dimensional indium-oxide samples differed in both magnitude and functional dependence from those predicted by simple models of interaction and disorder 20 . These differences were accounted for by Altshuler et al based on the image-charges created due to proximity of the sample to the tunneling electrode 21 . The lack of screening in the Anderson-insulating phase makes the system more susceptible to the influence of the nearby metallic-plane. A modified form of the Coulomb interaction is therefore an expected effect 22 . Indeed, the reduced relative magnitude of the screened-MD observed in the current experiments is consistent with the effect of a screening layer on the Coulomb-gap of a 2D system. This effect was estimated theoretically by Hadley et al 18 . In our six samples the reduced magnitude of the MD of the screened sample ranged between 12% to 23%, which according to 18 are associated with dN2.8 to 1.6 respectively. For the carrier-concentrations used in this work N=8.7x10cm to 1.9x10cm, these values give d in the range 8-15nm which in good agreement with the thickness of the SiO spacer used (see section II above). In the six pairs of screened-reference samples however, it was not possible to see a systematic dependence on the spacer d. This is probably due to relatively large thickness variations in these thin films; both SiO2 and InO have been tested by AFM which showed thickness fluctuations of the order of 8% 23 .
It is natural to ask how limiting the interaction-range affects how the system thermalizes after being taken out of equilibrium, attempts to answer this question are discussed next.
III.2 Thermalization dynamics
III.2.1 Experimental definition of the thermalization-time
It is rarely possible to ascertain experimentally that a system under observation is thermalized. One may however monitor the process of the approach towards equilibrium by following a specific measurable and associate the state of thermalization with the time where this measured quantity reached a time-independent value relative to which the system just fluctuates. Thermalization and relaxation will be used here interchangeably although technically the time-independent regime may only signal pre-thermalization.
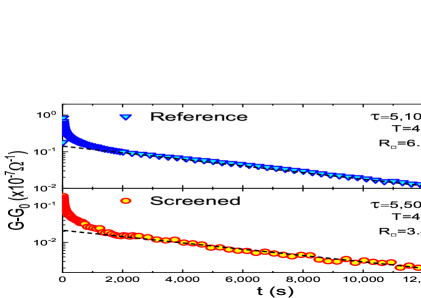
An effective and way to take the system far from equilibrium and observe the ensuing relaxation is the ‘gate-protocol’. In this protocol a nonequilibrium state is created by switching the gate-voltage V from an equilibrium value V to a new one V. This process is reflected in the appearance of excess-conductance G(t) that decays slowly with time. An example for the results obtained with this protocol is shown in Fig.7.
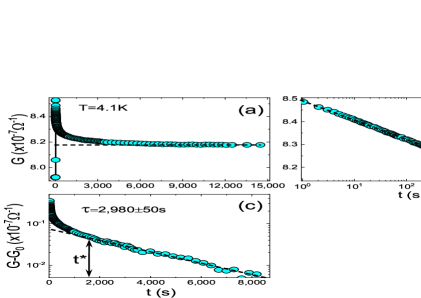
The relaxation to the equilibrium under the newly established V was monitored through the measured G(t). As observed in Fig.7, G(t)-log(t) for several hundred seconds (up to t’ in Fig.7b), and after a time marked as t* (Fig.7c) the relaxation-law reverts to G(t)exp[-t/], which defines that will be used here as the characteristic thermalization-time. As will be shown in the next paragraph, when properly implemented, this ‘gate-protocol’ is equivalent to quench-cooling the system from high temperatures. The latter, has the advantages of being history-free but the thermal-cycle runs the risk of changing the structure of the sample (and possibly damage it more seriously), and it also sacrifices the short-time relaxation because one must wait for the sample and its surroundings (sample stage, thermometer, etc.) to cool to the bath temperature. The gate-protocol, by contrast, may be safely repeated many times on the same sample and no ‘parasitic’ heating is involved in the process.
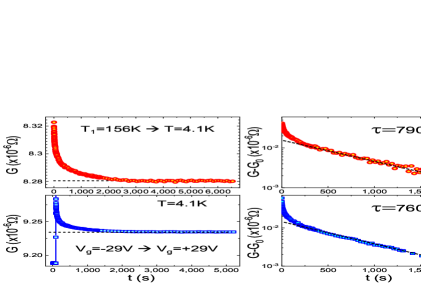
An important caveat when using the gate-protocol is to let the sample reach equilibrium before changing the gate voltage to a new value to avoid history dependence 24 . As a check on this point, we compared the relaxation time of a sample by both, a thermal-quench and the gate-protocol. The results, shown in Fig.8, demonstrate that the relaxation-time based on the gate-protocol is essentially identical with that based on quench-cooling the sample. We believe that the gate-protocol can be relied upon to yield the correct relaxation-time provided the equilibration-time is longer than . For the series of measurements reported below, the samples were equilibrated under V for at least 12 hours under V.
III.2.2 Dynamics of screened-reference samples
Comparing between screened and the reference samples is more problematic when it comes to dynamics than the difficulties mentioned above with regard to the effect on the shape of the memory-dip. The latter is independent of the disorder; the MD shape is the same even when the sample R□ changes by order of magnitude (see Fig.2 above) while the dynamics is quite sensitive to the sample disorder 17 as will be demonstrated below. Figure 9 shows G(t) for the asymptotic relaxation regime generated by using the gate-protocol. These data were taken on the same samples used for comparing the MD shapes in Fig.5 above that, in terms of their R□, is our best-matched screened-reference pair. The data in Fig.9 clearly suggest that the relaxation-time of the screened sample is essentially the same as the reference. Therefore, limiting the range of the Coulomb interaction to 8nm does not have a significant effect on the system relaxation-time. Moreover, of the order of few thousands of seconds is manifestly possible even without long-range interaction. This is a useful piece of information that should make it easier for theory to finally address the long-standing question of the slow relaxation times of some electron-glasses 24 . We return to this issue after discussing the results of the dynamics as function of disorder.
III.2.3 Disorder vs. Interaction
To get a better picture of the dynamics we expanded a preliminary study of InO films with low carrier-concentration N=8.7x10cm 25 by measuring 13 samples from the batch with N=1.9x10cm with which most of the screen-reference samples studied here were made.
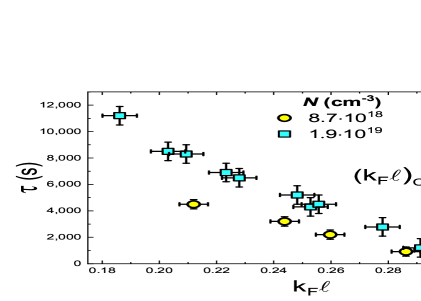
Figure 10 shows the relaxation time (defined by the exponential-relaxation regime of the gate-protocol) as function of the dimensionless parameter k. As in other studies 26 ; 27 , k=(3)··N was taken as the measure of the quenched disorder ( is the sample conductivity at room-temperature).
There are two interesting features that emerge from the data; First, the
relaxation-time decreases with k and tends to zero roughly at
the disorder range where the system undergoes the metal to insulator
transition. The critical value of disorder (k)
for the metal-insulator transition was independently measured for two versions
of the material with N10cm
26 and N10cm27
yielding in both (k)=0.310.03.
That the glassy features end at the transition is an important finding; it
supports the conjecture that the slow relaxation is an electronic effect
rather than reflecting structural defects. Note that the reduction of
with k is achieved in InO by thermal-annealing.
Changes in the structural properties of the material during the annealing
process were extensively studied in 17 by electron-diffraction,
energy-dispersive spectroscopy, x-ray interferometry, and optical techniques.
The study revealed that the change in the resistance from the as-deposited
deeply-insulating state all the way to the metallic regime is mainly due to
increase of the material density. In particular, the samples retained
their amorphous structure and composition throughout the entire process.
Moreover, the dynamics associated with structural changes monitored during
annealing and recovery of the samples was qualitatively different than that of
the electron-glass and did not change its character throughout the entire
range of disorder. The diminishment of with k cannot
then be identified with the elimination of some peculiar structural defects.
Secondly, the relaxation-time is not a function of just k; it appears that it also depends on the carrier-concentration
N. Indeed, the exponential relaxation regime (which allows an
unambiguous definition of ) become quickly out of reach for samples when
N5x10cm. The data in Fig.10 seem to
suggest a scaling relation of the form:
where the prefactor (N) presumably increases with carrier-concentration. One may surmise that the dependence on N may be the effect of interactions. The logic is based on the realization that, due to lack of electronic screening of the Anderson-insulator, higher density of carriers enhances the strength of interaction. While it is plausible that interactions in the localized system get stronger with N, it is not necessarily the main (or the only) reason for slower relaxation 17 . It is here that the issue of separating effects of Coulomb interaction from of the effect of disorder that presents a frustrating problem because interaction and disorder both increase with N. Actually, a viable cause for increasing with N is the higher degree of disorder in samples that have higher carrier-concentrations. Note that a pre-condition for the electronic system to exhibit slow relaxation is Anderson-localization 17 . This requires that the disorder energy has to be larger than the Fermi energy E by a certain factor 28 ; 29 . All other things being equal, a system with larger carrier-concentration N must be more disordered to be Anderson-localized and thus has larger . This, in turn, will exponentially slowdown the inter-site transitions, whether activated or through tunneling.
The way that Coulomb interactions affect thermalization dynamics is less clear. Interactions may modify transition rates through reduction of the density of states and many-particle transitions may be involved in the process but it is hard to find experimental evidence that may be uniquely related to these mechanisms. A large magnitude of memory-dip, suggestive of a more dominant role of interactions, is actually found in low-N systems where dynamics is relatively fast as found in the present study. This however does not mean that interactions act to speed-up thermalization, rather it shows that the disorder effect (being weaker in low-N) is more important. A possible example for enhanced carrier-concentration without the accompanying increase of disorder was observed in GeSbTe samples in their persistent photoconductive state 30 . This caused an enhanced magnitude of the memory-dip, which was interpreted as an interaction effect 30 . It also slowed-down the dynamics but interaction is not the only possible mechanism for it; the slow decay of the photo-induced carriers may be the more mundane reason.
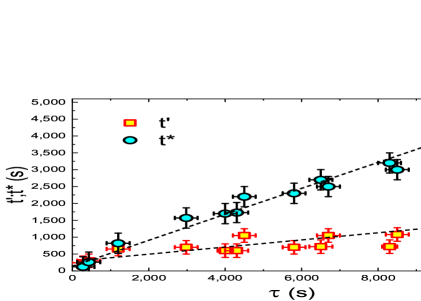
The transition to the exponential relaxation at long times, as observed for example in Fig.7 above, is expected. A log(t) relaxation is limited to intermediate times; it has to cross over to a different form for both short and long times 31 . The transition from a logarithmic to the exponential-relaxation regime is preceded by a more complicated time dependence which perhaps resembles the fast relaxation observed in phosphorous-doped silicon 32 . This region extends over a time-period that grows monotonically with disorder 33 as is shown in Fig.11.
The dependence of the dynamics on k may be summarized as follows: As k increases and the system approaches the diffusive regime, the rate-distribution, that controls the relaxation from an excited state, gets narrower due to reduction of the lowest transition-rates (associated with the deduced from the exponential-relaxation regime). Concomitantly, the range over which logarithmic relaxation is observed shrinks linearly with k (Fig.11).
It is intriguing that the time-period for the log(t) relaxation in electron-glass may extend over almost six decades 24 without a sign of a crossover. To account for such an extensive range one has to assume a fairly uniform distribution of transition-rates over a wide frequency range. It seems obvious that a main ingredient in the underlying mechanism is sufficiently strong disorder, but it probably also involves many-body effects 34 . The current study demonstrated that electronic relaxation extending over thousands of seconds is a viable possibility without the long-range part of the Coulomb interaction playing a significant part (and therefore the DOS at the Fermi-energy must be finite even at T=0).
It is harder to assess the contribution of short and medium-range Coulomb interaction to the dynamics. One might argue that the faster dynamics observed as the system approaches the metallic regime may, at least in part, be due to the enhanced dielectric-constant that in turn weakens the interaction. The dielectric-constant in the localized state is expected to increase significantly near the transition 35 . However, the functional dependence of (k) shown in Fig.10 does not exhibit a change from the linear dependence as the transition is approached. Therefore, this scenario is not supported by our experiments. Interactions are more likely to play a significant role in the ultra-slow processes that are necessary to reach the true ground-state of the system, a process that presumably hinges on many-particle transitions 36 .
There are other mechanism that may contribute to stretch the transition-rates distribution and afford an extended log(t) dependence. Reduction of transition-rates relative to the ”bare” rates controlled by disorder may occur for non-local interactions. These may bring into play additional constraints as well as effects related to coupling of the tunneling charge to other degrees of freedom (polaronic-effects, and the orthogonality-catastrophe 37 ; 38 ; 39 ). Resolution of these issues remain a challenge to theory.
Acknowledgements.
Illuminating discussions with A. Vaknin and M. Schechter are gratefully acknowledged. This research has been supported by a grant No 1030/16 administered by the Israel Academy for Sciences and Humanities.References
- (1) P. W. Anderson, Phys. Rev. 109, 1492 (1958).
- (2) L. Fleishman and P. W. Anderson, Phys. Rev. B 21, 2366 (1980).
- (3) I. V. Gornyi, A. D. Mirlin, and D. G. Polyakov, Phys. Rev. Lett. 95, 206603 (2005).
- (4) D. M. Basko, I. L. Aleiner, and B. L. Altshuler, Ann. Phys. (N.Y.) 321, 1126 (2006).
- (5) V. Oganesyan and D. A. Huse, Phys. Rev. B 75, 155111 (2007); Rahul Nandkishore and David A. Huse, Annu. Rev. Condens. Matter Phys., 6, 15 (2015).
- (6) M. Ben-Chorin, D. Kowal and Z. Ovadyahu, Phys. Rev. B 44, 3420 (1991); M. Ben Chorin, Z. Ovadyahu and M. Pollak, Phys. Rev. B48, 15025 (1993).
- (7) A. Vaknin, Z. Ovadyahu, and M. Pollak, Phys. Rev. B 65, 134208 (2002).
- (8) J. H. Davies, P. A. Lee, and T. M. Rice, Phys. Rev. Lett, 49, 758 (1982); M. Grünewald, B. Pohlman, L. Schweitzer, and D. Würtz, J. Phys. C, 15, L1153 (1982); J. H. Davies, P. A. Lee, and T. M. Rice, Phys. Rev. B 29, 4260 (1984); C. C. Yu, Phys. Rev. Lett., 82, 4074 (1999).
- (9) M. Müller and L. B. Ioffe, Phys. Rev. Lett. 93, 256403 (2004).
- (10) Vikas Malik and Deepak Kumar, Phys. Rev. B 69, 153103 (2004).
- (11) R. Grempel, Europhys. Lett., 66, 854 (2004); A. B. Kolton, D. R. Grempel, and D. Dominguez, Phys. Rev. B 71, 024206 (2005).
- (12) Eran Lebanon, and Markus Müller, Phys. Rev. B 72, 174202 (2005); M. Müller and E. Lebanon, J. Phys. IV France, 131, 167 (2005).
- (13) Ariel Amir, Yuval Oreg, and Yoseph Imry, Phys. Rev. B 77, 165207 (2008); Ariel Amir, Yuval Oreg, and Yoseph Imry, Annu. Rev. Condens. Matter Phys. 2, 235 (2011).
- (14) Y. Meroz, Y. Oreg and Y. Imry, EPL, 105, 37010 (2014).
- (15) M. Pollak, M. Ortuño and A. Frydman, ”The Electron Glass”, Cambridge University Press, England (2013).
- (16) M. Pollak, Discuss. Faraday Soc. 50, 13 (1970); A. L. Efros and B. I. Shklovskii, J. Phys. C: Solid State Phys., 8, L49 (1975).
- (17) Z. Ovadyahu, Phys. Rev. B. 95, 134203 (2017).
- (18) B. Hadley, M. Green, M. Pollak, R. Chicon, and M. Ortuño, J.l of Non-Crys. Solids 97&98, 233 (1987).
- (19) Z. Ovadyahu, Phys. Rev. B 95, 214207 (2017).
- (20) Y. Imry and Z. Ovadyahu, Phys. Rev. Lett.. 49, 841 (1982).
- (21) B. L. Altshuler, A. G. Aronov, and A. Yu. Zyuzin, Sov. Phys. JETP 59, 415 (1984); Zh. Eksp. Teor. Fiz. 86, 709 (1984).
- (22) A. I. Larkin and D. E. Khmel’nitskii, Sov. Phys. JETP 56, 647 (1982); Zh. Eksp. Teor. Fiz. 83, 1140 (1982).
- (23) A. Frydman and Z. Ovadyahu, Phys. Rev. B 55, 9047 (1997).
- (24) Z. Ovadyahu, and M. Pollak, Phys. Rev. B 68, 184204 (2003).
- (25) Z. Ovadyahu, Phys. Rev. B 97, 214201 (2018).
- (26) D. Shahar and Z. Ovadyahu, Phys. Rev. B 46, 10917 (1992).
- (27) U. Givan and Z. Ovadyahu, Phys. Rev. B 86, 165101 (2012).
- (28) B. R. Bulka, B. Kramer, and A. MacKinnon, Z. Phys. B - Condensed Matter 60, 13 (1985).
- (29) B. Bulka, M. Schreiber, and B. Kramer, Z. Phys. B - Condensed Matter 66, 21 (1987).
- (30) Z. Ovadyahu, Phys. Rev. Lett., 115, 046601 (2015); Z. Ovadyahu, Phys. Rev. B 97, 054202 (2018).
- (31) G. Mihàly and L. Mihàly, Phys. Rev. Lett., 52, 149 (1984).
- (32) V. K. Thorsmølle, and N.P. Armitage, Phys. Rev. Lett. 105, 086601 (2010).
- (33) This part of the relaxation may be fitted to a stretched-exponential function, G(t)=Aexp[-(t/)β] by adjusting the parameters and . For example, the data for the intermediate range of 15st5x10s in Fig.7c may be fitted with the three parameters A=3.3x10, =185s, and =0.33.
- (34) M. Pollak and M. Ortuño, Sol. Energy Mater., 8, 81 (1982); M. Pollak, Phil. Mag. B 50, 265 (1984).
- (35) T. G. Castner, N. K. Lee, G. S. Cieloszyk, and G. L. Salinger, Phys. Rev. Lett. 34, 1627 (1975); David Stroud and David J. Bergman, Phys. Rev. B 25, 2061(R) (1982); H. S. Choi, J. S. Ahn, J. H. Jung, T. W. Noh, and D. H. Kim, Phys. Rev. B 54, 4621 (1996).
- (36) S. D. Baranovskii, B. I. Shklovskii, A. L. Efros, Sov. Phys. JETP 51, 199 (1980); A. Möbius, M. Richter, and B. Drittler, Phys. Rev. B 45, 11568 (1992); A. L. Efros, B. Skinner, and B. I. Shklovskii, Phys. Rev. B 84, 064204 (2011).
- (37) P. W. Anderson, Phys. Rev. Lett. 18, 1049 (1967); A. J. Leggett et al., Rev. Mod. Phys. 59, 1 (1987); Z. Ovadyahu, Phys. Rev. Lett., 99, 226603 (2007).
- (38) Vedika Khemani, Rahul Nandkishore, and S. L. Sondhi, Nature Physics, 11, 560 (2015).
- (39) D. L. Deng, J. H. Pixley, X Li, S. D. Sarma, Phys. Rev. B. 92, 220201(R) (2015).