Detection of hole pockets in the candidate type-II Weyl semimetal MoTe2 from Shubnikov-de Haas quantum oscillations
Abstract
The bulk electronic structure of -MoTe2 features large hole Fermi pockets at the Brillouin zone center () and two electron Fermi surfaces along the direction. However, the large hole pockets, whose existence has important implications for the Weyl physics of -MoTe2, has never been conclusively detected in quantum oscillations. This raises doubt about the realizability of Majorana states in -MoTe2, because these exotic states rely on the existence of Weyl points, which originated from the same band structure predicted by density functional theory (DFT). Here, we report an unambiguous detection of these elusive hole pockets via Shubnikov-de Haas (SdH) quantum oscillations. At ambient pressure, the quantum oscillation frequencies for these pockets are 988 T and 1513 T, when the magnetic field is applied along the -axis. The quasiparticle effective masses associated with these frequencies are 1.50 and 2.77 , respectively, indicating the importance of Coulomb interactions in this system. We further measure the SdH oscillations under pressure. At 13 kbar, we detected a peak at 1798 T with = 2.86 . Relative to the oscillation data at a lower pressure, the amplitude of this peak experienced an enhancement, which can be attributed to the reduced curvature of the hole pockets under pressure. Combining our experimental data with DFT + calculations, where is the Hubbard parameter, our results shed light on why these important hole pockets have not been detected until now.
-MoTe2, like its prominent relative WTe2, is an important member of the transition metal dichalcogenide family exhibiting interesting electronic properties Yan2017 . -MoTe2 has been predicted to be a type-II Weyl semimetal, in which the Weyl points arise from linear touching points at the boundary between electron and hole pockets Sun2015 ; Soluyanov2015 ; Wu2016prb ; Deng2016 ; Jiang2017nc ; Wang2016 ; Aryal2019 . Furthermore, -MoTe2 exhibits a non-saturating, quadratic extremely large magnetoresistance (XMR) at low temperatures Keum2015 , which can at least be partially attributed to a perfect compensation between electron and hole carriers Zhou2016prb ; Lee2018 ; Chen2016a . Additionally, -MoTe2 undergoes a superconducting transition at K and a structural transition to the phase above 263 K at ambient pressure Qi2016 . Under pressure, is rapidly suppressed, extrapolating to 0 K at 11 kbar Takahashi2017 ; Heikes2018 ; Lee2018 ; Hu2019 , while is rapidly enhanced. This makes MoTe2 interesting because of the ability to access both the and phase with a moderate pressure. At 15 kbar ( phase), the 2D superconductivity has been reported Hu2019 .
For a thorough discussion of the intriguing properties of MoTe2, it is imperative to understand its electronic structure. Several early angle-resolved photoemission spectroscopy (ARPES) measurements have claimed to observe Weyl points and Fermi arcs in -MoTe2, and the measured bulk Fermi surfaces are in broad agreement with the prediction of density functional theory (DFT) Deng2016 ; Jiang2017nc ; Crepaldi2017 ; Tamai2016 ; Weber2018 . However, an agreement between quantum oscillations and DFT has been significantly less satisfying: the large hole pockets predicted in DFT Rhodes2017 did not show up in quantum oscillation data Rhodes2017 ; Qi2016 ; Zhou2016prb ; Chen2018prb ; Luo2016 ; Zhong2018 ; Liu2019 . To match the experimental data with the calculation, an ad hoc shift of the valance bands relative to the Fermi energy was performed Rhodes2017 . Unfortunately, such a band shifting eliminates the type-II Weyl points, raising doubt regarding the true topological nature of -MoTe2. Although Majorana states due to the interplay between topological semimetal and superconductivity have been proposed AChen2016 ; AChen2017 , their realizability in -MoTe2 becomes doubtful with the elimination of Weyl points. On the other hand, the absence of hole pockets would present significant challenges to the understanding of -MoTe2. For instance, it would be impossible to reconcile the absence of hole pockets with the interpretation of the XMR based on electron-hole carrier compensation scenario.
Recently, it has been pointed out that if Coulomb interaction is included in DFT calculations, a better agreement with ARPES data can be achieved Aryal2019 ; Xu2018 . Furthermore, in these DFT + calculations, where is the on-site Coulomb interaction of Mo electrons, the shift of energy bands similar to the operation attempted in Ref. Rhodes2017 can be reproduced without the elimination of the type-II Weyl points. With an increasing , the hole pockets are shrinking. For instance, the frequency of the biggest hole pocket when the magnetic field () is applied along the -axis decreases monotonically from 2000 T at to 1500 T at eV Aryal2019 . Hence, even with the inclusion of a sizeable , a distinct quantum oscillation frequency larger than 1000 T should still appear, which had not been detected experimentally Rhodes2017 ; Qi2016 ; Zhou2016prb ; Chen2018prb ; Luo2016 ; Zhong2018 ; Liu2019 . Therefore, the observation of this particular frequency when has been long awaited and it can be regarded as the “smoking gun” evidence for the correctness of DFT predictions, and it serves to pinpoint a value of . This observation would also represent an unambiguous detection of the hole pockets, which is clearly crucial for understanding MoTe2 physics. In this manuscript, we present our Shubnikov-de Haas (SdH) oscillations from high quality MoTe2 single crystals. With , we successfully detect new frequencies that can be assigned to the hole pockets, in excellent agreement with DFT + calculations. Moreover, our data show that with an increasing pressure, the hole pockets become more two-dimensional and cylindrical, explaining why the SdH oscillations are hard to detect at ambient pressure.
Single crystals of MoTe2 were synthesized by the Te-flux method as described in Supplemental Material SUPP . Three thin MoTe2 samples with a thickness of around 10 m were cleaved from the same crystal: samples A and C for ambient pressure, and sample B for high pressure measurements. C was measured at The National High Magnetic Field Laboratory (NHMFL) in Tallahassee. These thicknesses guarantee that our samples are in the bulk limit. The electrical resistivity up to 14 T was measured by a four-terminal configuration either in a Physical Property Measurement System by Quantum Design (down to 2 K) or a dilution fridge by Bluefors (down to 30 mK). Hydrostatic pressure was provided by a piston-cylinder clamp cell with glycerin as the pressure transmitting medium. The pressure value was determined resistively by the superconducting transition of Pb. DFT + calculations were performed, with details provided in Supplemental Material SUPP .
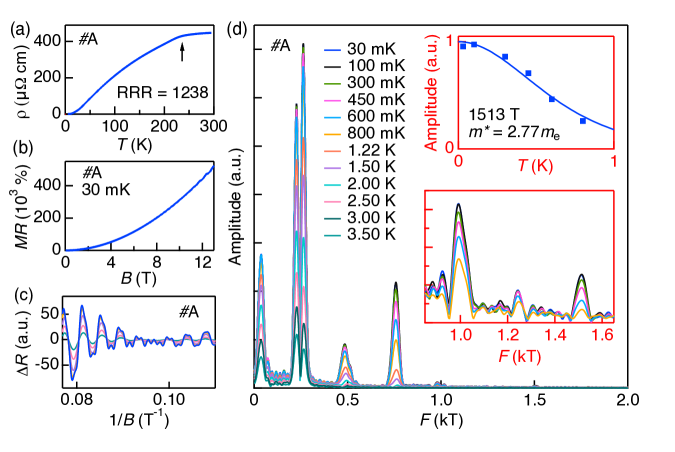
We begin by a presentation of our ambient pressure data. Figure 1(a) shows the zero-field of sample #A at ambient pressure, collected on cooling. An anomaly in is observed at 236 K at ambient pressure, corresponding to the first-order structural transition. The residual resistivity ratio [RRR=(300K)/(2K)] is 1238, indicating superior sample quality. Figure 1(b) shows the magnetoresistance (MR) at 30 mK with , reaching a value of % at 13 T, manifesting again the high quality of our sample. With the large magnetoresistance background removed, clear Shubnikov-de Haas oscillations can be seen (Fig. 1(c)). In Fig. 1(d), we display the SdH spectra obtained from Fast Fourier transform (FFT) for a wide range of temperatures. Our SdH spectra for are considerably richer than most existing data in the literature thus far Rhodes2017 ; Qi2016 ; Zhou2016prb ; Chen2018prb ; Luo2016 ; Zhong2018 ; Liu2019 : T and T are the same as previously reported peaks Rhodes2017 ; Qi2016 ; Zhou2016prb ; Chen2018prb ; Luo2016 ; Zhong2018 ; Liu2019 , and they correspond to the electron pockets. However, we also detect more frequencies, including T, T, T.
A long-standing mystery in the studies of MoTe2 electronic structure concerns the absence of any quantum oscillation frequencies above 1000 T with in experiments. When we examine our SdH data closely, we discover new frequencies at 988 T and 1513 T. As shown in the lower inset of Fig. 1(d), the peaks are weak but well above the noise floor. The temperature dependence of the amplitudes follows the prediction of Lifshitz-Kosevich theory, enabling the extraction of sheet-resolved effective masses . For the peak at 1513 T, (see the upper inset of Fig. 1(d)). For the peak at 988 T, SUPP . Note that there is a much weaker peak at 1244 T, which could be an artifact of the experiment. The frequency of the 1513 T peak is nearly . However, the effective mass of is SUPP , which is significantly more than half of . Hence, we can exclude the possibility that the 1513 T peak is the second harmonic of . We further varied the field angle at 30 mK to track the angular dependence of the new found SdH frequencies (see Supplemental Material SUPP ). The comparison between our data and the DFT+ calculations enables us to definitively associate the frequencies at 988 T and 1513 T with the large hole pockets in -MoTe2. Besides, the rather large highlights the importance of electron-electron correlations, and justifies the inclusion of Hubbard in the calculations.
Figure 2(a) displays the calculated hole Fermi surfaces that are of central interest in this Letter. At ambient pressure, in the phase, they are large and closed, three-dimensional pockets. Since our angular dependence of SdH frequencies indeed exhibits a good agreement with the calculations with eV SUPP , we fix to 3 eV. We point out that the curvature of the hole pockets along the direction is large. We speculate that this relatively large curvature, together with the large , are responsible for the difficulty in detecting these frequencies.
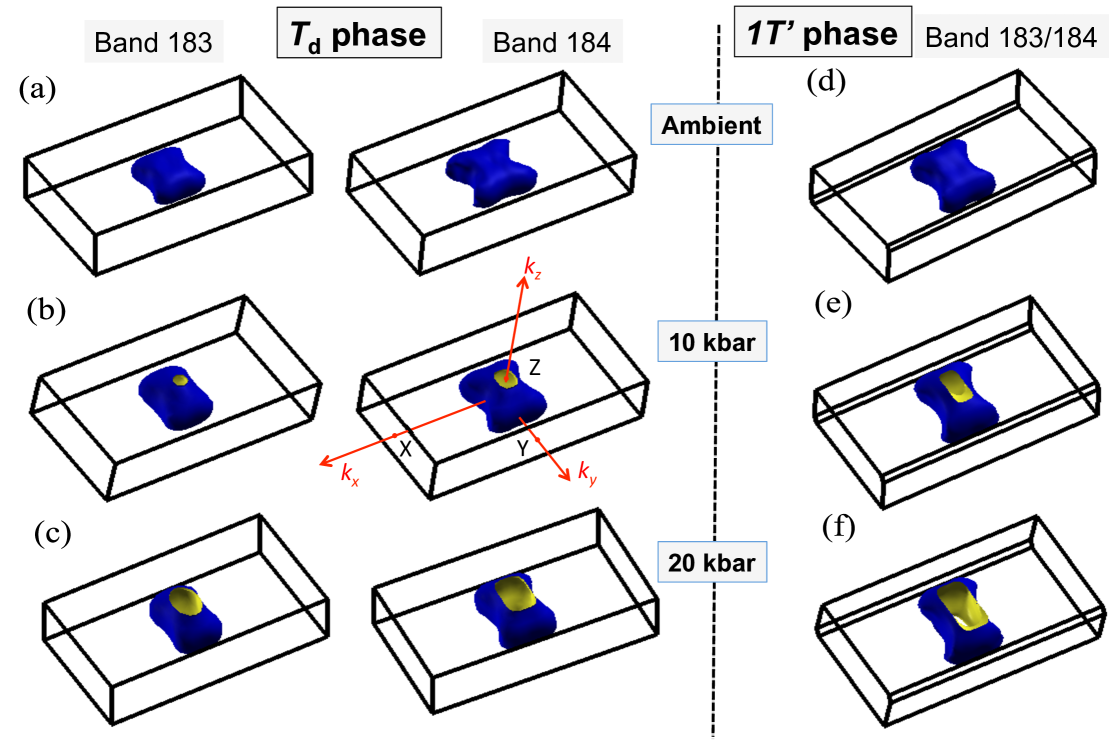
The curvature of the hole pockets can be varied by applying hydrostatic pressure. To see how the curvature evolves, we perform calculations at 10 kbar and 20 kbar, as shown in Figs. 2(b),(c) and (e),(f). Although MoTe2 is in the phase at 20 kbar Hu2019 , calculations using the space group of both the and phases were performed to theoretically investigate the curvature change with an increasing pressure. In the phase, Bands 183 and 184 are degenerate because of the restoration of the inversion symmetry. For the calculations in both and phases, the hole pocket(s) expand in size with an increasing pressure, and they progressively touch the Brillouin zone boundary along the direction. Hence, we conclude that the Fermi surfaces become more cylindrical and the curvature along the direction decreases under pressure.
The effect of the Fermi surface curvature on quantum oscillation amplitude is usually incorporated by slicing a Fermi surface into thin slabs that are perpendicular to the magnetic field Shoenbergbook . Without loss of generality, we take . The thickness and the cross-sectional area of the slabs become and , respectively, where the axis is parallel to the axis. To get the total signal contributed by these slices, we need to integrate along :
| (1) |
where is the harmonic index and is a phase factor. Taking the extremal area to be at , and focusing only on the range of in the vicinity of the extremal area, the integral can be approximated as Shoenbergbook
| (2) |
where is the quantum oscillation frequency corresponding to the extremal area. The second derivative, which characterizes the curvature of the Fermi surface at , enters as the denominator of the prefactor. Therefore, a larger curvature will result in a smaller quantum oscillation amplitude.
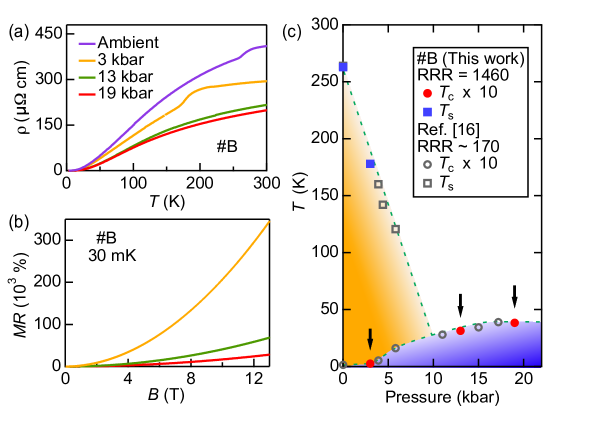
Since our DFT + calculations have established that the curvature of the hole pockets along the direction decreases under pressure, the SdH oscillation amplitudes should be enhanced. To test this hypothesis, we conduct a series of high-pressure electrical transport experiments. Figures 3(a) and (b) exhibit and the field dependence of MR at 30 mK, respectively. The rapid suppression of MR under pressure is qualitatively similar to the recent study using crystals with a lower RRR of 170 Hu2019 . However, the MR(13 T, 30 mK) at 19 kbar for the present work remains large, having a value of 28,300%, much larger than the value of 1,000% at 17 kbar in Ref. Hu2019 . From our electrical transport data, we can extract and , which are shown in Fig. 4(c). The pressure dependence of and from samples with RRR of 170 are also included, which agree nicely with the present work. The overall smooth variation of and rule out any strong dependence on RRR.
The large MR offers the prospect of detecting quantum oscillations under pressure. Clear SdH oscillations can be seen at 3 kbar and 13 kbar, as displayed in Figs. 4(a) and (b). The pressure-dependent SdH spectra at 30 mK with are shown in Fig. 4(c). The ambient pressure SdH spectrum is the same as the one shown in Fig. 1(d). We stress that the pressure work was conducted on sample B, which is from the same batch as A used for ambient pressure work. At 3 kbar, several peaks below 1000 T can be resolved, and an intense peak at 309 T is most likely related to T observed at ambient pressure. We do not observe any peak higher than 1000 T at 3 kbar, as can be seen from the inset. This can be understood because sample #B has a lower signal-to-noise ratio than #A. In this low pressure range, the high-frequency oscillations are still weak and they can easily be buried in the noise.
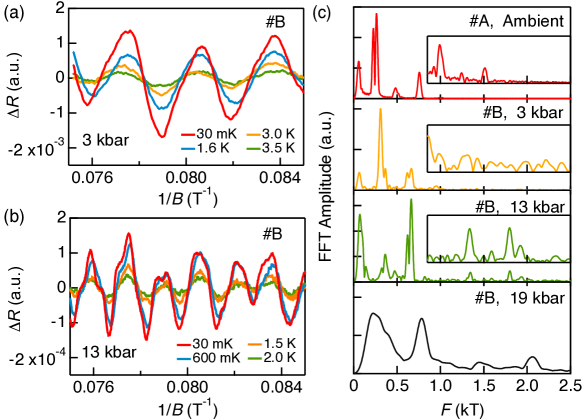
Upon increasing pressure to 13 kbar, an interesting SdH spectrum is obtained. While the strongest peak continues to shift toward the higher frequency end, two new peaks appear: one at 1342 T and another at 1798 T. The frequency of the 1342 T peak is nearly double that of the most intense peak (661 T). Furthermore, its effective mass is , which is exactly twice the effective mass associated with the 661 T peak, SUPP . Hence, the 1342 T peak is the second harmonic. However, the 1798 T peak is not the integer multiple of any peak at a lower frequency. Hence, we conclude that this peak is indeed independent. Finally, we note that the effective masses at 13 kbar are significantly larger than the ambient pressure values SUPP : is , and for the 1798 T, 324 T and 621 T peaks, respectively. The enhanced effective masses further suggest the importance of Coulomb interactions under pressure.
The observation of a SdH peak with a larger amplitude with an increasing pressure is extraordinary. Empirically, SdH amplitudes usually decrease under pressure Cai2015 ; Zhang2017 . For instance, the strongest peak at 13 kbar (661 T) is 12.5 times weaker than that at 3 kbar (309 T). However, the unusual growth of the 1798 T peak at 13 kbar can be nicely attributed to the decrease of the curvature of the hole Fermi surfaces discussed above. Furthermore, since MoTe2 is already in the phase at 13 kbar Hu2019 , Bands 183 and 184 become degenerate due to the recovered inversion symmetry. The multiplicity is expected to further enhance the quantum oscillation signals. Therefore, combining the calculations and the experimental results, we conclude that the 1798 T peak at 13 kbar is related to the 988 T and 1513 T peaks at ambient pressure, which further strengthens our conclusion of detecting hole pockets.
At 19 kbar, the SdH oscillations fade away. Similar weakening of the SdH amplitudes was also reported in WTe2 Cai2015 , which can be intuitively attributed to pressure inhomogeneity and the suppression of MR. Fortunately, with an average over 16 field sweeps under identical experimental conditions, several broad peaks can be resolved. Although the weak SdH signals render it impossible to reliably obtain the effective mass, the spectrum is useful for the discussion of pressure evolution of SdH frequencies. From the spectrum, we identify three peaks located at 780 T, 1450 T, and 2066 T. The first two peaks can be taken as the fundamental and its harmonic. Given the relatively small pressure difference between 19 kbar and 13 kbar, and the similar structure in the SdH spectra, the 2066 T is naturally recognized to be related to the 1798 T peak at 13 kbar. In fact, linearly extrapolating these frequencies to ambient pressure would give a peak at 1217 T, which is in between the two frequencies from the hole Fermi surfaces at ambient pressure. This is expected since the degeneracy is lifted due to the absence of inversion symmetry in the ambient pressure phase.
Taking into account all SdH data collected, the pressure evolution of our data is consistent with the expectation from DFT+ calculations (Fig. 2). Thus, the pressure studies lend further support to our central claim on the detection of the hole Fermi surfaces in MoTe2. As pointed out by Aryal and Manousakis Aryal2019 , the inclusion of does not annihilate all Weyl points in the phase: at least one pair of type-II Weyl points very close to the Fermi level survive. As a corollary, our work might have resolved a lingering issue concerning the relevance of Weyl physics in -MoTe2 Rhodes2017 , and reestablishes -MoTe2 as a candidate of type-II Weyl semimetal.
In summary, we have used the Shubnikov-de Haas effect to probe the electronic structure of MoTe2. We successfully detected the large hole pockets with frequencies of 988 T and 1513 T at ambient pressure, which is in the phase. The cyclotron effective masses associated with these frequencies are and , respectively, indicating a non-negligible correlation effect. At 13 kbar, in the phase, we detected one frequency at 1798 T, whose amplitude experienced an enhancement relative to that at 3 kbar. This peak shifts to a higher value at 19 kbar. This trend is consistent with the predictions of the DFT + calculations, showing that the hole pockets expand under pressure, accompanied by a decreasing curvature along the direction. Thus, at ambient pressure, the large Fermi surface curvature in the vicinity of the extremal orbit and the large effective mass make it challenging to detect the hole pockets. To overcome this challenge, high quality single crystals and a careful optimization of the experimental conditions are indispensable. Finally, as previous DFT + calculations Aryal2019 show that at least one pair of type-II Weyl points is preserved, the consistency between our results and the calculations serves to reestablish -MoTe2 as a candidate of type-II Weyl semimetal.
Acknowledgements.
We acknowledge technical assistance from Stanley W. Tozer, Scott A. Maier and Bobby Joe Pullum for high field experiments at NHMFL Tallahassee, and fruitful discussions with Qun Niu, Yuk Tai Chan, Ece Uykur, Xi Dai, Kin On Ho, Xiaoyu Guo and Shingo Yonezawa. This work is supported by Research Grants Council of Hong Kong (CUHK 14300418, CUHK 14300117), CUHK Direct Grant (4053345, 4053299), CityU Start-up Grant (No. 9610438), JSPS KAKENHI (JP15H05884, JP18H04225, JP15H05745, JP18H01178, JP18H05227, JP15K05178, JP16F16028 and JP19H01839). A portion of this work was performed at the National High Magnetic Field Laboratory, which is supported by the National Science Foundation Cooperative Agreement No. DMR-1644779 and the State of Florida.References
- (1) B. Yan and C. Felser, Annu. Rev. Condens. Matter Phys. 8, 337 (2017).
- (2) Y. Sun, S.-C. Wu, M. N. Ali, C. Felser, and B. Yan, Phys. Rev. B 92, 161107 (2015).
- (3) A. A. Soluyanov, D. Gresch, Z. Wang, Q. Wu, M. Troyer, X. Dai, and B. A. Bernevig, Nature 527, 495 (2015).
- (4) Y. Wu, D. Mou, N. H. Jo, K. Sun, L. Huang, S. L. Bud’ko, P. C. Canfield, and A. Kaminski, Phys. Rev. B 94, 121113 (2016).
- (5) K. Deng, G. Wan, P. Deng, K. Zhang, S. Ding, E. Wang, M. Yan, H. Huang, H. Zhang, Z. Xu, J. Denlinger, A. Fedorov, H. Yang, W. Duan, H. Yao, Y. Wu, S. Fan, H. Zhang, X. Chen, and S. Zhou, Nat. Phys. 12, 1105 (2016).
- (6) J. Jiang, Z. K. Liu, Y. Sun, H. F. Yang, C. R. Rajamathi, Y. P. Qi, L. X. Yang, C. Chen, H. Peng, C.-C. Hwang, S. Z. Sun, S.-K. Mo, I. Vobornik, J. Fujii, S. S. P. Parkin, C. Felser, B. H. Yan, and Y. L. Chen, Nat. Commun. 8, 13973 (2017).
- (7) Z. Wang, D. Gresch, A. A. Soluyanov, W. Xie, S. Kushwaha, X. Dai, M. Troyer, R. J. Cava, and B. A. Bernevig, Phys. Rev. Lett. 117, 056805 (2016).
- (8) N. Aryal and E. Manousakis, Phys. Rev. B 99, 035123 (2019).
- (9) D. H. Keum, S. Cho, J. H. Kim, D.-H. Choe, H.-J. Sung, M. Kan, H. Kang, J.-Y. Hwang, S. Kim, H. Yang, K. J. Chang, and Y. H. Lee, Nat. Phys. 11, 482 (2015).
- (10) Q. Zhou, D. Rhodes, Q. R. Zhang, S. Tang, R. Schönemann, and L. Balicas, Phys. Rev. B 94, 121101 (2016).
- (11) S. Lee, J. Jang, S.-I. Kim, S.-G. Jung, J. Kim, S. Cho, S. W. Kim, J. Y. Rhee, K.-S. Park, and T. Park, Sci. Rep. 8, 13937 (2018).
- (12) F. C. Chen, H. Y. Lv, X. Luo, W. J. Lu, Q. L. Pei, G. T. Lin, Y. Y. Han, X. B. Zhu, W. H. Song, and Y. P. Sun, Phys. Rev. B 94, 235154 (2016).
- (13) Y. Qi, P. G. Naumov, M. N. Ali, C. R. Rajamathi, W. Schnelle, O. Barkalov, M. Hanfland, S.-C. Wu, C. Shekhar, Y. Sun, V. Süß, M. Schmidt, U. Schwarz, E. Pippel, P. Werner, R. Hillebrand, T. Förster, E. Kampert, S. Parkin, R. J. Cava, C. Felser, B. Yan, and S. A. Medvedev, Nat. Commun. 7, 11038 (2016).
- (14) H. Takahashi, T. Akiba, K. Imura, T. Shiino, K. Deguchi, N. K. Sato, H. Sakai, M. S. Bahramy, and S. Ishiwata, Phys. Rev. B 95, 100501 (2017).
- (15) C. Heikes, I.-L. Liu, T. Metz, C. Eckberg, P. Neves, Y. Wu, L. Hung, P. Piccoli, H. Cao, J. Leao, J. Paglione, T. Yildirim, N. P. Butch, and W. Ratcliff, Phys. Rev. Mater. 2, 074202 (2018).
- (16) Y. J. Hu, Y. T. Chan, K. T. Lai, K. O. Ho, X. Guo, H.-P. Sun, K. Y. Yip, D. H. L. Ng, H.-Z. Lu, and S. K. Goh, Phys. Rev. Mater. 3, 034201 (2019).
- (17) A. Crepaldi, G. Autès, A. Sterzi, G. Manzoni, M. Zacchigna, F. Cilento, I. Vobornik, J. Fujii, P. Bugnon, A. Magrez, H. Berger, F. Parmigiani, O. V. Yazyev, and M. Grioni, Phys. Rev. B 95, 041408(R) (2017).
- (18) A. Tamai, Q. Wu, I. Cucchi, F. Bruno, S. Riccò, T. Kim, M. Hoesch, C. Barreteau, E. Giannini, C. Besnard, A. Soluyanov, and F. Baumberger, Phys. Rev. X 6, 031021 (2016).
- (19) A. P. Weber, P. Rüßmann, N. Xu, S. Muff, M. Fanciulli, A. Magrez, P. Bugnon, H. Berger, N. C. Plumb, M. Shi, S. Blügel, P. Mavropoulos, and J. H. Dil, Phys. Rev. Lett. 121, 156401 (2018).
- (20) D. Rhodes, R. Schönemann, N. Aryal, Q. Zhou, Q. R. Zhang, E. Kampert, Y.-C. Chiu, Y. Lai, Y. Shimura, G. T. McCandless, J. Y. Chan, D. W. Paley, J. Lee, A. D. Finke, J. P. C. Ruff, S. Das, E. Manousakis, and L. Balicas, Phys. Rev. B 96, 165134 (2017).
- (21) F. C. Chen, X. Luo, J. Yan, Y. Sun, H. Y. Lv, W. J. Lu, C. Y. Xi, P. Tong, Z. G. Sheng, X. B. Zhu, W. H. Song, and Y. P. Sun, Phys. Rev. B 98, 041114 (2018).
- (22) X. Luo, F. C. Chen, J. L. Zhang, Q. L. Pei, G. T. Lin, W. J. Lu, Y. Y. Han, C. Y. Xi, W. H. Song, and Y. P. Sun, Appl. Phys. Lett. 109, 102601 (2016).
- (23) S. Zhong, A. Tiwari, G. Nichols, F. Chen, X. Luo, Y. Sun, and A. W. Tsen, Phys. Rev. B 97, 241409 (2018).
- (24) I.-L. Liu, C. Heikes, T. Yildirim, C. Eckberg, T. Metz, S. Ran, W. Ratcliff, J. Paglione, and N. P. Butch, arXiv:1905.02277 .
- (25) A. Chen and M. Franz, Phys. Rev. B 93, 201105 (2016).
- (26) A. Chen, D. I. Pikulin, and M. Franz, Phys. Rev. B 95, 174505 (2017).
- (27) N. Xu, Z. Wang, A. Magrez, P. Bugnon, H. Berger, C. Matt, V. Strocov, N. Plumb, M. Radovic, E. Pomjakushina, K. Conder, J. Dil, J. Mesot, R. Yu, H. Ding, and M. Shi, Phys. Rev. Lett. 121, 136401 (2018).
- (28) See Supplemental Material for (i) method of single crystal growth, (ii) method of DFT calculations, (iii) high magnetic field data on C up to 36 T from NHMFL Tallahassee, (iv) angular dependence of SdH oscillations of A and the comparison with calculated frequencies, (v) Lifshitz-Kosevich analysis for various quantum oscillation frequencies, (vi) a table listing all effective masses extracted, and (vii) a comparison of the MR, SdH spectra, and carrier mobilities of several high-RRR and low-RRR samples. The Supplemental Material includes Refs. Schwarz2003 ; Perdew1996 ; Rourke2012 .
- (29) K. Schwarz and P. Blaha, Comput. Mater. Sci. 28, 259 (2003).
- (30) J. P. Perdew, K. Burke, and M. Ernzerhof, Phys. Rev. Lett. 77, 3865 (1996).
- (31) P. M. C. Rourke and S. R. Julian, Comput. Phys. Commun. 183, 324 (2012).
- (32) D. Shoenberg, Magnetic oscillations in metals (Cambridge University Press, 2009).
- (33) P. L. Cai, J. Hu, L. P. He, J. Pan, X. C. Hong, Z. Zhang, J. Zhang, J. Wei, Z. Q. Mao, and S. Y. Li, Phys. Rev. Lett. 115, 057202 (2015).
- (34) J. L. Zhang, C. Y. Guo, X. D. Zhu, L. Ma, G. L. Zheng, Y. Q. Wang, L. Pi, Y. Chen, H. Q. Yuan, and M. L. Tian, Phys. Rev. Lett. 118, 206601 (2017).