Heartbeat Classification in Wearables Using Multi-layer Perceptron and Time-Frequency Joint Distribution of ECG
Abstract.
Heartbeat classification using electrocardiogram (ECG) data is a vital assistive technology for wearable health solutions. We propose heartbeat feature classification based on a novel sparse representation using time-frequency joint distribution of ECG. Fundamental to this is a multi-layer perceptron, which incorporates these signatures to detect cardiac arrhythmia. This approach is validated with ECG data from MIT-BIH arrhythmia database. Results show that our approach has an average 95.7% accuracy, an improvement of 22% over state-of-the-art approaches. Additionally, ECG sparse distributed representations generates only 3.7% false negatives, reduction of 89% with respect to existing ECG signal classification techniques.
1. Introduction
With the growing maturity of semiconductor process technology, miniature sensors are increasingly being integrated into wearable devices, facilitating vital health monitoring of humans. One important sensor in this context is the electrocardiogram (ECG) sensor, recording electrical activities associated with the human heart. ECG signals are useful to detect (1) cardiac arrhythmia, related to abnormal heart rhythms; (2) ischemia, related to poor blood flow to the heart muscles, (3) heart abnormalities such as enlarged heart; and (4) past heart attacks. In this paper, we focus on accurate classification of heartbeats leading to accurate detection of cardiac arrhythmia, which is a key technology enabler for wearable health solutions.
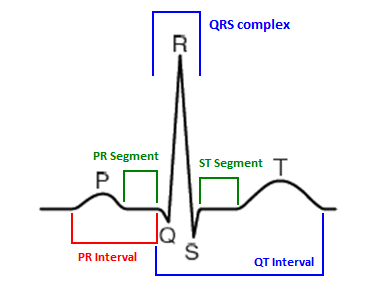
Figure 1 shows the QRS complex in a ECG signal. This corresponds to the depolarization of the left and the right ventricles of a human heart. The P, Q, R, S and T waves occur in quick succession as shown in the figure. According to the publicly available ECG database released for cardiac arrhythmia (MIT-BIH arrhythmia database 1), heartbeats can be classified into 23 different categories such as normal beats, atrial premature beats, superventicular escape beats, etc. based on the relative position and shape of these waves. However, according to the ANSI/AAMI/ISO EC57:1998/(R)2008 (American National Standard on testing and reporting performance results of cardiac rhythm and ST-segment measurement algorithms) 2, only five categories are sufficient – (1) normal beats, (2) superventricular beats, (3) ventricular beats, (4) fusion beats and (5) unclassified beats. Additionally, arrhythmia detection is a direct function of these five heartbeat classes. The arrhythmia detection problem is therefore reduced to accurate classification of heartbeat classes. Although our approach considers all 23 classes, the classification accuracy is improved when a classifier is trained using only these 5 required classes.
Significant research have been conducted recently to autonomously classify ECG heartbeats (QRS peaks) 3, 4, 5, 6, 7, 8, 9, 10, 11, 12 (Section 2 provides details of these approaches.). These studies have the following limitations that we address in this work. First, some of these studies are based on using designer specified deterministic QRS features, which in some cases can be incomplete. Machine learning provides a framework for automatic extraction of hidden features from ECG signals and is therefore gaining increasing popularity in this community. Second, existing machine learning based approaches use either time samples or frequency components for classification. We show that a time-frequency joint distribution captures time-varying frequency components, which is critical in anomaly detection of non-stationary and non-Gaussian signals such as speech and ECG. Third, most works fail to analyze the impact of noise on heartbeat classification accuracy, which is important, as noise from data acquisition systems are unavoidable.
In this paper we propose a two-phase approach to real-time heartbeat classification. Fundamental to this is an offline phase (phase I) that uses time-frequency joint distribution of QRS complexes and convert it into sparse distributed signatures that form the basis of classification using multi-layer perceptron. The trained classifier is then used online (phase II) to classify live ECG heartbeats detected using Pan & Tompkin’s Algorithm13. Experiments conducted with the standard MIT-BIH arrhythmia database show that our approach is able to classify heartbeats with 80.7% – 100% accuracy (average 95.7%) for all heartbeat classes. Additionally, the proposed ECG sparse distributed signatures have high noise tolerance (by average 133%) and low false negatives of only 3.7%, an average 89% lower compared to existing ECG representations.
Contributions: Following are our key contributions.
-
•
a two-phase approach for autonomous and real-time heartbeat classification;
-
•
a time-frequency joint distribution based sparse distributed representation (signature) for ECG signals;
-
•
a multi-layer perceptron-based classifier to classify these signatures; and
-
•
noise analysis of the proposed approach with Additive White Gaussian Noise.
The remainder of this paper is organized as follows. Related works are discussed in Section 2. The proposed two-phase approach is discussed in Section 3 and the problem formulation in Section 4. Results are presented in Section 5 and conclusions in Section 6.
2. Related works
Existing studies on heartbeat classification can be categorized into – (1) classification using deterministic features and (2) classification using machine learning. Autonomous classification using deterministic heartbeat features have received research attention with the recent advances and wide-spread use of wearable devices such as the ECG band and smart watch. In 3, heartbeats are classified using ECG morphology, heartbeat intervals, and RR-intervals, extracted from ECG signals. This model is extended in 4 with five additional features and in 5 with ECG signal amplitude difference as a key feature. Although these techniques are based on features that are clinically understood, in some cases these can be incomplete. Supervised machine learning in the form of classifiers are emerging as a popular alternative to the classical deterministic approaches due to the ability to autonomously identify and represent hidden features extracted from ECG signals. In 7, support vector machine is used to classify ECG signals. A deep neural network based classifier is used as an alternative in 8. Other alternatives include the random forest approach of 9 and the decision tree approach of 10. All these approaches use ECG time samples. There are also some studies using ECG frequency components. In 11, coefficients of discrete wavelet transform are used for classification using a neural network. In 12, ECG features are extracted using discrete Fourier transform of ECG time samples. As discussed in Section 1, none of these approaches consider time variation of the frequency components of ECG signals, which is essential to identify anomalies such as arrhythmia detection.
3. Proposed Approach
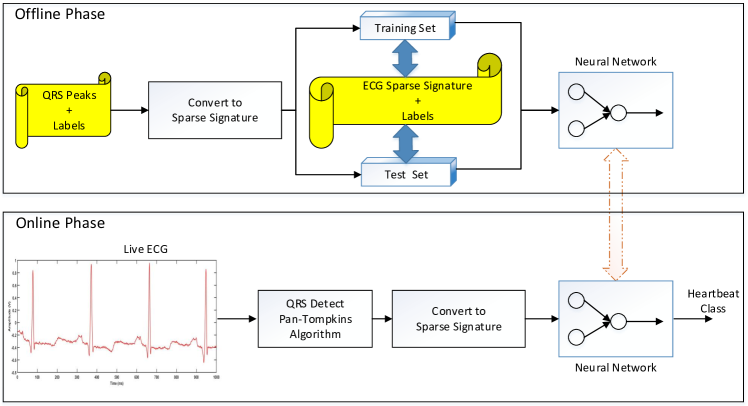
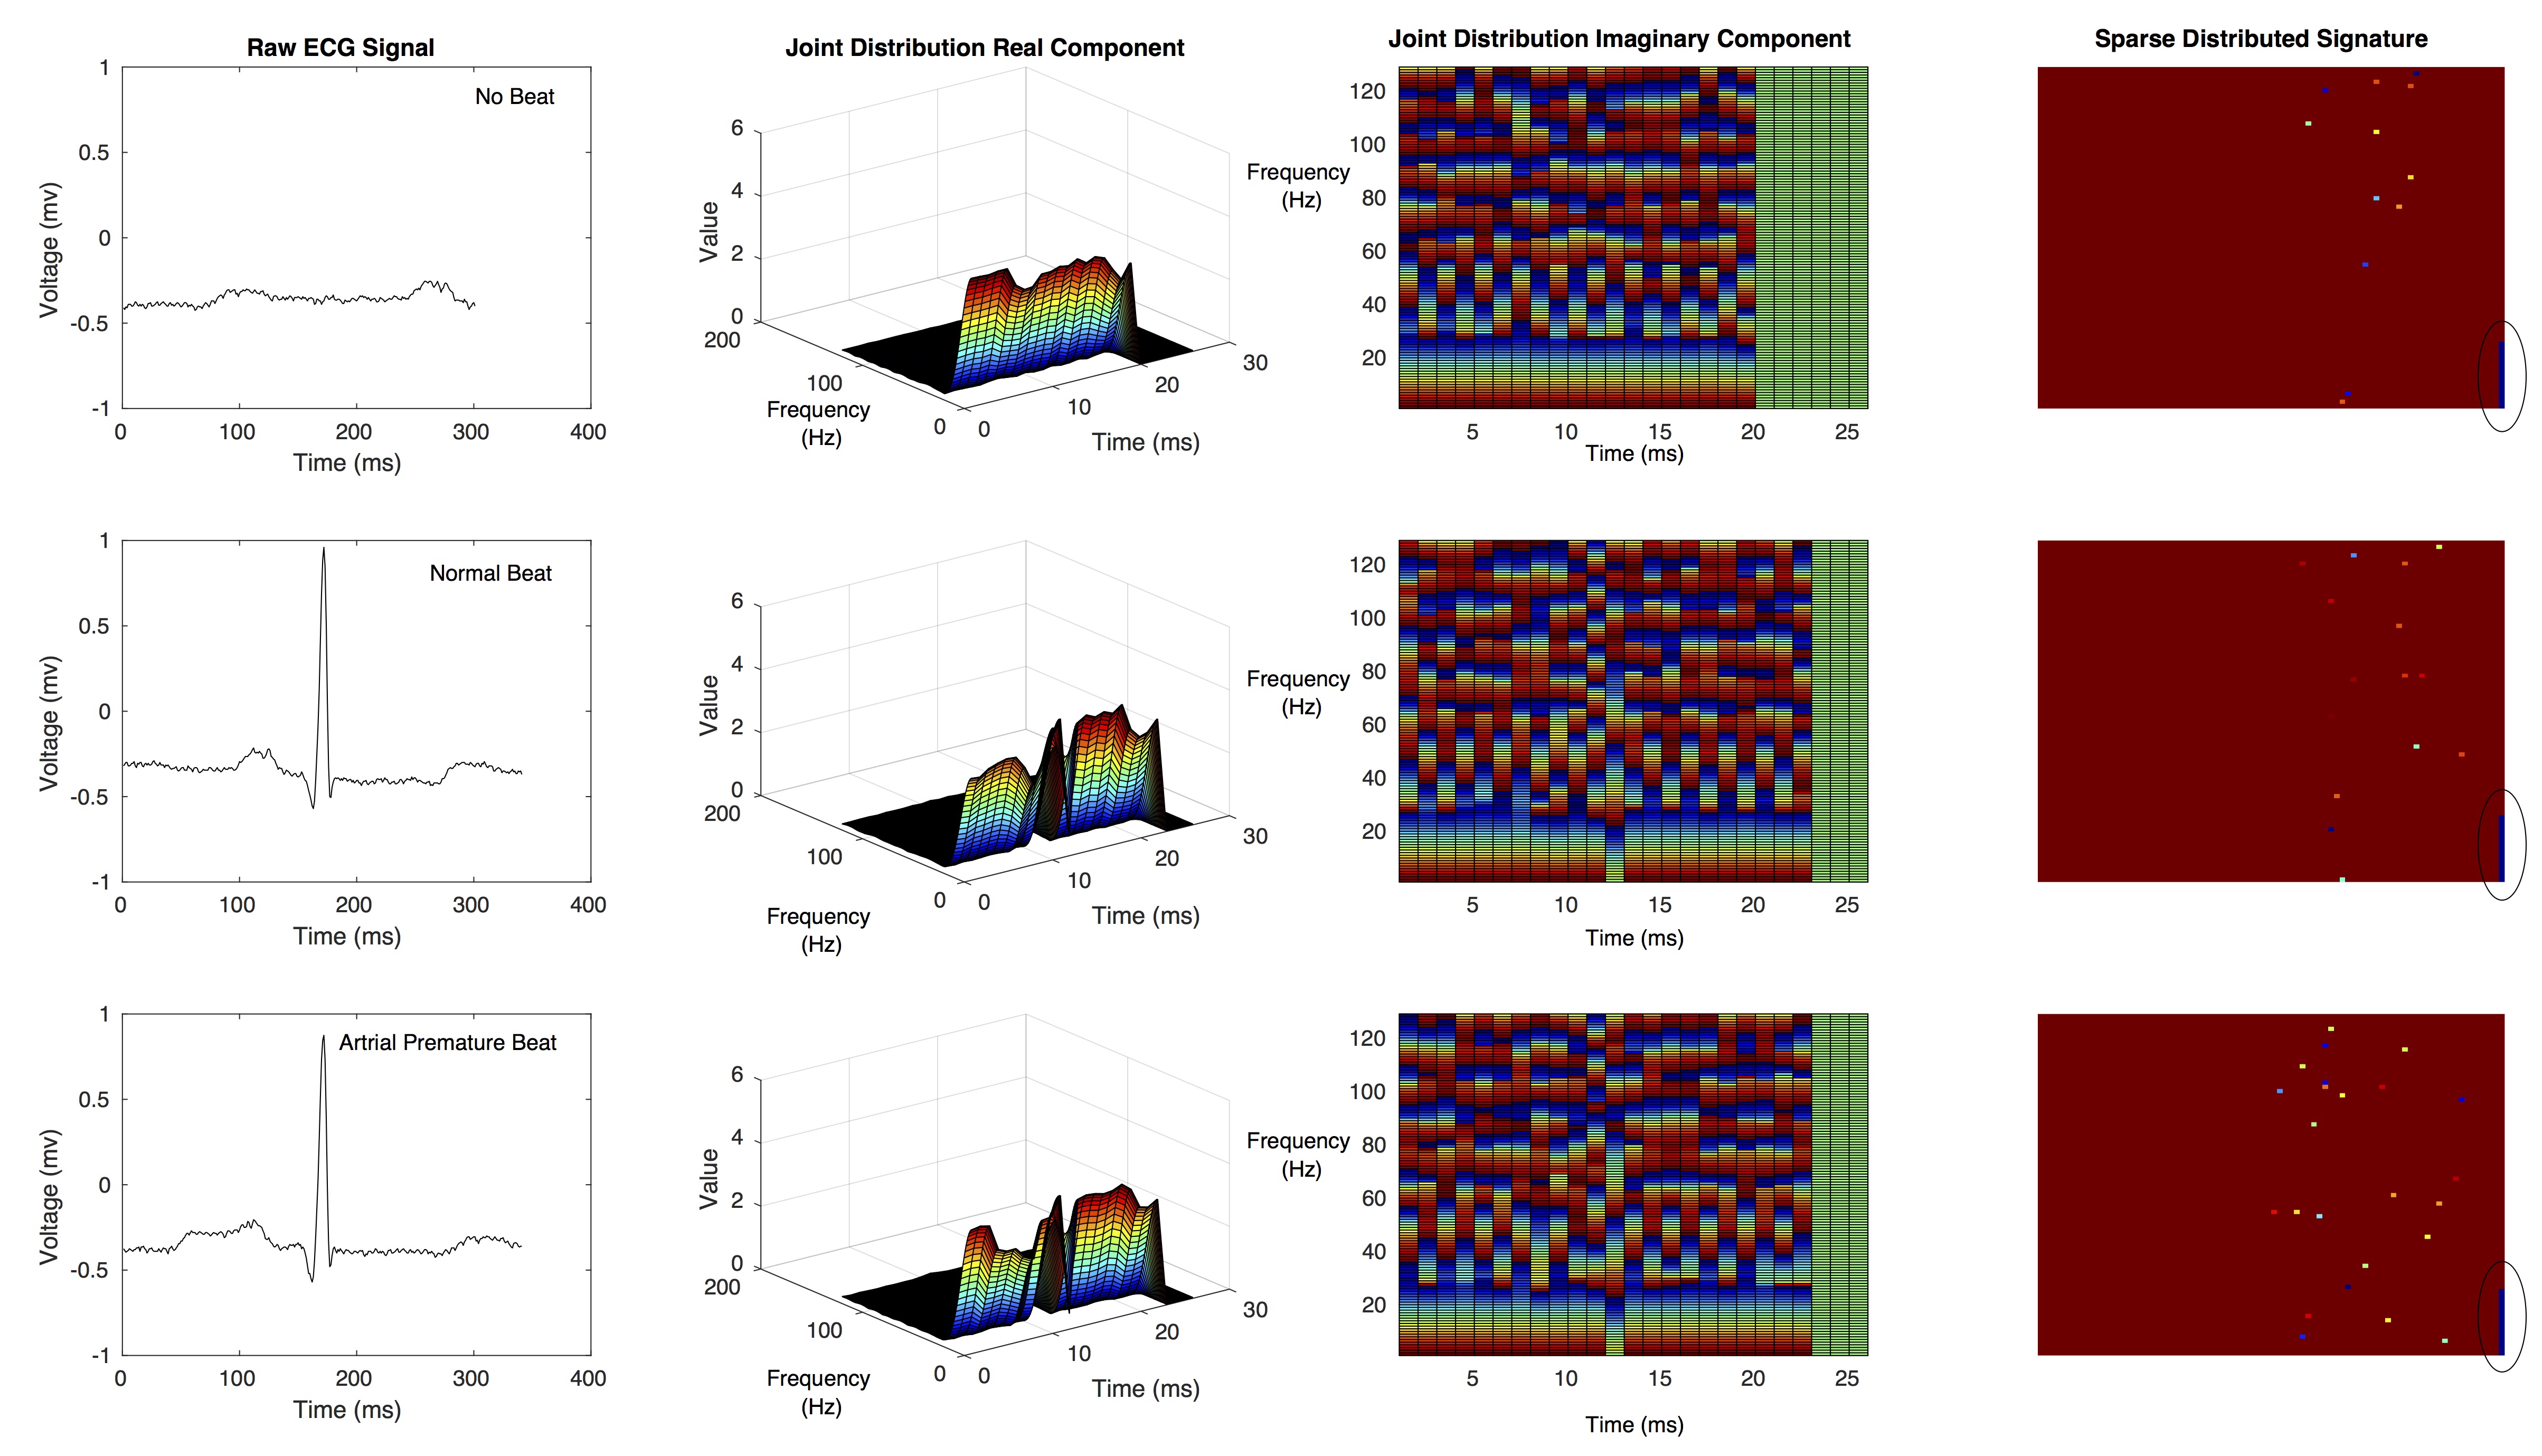
Figure 2 outlines our proposed approach, comprising of an offline training phase followed by a online phase for real-time heartbeat classification. The offline training phase consists of training a deep neural network using labeled QRS peaks from the MIT-BIH arrhythmia database 1. Each QRS peak is first transformed into its time-frequency representation. The ECG signal together with its real and imaginary components of time-frequency joint distribution are plotted in Figure 3 for three scenarios – (1) No Beat, (2) Normal Beat and (3) Atrial Premature Beat. As seen from Figure 3, the real and imaginary plots differ from each other for all three scenarios indicating the significance of both these components. We propose to combine these components to form unique signatures, which are shown on the rightmost subplots of Figure 3. These ECG signatures together with their original labels are then used for training the neural network as shown in Figure 2.
The offline training phase is carried out on nvidia GPU using python machine learning library (theano 14). The classifier used in this case is the multi-layer perceptron (MLP) with error back propagation. This choice is due to the fact that MLP are computationally less complex (important for real-time use), yet powerful tool and can be easily ported on a neuromorphic hardware 15. Once trained, the neural network is validated using a test set. A design space exploration is then performed to determine dimensions of the neural network (hidden layers, number of neurons, etc). Online phase of the proposed approach uses ECG time samples to first detect QRS peaks using Pan & Tompkins Algorithm 13. Detected peaks are then converted into ECG signatures and are classified using the trained neural network. This online phase can also be integrated within a ECG acquisition system 16, 17.
4. Problem Formulation
4.1. ECG Sparse Distributed Signatures
The classical Fourier analysis assumes that signals are of infinite duration or periodic in nature. However, non-stationary signals such as the ECG and speech are of short duration (transient), and change substantially over this duration. To accurately capture time varying frequency components of these transient signals, time-frequency joint distributions (such as short-time Fourier transform and wavelet transform) are frequently used. We use short-time Fourier transform of ECG signals due to its real-time properties.
The short-time Fourier transform of a discrete-time signal is given by the following equation 18
| (1) |
where, is the analysis window, which is narrow in time and frequency, and is normalized such that . This equation is similar to the classical Fourier transform, except that is now a function of both time and frequency, and represents only a local behavior of as viewed through the sliding window . Using the real and the imaginary components, we create a signature as follows.
| (2) |
where is a transformation of ; and are respectively, the real and the imaginary components of (Equation 1); and is the padded zero component, which is introduced for future extension of the approach to incorporate additional parameters. The signature generated using the short-time Fourier transform components are shown in the fourth subplot of Figure 3, where the unused padded components (bottom right corner in the figure) are indicated with circles. Each signature is a matrix with only few elements having values above a certain threshold (sparsity %). These elements are shown as different color dots for each ECG sparse distributed signature. The position of these high value elements in the matrix distinguishes one signature from another uniquely, resulting in high classification accuracy and high noise tolerance 19 (see Section 5).
4.2. MLP Classifier
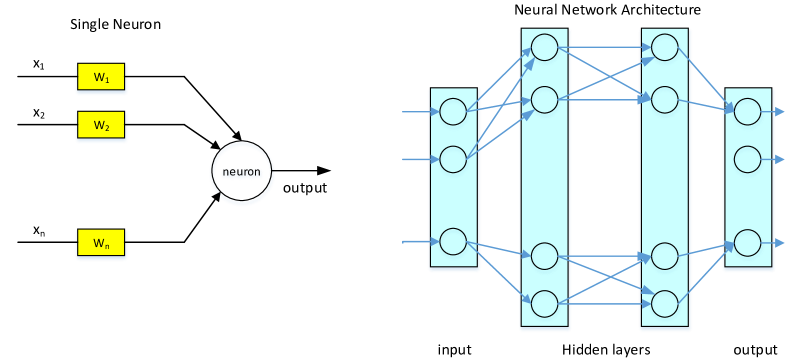
An artificial neural network is a computing paradigm inspired by the biological computation of the brain. It comprises of processing elements (neurons) working in unison to solve a specific problem. A simple artificial neuron is shown in Figure 4. It computes the weighted sum of its inputs (from external world or from other neurons). If this sum is greater than a threshold, the neuron is said to fire (i.e., produces an output). This output is then communicated to external world or connected to the input of another neuron. A typical feed-forward neural network is shown on the right side of Figure 4. This consists of an input layer, one or more hidden layers, and an output layer. The number of neurons in the input layer is equal to the dimensions (also called features) of the input applied to this neural network. We use ECG sparse distributed signatures as input to the neural network and therefore, the number of input layer neurons is . The number of hidden layers and neurons per hidden layer are configurable and determines the training time and accuracy of classification. Finally, the number of neurons in the output layer is same as the number of heartbeat classes. It is to be noted that conceptually, the deep layers of a neural network represents hierarchical and non-linear combination of features detected from the input. Thus, instead of hand coding essential features, neural network autonomously selects (and combines) features resulting in high classification accuracy. This justifies our choice of neural networks for heartbeat classification.
Neural networks have two modes of operation – training and testing, facilitating supervised learning. In the training mode, a neural network works with a set of inputs (ECG sparse distributed signatures) and their known outputs (QRS labels). In this mode, weights (also called synaptic weights) of the network are adjusted to minimize the error between the expected and actual output. In the testing mode, the network output is evaluated for an unknown input. Back propagation algorithm 20 is one of the most popular approaches for supervised learning in a neural network.

4.3. QRS Detection
A real-time implementation of Pan & Tompkin’s algorithm is proposed in 13. This is shown as a flow chart in Figure 5. It detects QRS complexes based on the slope, amplitude and width of ECG lead II signals. The digitized signal from an acquisition system 16 is first processed using a band-pass filter, which is a cascaded lowpass and highpass filter. The purpose of this filter is to reduce noise in ECG signals (from muscle contraction-expansion and T-wave interference) by matching the spectrum of average QRS complexes. Output of the bandpass filter is processed using a five point differentiator to extract information on the QRS complex and eliminate baseline drift effects. The next operation is squaring, which is a nonlinear transformation of the signal and serves two purposes – (1) makes all data positive and (2) emphasize (and attenuate) high (and low) frequency components of the signal. The final transformation is the moving average filtering, which smooths the signal and performs moving window integration of 150ms.
5. Results and Discussions
We validated our approach using the MIT-BIH Arrhythmia Database 1 (part of Physionet Database). Offline phase of our approach is implemented using python: short-time Fourier transform using specgram of python-matplotlib; and neural network training using lasagne of python-theano14. There are 23 heartbeat classes (provided as annotations in 1). So the output layer of the neural network consists of 23 neurons. The training set is composed of 6500 labeled QRS complexes selected randomly from 120K QRS complexes for 48 patients in the database, with representatives from every classes. The test set is composed of all 120K QRS complexes (except the ones used for the training set). These test QRS complexes are represented from all 48 patients and 23 classes. Each ECG QRS complex is a sparse distributed signature of 82x82 matrix and therefore, the number of neurons in the input layer is 6724. The design space exploration determines the number of hidden layers, neurons per hidden layer and synaptic weights on nvidia GeForce GTX 970 GPU @ 1.05GHz. The onlne phase is performed on Hashwell CPU.
5.1. Classification Accuracy
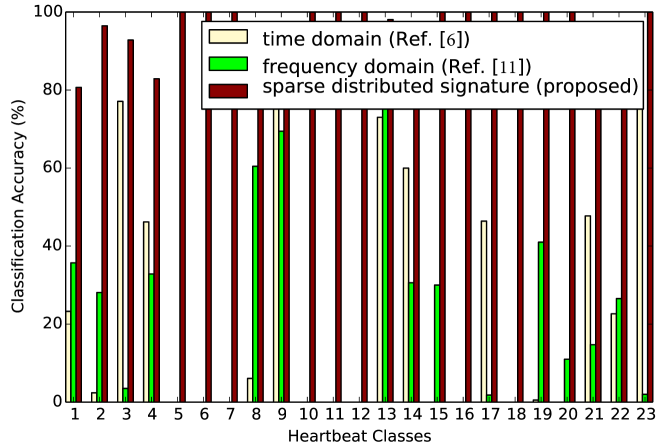
Figure 6 reports performance of our approach for 23 heartbeat classes. For comparison, classification results using ECG time samples 6 and ECG frequency components 11 are also reported in the plot. As can be seen from this figure, using time samples has higher classification accuracy than using frequency components for some classes such as 3, 14, 17, 21 & 23. For these heartbeat classes, amplitude of ECG signals is sufficient for classification; frequency components convey little or no information as discussed in 10. For other classes such as 2, 8, 15, 19 & 20, frequency domain representation carries more information needed for classification. Compared to these approaches, our approach not only captures both time and frequency representations, but also time variations of the frequency components in the sparse representation, leading to higher classification accuracy for all classes. The accuracy obtained using our approach is 80.7% to 100% (average 95.7%), 15% – 70% (average 46%) improvement over 11 and 2.5% – 54.4% (average 22%) improvement over 6.
| Heartbeat Class | Training with 23 classes | Training with 5 classes |
|---|---|---|
| normal | 91.7% | 95.1% |
| superventricular | 95.3% | 95.7% |
| ventricular | 98.9% | 99.5% |
| fusion | 89.8% | 93.4% |
| unclassified | 86.8% | 91.2% |
Table 1 reports results for the five required classes for two scenarios – (1) when the classifier is trained with all 23 classes (column 2) and (2) when the classifier is trained with only 5 classes (column 3). As can be seen from this table, training with 5 classes improves accuracy by 0.4% – 5.1% (average 2.8%) as compared to training with all 23 classes. These results reconfirm that using ECG sparse distributed signatures result in high classification accuracy, which can be improved further by training with only the heartbeat classes required for detecting a specific heart abnormality. Thus the approach proposed in this work is generic and can be extended using disease-specific learning.
5.2. Choice of ECG Preprocessing
Table 2 reports results justifying our choice of ECG sparse distributed signatures for classification. We report 4 numbers in the table – average accuracy for 48 patients in the database (column 2); average accuracy for 23 heartbeat classes (column 3); average false positives (column 4); and average false negatives (column 5). In this context, false positive refers to a scenario where a heartbeat is actually normal (class 1) but the classifier classifies it as abnormal, belonging to another class (classes 2 – 23). A false negative is a scenario in which a heartbeat belongs to a specific class and the classifier classifies this to be of different class. It is to be noted that a false positive implies false alarm, while a false negative refers to miss detection. Therefore, lower are the false positives (and negatives), better is the quality.
| Techniques | Patient (Avg.) | Type (Avg.) | False +ve | False -ve |
|---|---|---|---|---|
| Wavelet Transform12 | 58.4% | 57.4% | 23.8% | 43.5% |
| Short-time Fourier Transform | 77.1% | 65.5% | 18.5% | 35.3% |
| Numenta SDR 21 | 80.3% | 85.1% | 21.5% | 15.6% |
| Our Sparse Signature | 83.7% | 95.7% | 19.3% | 3.7% |
We compare our ECG sparse distributed signatures with (1) wavelet transform based representation 12, (2) short-time Fourier transform based representation and (3) Numenta’s sparse representation technique for ECG time sample 21. The classifier in all these scenarios are the same (i.e., multi-layer perceptron), only the input to the classifier are different according to representations used for ECG. As seen from the table, ECG sparse distributed signature-based representation has higher accuracy than the other three representations, for all heartbeat classes and also for all patients in the database. Furthermore, ECG sparse distributed signature-based representation has lower false positives than 12, but higher than using short time Fourier transform representation by only 5%. However, our approach has a much lower false negatives (3.7%), a reduction of 89% and 91% compared to the wavelet and short-time Fourier transform representations, respectively. These improvements are due to the fact that we combine the magnitude and phase of time-frequency joint distribution into sparse distributed signatures, which uniquely distinguishes QRS complexes, resulting in higher classification accuracy.
5.3. Additive White Noise Tolerance
To determine the noise tolerance of our approach, we injected random noise to the ECG signal and used our approach to classify heartbeats of this noisy ECG signal. We used Additive White Gaussian Noise (AWGN) as the basic noise model to mimic the effect of random processes associated with ECG data acquisition. Under the assumption of AWGN, let , be samples of the input vector . The relative power of the noise is described in terms of signal-to-noise ratio (in dB) per sample. Let this be . Power of the input ECG signal (without noise) is
| (3) |
The noise vector is given by
| (4) |
where, is the SNR value converted to linear scale, and is a function that generates random numbers. The noisy ECG signal is .
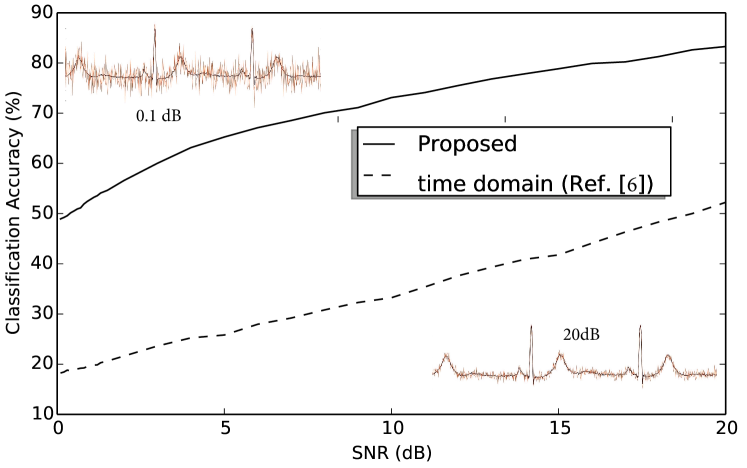
Figure 7 plots the classification accuracy of our approach, as the SNR per sample is increased from 0 to 20 dB, for patient id 106 in the database. To compare the noise tolerance, we have also plotted classification results using ECG time samples 6. As shown, the accuracy of our approach and that of 6 increases with an increase in the SNR as signal strength increasingly dominates over noise, resulting in higher classification accuracy. A similar trend is observed for all other patients in the database. Additionally, our approach has higher classification accuracy (60% – 170%, average 133% for the SNR range of 0 to 20 dB) compared to 6. This is because sparse distributed signatures can tolerate high noise than other representations.
Finally, motion artifacts represent an important class of noise for ambulatory subjects. Our initial experiments with motion compensated ECG from 22 provides a comparable accuracy with recently reported wavelet-ICA approach 23.
| Neurons | Offline | Online (real-time) at 160 MHz | ||
|---|---|---|---|---|
| Training | QRS Detect | Sparse Distributed Signature | Classification | |
| 2000 | 620.4 s | 10 s | 10.4 ms | 1.20 ms |
| 4000 | 907.9 s | 10 s | 10.4 ms | 1.70 ms |
| 6000 | 1277.9 s | 10 s | 10.4 ms | 2.42 ms |
| 8000 | 1693.3 s | 10 s | 10.4 ms | 3.06 ms |
| 10000 | 2245.4 s | 10 s | 10.4 ms | 3.97 ms |
5.4. Real-time Performance
Table 3 reports execution time for the offline training phase and three components of the online phase – the QRS detection, ECG sparse distributed signature conversion and heartbeat classification. These are reported in columns 2, 3, 4 and 5, respectively for different number of neurons. It is to be noted that the offline phase is executed on nvidia GPU and does not contribute to real-time performance. As seen from column 2, the offline training time increases exponentially with increase in the number of neurons. This is due to an exponential increase in the number of synapses, leading to an increase in the number of error computations in the back propagation algorithm. At run-time, the QRS detection algorithm takes on average 10 s to execute the steps listed in Figure 5 and are reported in column 3. The execution time to convert a QRS peak to ECG sparse distributed signature is reported in column 4 and is on average 10.4 ms. Finally, the execution time for the heartbeat classification step is reported in column 5. As shown in this column, heartbeat classification using a trained neural network increases with the number of neurons. However, the small execution time validates the real-time property of the proposed approach.
6. Conclusion
We proposed a real-time approach for classifying heartbeats to detection abnormal heart conditions such as arrhythmia. The approach is based on multi-layer perceptron classifier that uses ECG sparse distributed signatures to classify incoming ECG heartbeats into one of 23 different classes. Experiments with ECG signals from MIT-BIH arrhythmia database show that the proposed approach has a classification accuracy of an average 95.7% (22% better than state-of-the-art). Additionally, the proposed ECG sparse distributed signatures have higher noise tolerance and reduce false negatives to 3.7%, an 89% improvement over existing ECG data representation techniques.
Acknowledgements.
This work is supported in parts by EU-H2020 grant NeuRAM3 Cube (NEUral computing aRchitectures in Advanced Monolithic 3D-VLSI nano-technologies) and ITEA3 proposal PARTNER (Patient-care Advancement with Responsive Technologies aNd Engagement togetheR).References
- [1] G. B. Moody and R. G. Mark, “The impact of the MIT-BIH arrhythmia database,” IEEE Engineering in Medicine and Biology Magazine, 2001.
- [2] A. for the Advancement of Medical Instrumentation et al., “Testing and reporting performance results of cardiac rhythm and st segment measurement algorithms. american national standards institute, inc.(ansi),” Inc.(ANSI), ANSI/AAMI/ISO EC57, 2008.
- [3] P. De Chazal, M. O’Dwyer, and R. B. Reilly, “Automatic classification of heartbeats using ECG morphology and heartbeat interval features,” IEEE Transactions on Biomedical Engineering, 2004.
- [4] M. Llamedo and J. P. Martínez, “Heartbeat classification using feature selection driven by database generalization criteria,” IEEE Transactions on Biomedical Engineering, 2011.
- [5] J. Park, S. Lee, and K. Kang, “Arrhythmia detection using amplitude difference features based on random forest,” in IEEE EMBC, 2015.
- [6] V. Queiroz, E. Luz, G. Moreira, Á. Guarda, and D. Menotti, “Automatic cardiac arrhythmia detection and classification using vectorcardiograms and complex networks,” in EMBC. IEEE, 2015.
- [7] Z. Zhang, J. Dong, X. Luo, K.-S. Choi, and X. Wu, “Heartbeat classification using disease-specific feature selection,” Elsevier Computers in biology and medicine, 2014.
- [8] M. Al Rahhal, Y. Bazi, H. AlHichri, N. Alajlan, F. Melgani et al., “Deep learning approach for active classification of electrocardiogram signals,” Elsevier Information Sciences, 2016.
- [9] T. Li and M. Zhou, “ECG classification using wavelet packet entropy and random forests,” MDPI Entropy, 2016.
- [10] J. Park and K. Kang, “PcHD: Personalized classification of heartbeat types using a decision tree,” Elsevier Computers in biology and medicine, 2014.
- [11] R. J. Martis, U. R. Acharya, H. Adeli, H. Prasad, J. H. Tan et al., “Computer aided diagnosis of atrial arrhythmia using dimensionality reduction methods on transform domain representation,” Elsevier Biomedical Signal Processing and Control, 2014.
- [12] S. A. Shufni and M. Y. Mashor, “ECG signals classification based on discrete wavelet transform, time domain and frequency domain features,” in IEEE Conference on Biomedical Engineering (ICoBE), 2015.
- [13] J. Pan and W. J. Tompkins, “A real-time QRS detection algorithm,” IEEE transactions on biomedical engineering, 1985.
- [14] J. Bergstra et al., “Theano: Deep learning on GPUs with python,” in NIPS BigLearning Workshop, 2011.
- [15] G. Indiveri, F. Corradi, and N. Qiao, “Neuromorphic architectures for spiking deep neural networks,” in IEEE IEDM. IEEE, 2015, pp. 4–2.
- [16] M. Konijnenburg, S. Stanzione et al., “28.4 a battery-powered efficient multi-sensor acquisition system with simultaneous ECG, BIO-Z, GSR, and PPG,” in IEEE ISSCC, 2016.
- [17] S. Gradl, P. Kugler, C. Lohmüller, and B. Eskofier, “Real-time ECG monitoring and arrhythmia detection using Android-based mobile devices,” in IEEE EMBC, 2012.
- [18] L. B. Almeida, “The fractional fourier transform and time-frequency representations,” IEEE Transactions on signal processing, 1994.
- [19] D. L. Donoho, M. Elad, and V. N. Temlyakov, “Stable recovery of sparse overcomplete representations in the presence of noise,” IEEE Transactions on information theory, 2006.
- [20] D. Williams and G. Hinton, “Learning representations by back-propagating errors,” Nature, 1986.
- [21] S. Purdy, “Encoding data for HTM systems,” arXiv preprint arXiv:1602.05925, 2016.
- [22] V. Behravan, N. E. Glover, R. Farry, P. Y. Chiang, and M. Shoaib, “Rate-adaptive compressed-sensing and sparsity variance of biomedical signals,” in IEEE BSN, 2015.
- [23] S. Abbaspour, M. Lindén, and H. Gholamhosseini, “Ecg artifact removal from surface emg signal using an automated method based on wavelet-ica,” in International conference on wearable micro and nanotechnologies for personalized health. Sweden: Västerås, 2015, pp. 91–7.