Conductivity noise across temperature driven transitions of rare-earth nickelate heterostructures
Abstract
The metal-insulator transition (MIT) of bulk rare-earth nickelates is accompanied by a simultaneous charge ordering (CO) transition. We have investigated low-frequency resistance fluctuations (noise) across the MIT and magnetic transition of [EuNiO3/LaNiO3] superlattices, where selective suppression of charge ordering has been achieved by mismatching the superlattice periodicity with the periodicity of charge ordering. We have observed that irrespective of the presence/absence of long-range CO, the noise magnitude is enhanced by several orders with strong non-1/ ( = frequency) component when the system undergoes MIT and magnetic transition. The higher order statistics of resistance fluctuations reveal the presence of strong non-Gaussian components in both cases, further indicating inhomogeneous electrical transport arising from the electronic phase separation. Specifically, we find almost three orders of magnitude smaller noise in the insulating phase of the sample without long-range CO compared to the sample with CO. These findings suggest that digital synthesis can be a potential route to implement electronic transitions of complex oxides for device application.
I Introduction
Metal-insulator transition (MIT), observed in complex materials as a function of temperature, chemical doping, electrostatic gating, magnetic field, light, pressure, epitaxy etc., remains a topic of paramount interest over decades Imada et al. (1998); Tokura (2006). The complexity of the mechanism of MIT in rare earth nickelate series have attracted significant attentions in recent years Middey et al. (2016); Catalano et al. (2018). In the bulk form, NiO3 with = Sm, Eu, Lu, Y etc. undergoes a first order transition from an orthorhombic, metallic phase without charge ordering to a monoclinic, insulating phase with a rock-salt type charge ordering (CO) Medarde (1997); Catalan (2008). A magnetic transition (paramagnetic to -antiferromagnetic) occurs at a lower temperature. Moreover, four transitions appear simultaneously in bulk NdNiO3 and PrNiO3. In order to explain the origin of this peculiar MIT, the importance of structural transition Mercy et al. (2017), electron correlations Stewart et al. (2011), charge ordering Staub et al. (2002); Mazin et al. (2007), distribution of ligand holes Barman et al. (1994); Mizokawa et al. (2000); Park et al. (2012); Johnston et al. (2014); Subedi et al. (2015); Bisogni et al. (2016), polaron condensation Shamblin et al. (2018), Fermi surface nesting Lee et al. (2011a, b); Hepting et al. (2014) etc. have been emphasized by different types of experimental probes and theoretical methods. Interestingly, it has been demonstrated recently that a MIT without any long-range CO and structural symmetry change can be obtained in the artificial structure of NiO3 by mismatching the periodicity of the heterostructure with the periodicity of rock-salt type CO Middey et al. (2018a). Apart from the interest arising from the aspect of fundamental physics, NiO3 based heterostructures also show excellent potentials for electronics applications nno_fet ; Shi2013 ; Shi2014 ; Ha2014 ; Middey et al. (2016); Catalano et al. (2018).
The low-frequency 1/ noise is not only used for semiconductor device characterizations noisedevice , but also acts a powerful tool to probe exotic phenomena like electronic phase separation Koushik et al. (2011), structural phase transition Chandni et al. (2009), charge density wave Kundu et al. (2017), superconductor-normal state phase transition Clarke and Hsiang (1976); Babić et al. (2007) etc. The frequency dependence of the power spectral density (PSD) (described later in the text) arises due to finite relaxation of the fluctuating variable. According to the central limit theorem, the fluctuation statistics of a system is Gaussian if the fluctuators are independent of each other reif2009fundamentals . However, the presence of any correlations due to magnetic, electronic, or structural interactions in the system would result in non-Gaussian statistics of time dependent fluctuations. This information can be extracted from higher order statistics of resistance fluctuations via ‘second spectrum’ Weissman (1988); Ghosh et al. (2004). The phase transitions of SmNiO3, NdNiO3 single-crystalline films have been studied by such noise and second spectrum measurements Sahoo et al. (2014); Alsaqqa et al. (2017); Bisht et al. (2017). The extremely large magnitude of noise and second spectrum have been attributed to the coexistence of metal and insulator phases near the electronic transition temperature. Such noise study can also provide crucial information about the length scale of charge ordering as reported earlier for colossal magnetoresistive (CMR)- manganites Bid et al. (2003).
In this work, we report on resistance fluctuations across the electronic and magnetic transitions of [2uc EuNiO3/1uc LaNiO3] (2ENO/1LNO) and [1uc EuNiO3/1uc LaNiO3] (1ENO/1LNO) films (uc=unit cell in pseudo-cubic notation). 1ENO/1LNO superlattice (SL) exhibits four simultaneous transitions Middey et al. (2018a), similar to bulk NdNiO3 and PrNiO3. On the other hand, 2ENO/1LNO SL is a rare example, which undergoes a first-order MIT without any long-range CO and remains monoclinic in both metallic and insulating phases Middey et al. (2018a). We have observed the random telegraphic noise (RTN) as well as non-Gaussian component (NGC) of noise near the MIT of these films, which confirms the coexistence of spatially separated metallic and insulating phases in both samples. Importantly, we have found that the energy barrier, separating these electronic phases and the associated length scale of nanoscopic phase separation are similar in both samples. However, the noise magnitude in the insulating phase of 2ENO/1LNO SL is three-orders of magnitude smaller compared to the corresponding noise in 1ENO/1LNO SL, suggesting that the system having MIT without long-range charge ordering would be a better candidate for practical device applications. Interestingly, the higher order statistics of resistance fluctuations (quantified as second spectrum) becomes maximum near the antiferromagnetic transition temperature () of 2ENO/1LNO SL, implying certain role of -magnetic ordering in opening gap in the multi-band Fermi surface.
II Experimental details
[2uc EuNiO3/1uc LaNiO3]x12 (2ENO/1LNO) and [1uc EuNiO3/1uc LaNiO3]x18 (1ENO/1LNO) superlattices (SLs) have been grown on single crystalline NdGaO3 (110) substrate by pulsed laser interval deposition. The details of the growth conditions and characterizations can be found in Refs. Middey et al., 2018a, b, c. The resistance and noise measurements have been performed in a cryo-free 4 K system.
III Results and Discussions
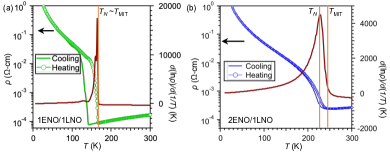
Figure 1(a) and (b) show the temperature dependent resistivity () for 1ENO/1LNO and 2ENO/1LNO films, respectively. From now onwards, we discuss the results of the heating run. As seen, 1ENO/1LNO and 2ENO/1LNO SLs undergo first-order insulator to metal transitions around 165 K and 245 K respectively. The magnetic transition temperatures () are found to be 165 K for 1ENO/1LNO and 225 K for 2ENO/1LNO SL from vs. plot Middey et al. (2018b); Zhou, Goodenough, and Dabrowski (2005); Ojha2019 [see right axis of Fig. 1(a) and (b)] .
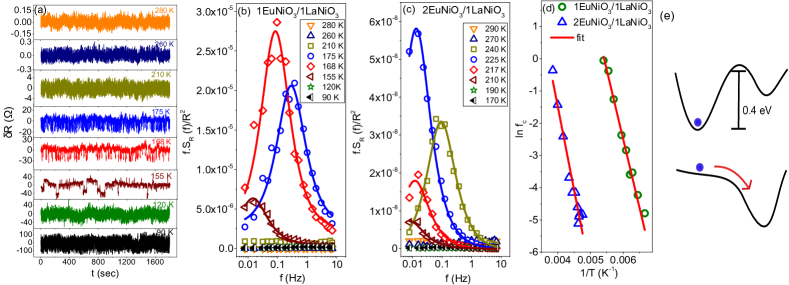
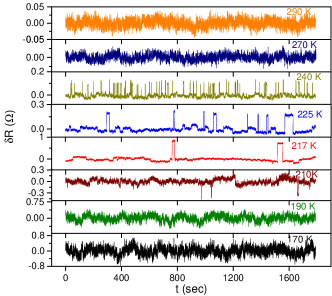
To probe nature of the electrical transport, we have measured low frequency resistance fluctuations of 1ENO/1LNO and 2ENO/1LNO films using standard 4 probe lock-in (LIA) technique Ghosh et al. (2004). This technique allows to measure both the sample as well as background noise. The sample has been current biased () with an excitation frequency 220 Hz. The voltage fluctuations arise at the sideband of after the signal is demodulated from the LIA. The output of the LIA has been digitized to a high speed analog to digital converter (ADC) and stored to get the time series of voltage fluctuations . The time series of voltage fluctuations has been converted to time series of resistance fluctuations as . In Fig. 2(a), we plot the time series of resistance fluctuations at different temperatures for 1ENO/1LNO SL. As clearly seen, each time series for consists of random resistance fluctuations about the average value. Similar features have been also seen in case of 2ENO/1LNO SL for (see Appendix, Fig. 5). Interestingly, we observe the appearance of random telegraphic noise (RTN) with the resistance fluctuations between two states in the temperature range 140 K K for 1ENO/1LNO SL and 200 K 260 K for 2ENO/1LNO SL. These RTN are absent below 140 K for 1ENO/1LNO SL and 195 K for 2ENO/1LNO SL. Such RTN has been also reported for other systems e.g. manganites Bid et al. (2003), and two-dimensional superconductor Kundu et al. (2017), where the system can fluctuate between two distinct phases. Surprisingly, the ratio of the temperature (), where RTN starts to appear and the is very similar ( 0.85) for both 1ENO/1LNO and 2ENO/1LNO SLs.
To understand the origin of the RTN, we have investigated the power spectral density (PSD) of the resistance fluctuations . At each , the resistance fluctuations have been recorded for 30 minutes. The data have been decimated and digitally filtered to eliminate 50 Hz line frequency. has been calculated using fast Fourier transformation (FFT) technique from the filtered time series Ghosh et al. (2004). The minimum and maximum frequency of the noise measurement are 4 mHz and 8 Hz, respectively. In order to accentuate any deviation from nature of the spectrum, we have plotted the quantity as a function of at few representative temperatures for 1ENO/1LNO (Fig. 2(b)) and 2ENO/1LNO (Fig. 2(c)). For , the PSD follows dependence with for both samples. However, a strong deviation from the dependence of the spectral power has been found within the temperature range 140 K K for 1ENO/1LNO SL and 200K 260 K for 2ENO/1LNO SL. Interestingly, these are the same temperature ranges, where RTN has been also observed. Further analysis shows that in this temperature range has two components: (a) component, and (b) a Lorentzian term with a corner frequency as
| (1) |
The constants and are the measure of the relative strength of the two terms. The second term arises from single-frequency fluctuator with a frequency . can be extracted by the fitting (solid line) of the experimental data (symbol) using Eq. 1, as shown in Fig. 2(b) and (c) for 1ENO/1LNO and 2ENO/1LNO films, respectively for several temperatures.
The linear relation between ln vs. 1/ (Fig. 2(d)) demonstrates thermally activated behavior of (, is the Boltzmann’s constant) with an activation energy 0.42 0.03 eV for both samples. Similar value of was also observed in CMR manganite when it undergoes charge order transition Bid et al. (2003). The physical significance of this activated behavior can be visualized as follows. For , the entire volume is spatially insulating and the resistance fluctuations are completely random. When the temperature reaches , metallic clusters start to nucleate in the insulating background. Such metastable metallic phase is separated from the insulating phase by the energy barrier (upper panel of Fig. 2(e)) and the competition between these two phases results RTN in the resistance fluctuations. For , the system is again completely in the metallic state (Fig. 2(e): lower panel) and fluctuations become random again. In the subsequent paragraphs, we discuss the results of integrated PSD and second spectrum to strengthen this picture. Details of the quantitative estimation of noise level can be found in Appendix.
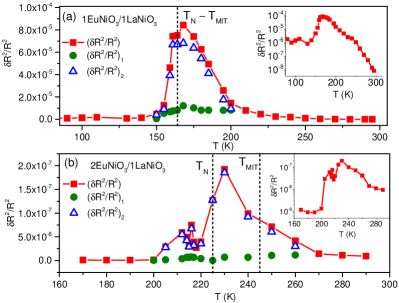
The PSD of resistance fluctuations has been further integrated over the measurement bandwidth to obtain the relative variance (noise) =. As can be seen from the inset of Fig. 3 (a) and (b), the magnitude of noise in the insulating phase of 1ENO/1LNO SL is 103 times larger than the observed noise in insulating phase of 2ENO/1LNO SL. The noise value remains almost constant up to for both samples. While the noise is maximized around 165 K for 1ENO/1LNO SL, the peak for 2ENO/1LNO SL appears around 230 K, which is 15 K lower than 245 K. Interestingly, this 2ENO/1LNO sample also shows an additional noise peak around 210 K, which is again 15 K lower than the 225 K. At this moment, the reason for this shift between the transition temperature obtained from resistivity measurement and the temperature of noise peak remains unclear. It may be related with the resistance fluctuations due to short range charge orderings Piamonteze et al. (2005) in insulating phase of this sample. In spite of strong difference of the noise magnitude in insulating phases of 1ENO/1LNO and 2ENO/1LNO films, noise at 300 K has similar order of magnitude () in both samples. In the temperature range 1.1, the total noise behaves as for both samples. The temperature dependence of total noise , the contribution of the component and Lorentzian component are shown in Fig. 3(a) and (b). It is remarkable that noise in the temperature range predominantly arises from the Lorentzian component with a negligible contribution from term.
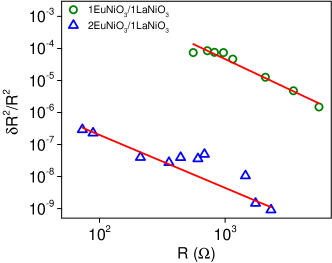
We note that the noise close to is 2-4 orders larger than the conventional metal hooge1972discussion , suggesting the microstructural details of the superlattices are different from disorder metallic systems. This large increase in noise close to can be due to the percolative transition of electrons in an inhomogeneous medium Tremblay et al. (1986). It has been predicted for such medium from the ‘random void model’ that noise scales as with . We find that with within the temperature range 140 K 175 K for 1ENO/1LNO SL and 200 K 230 K for 2ENO/1LNO SL (see Appendix: Fig. 6). Such classical percolation picture has been reported in other oxides as well when they undergo normal to superconducting phase transition Kiss and Svedlindh (1994); Daptary et al. (2016). It can be seen from Fig. 3 that the magnitude of noise of 1ENO/1LNO is three orders larger than that of 2ENO/1LNO. Large increase in noise have been seen in other oxide undergoing long range charge-ordering transition Bid et al. (2003). We speculate that because of the absence of long range CO in 2ENO/1LNO SL, noise magnitude is smaller than 1ENO/1LNO SL.
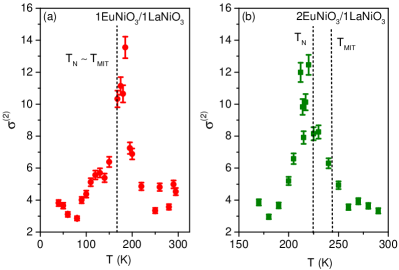
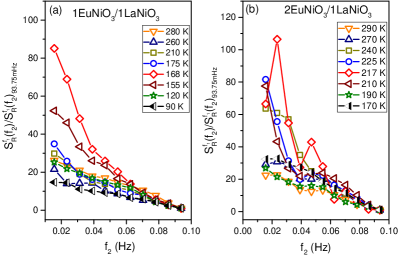
While the origin of noise in metallic phase can be understood from the Dutta-Horn model Dutta and Horn (1981); Daptary et al. (2017), such defect scattering based mechanism fails to explain the peculiar behavior of noise in the temperature range region. To gain better understanding of the origin of such excess noise, we have investigated higher order statistics of resistance fluctuations, which have been used to study the presence of long-range correlations undergoing magnetic, spin-glass Daptary et al. (2014), superconducting transition Daptary et al. (2016). To calculate the higher order statistics of resistance fluctuations, we have computed the second spectrum. The second spectrum is a four-point correlation function of the resistance fluctuations over a chosen octave () and is defined as where is the centre frequency of a chosen octave and is the spectral frequency. Physically, represents the ‘spectral wandering’or fluctuations in the PSD with time in the chosen frequency octave Seidler and Solin (1996). To avoid artifacts in the actual signal from the Gaussian background noise, we have calculated the second spectrum over the frequency octave 0.09375-0.1875 Hz, where the sample noise is significantly higher than the background noise. We show plot of the variation of second spectrum with of frequency at different for both superlattices in Appendix (Fig. 7). A convenient way of representing the second spectrum is through the normalized form defined as . For Gaussian fluctuations, = 3 and any deviation from this value would imply the presence of NGC in the fluctuation spectrum Seidler and Solin (1996). As expected, in metallic phase of both samples (Fig. 4(a) and (b)). starts to deviate from 3 for both samples around , implying that the observation of excess noise is intimately connected to the electronic phase separation. In case of 1ENO/1LNO SL, shows a peak near . On the contrary, becomes maximum near for 2ENO/1LNO SL. This surprising observation is likely to be related to the multi-band nature of these materials. The Fermi surface of the paramagnetic metallic phase consists of large hole pockets with small electron pockets Eguchi et al. (2009). As inferred from the Hall effect measurements by Ojha et al. Ojha2019 , the metal insulator transition results in a partially gapped Fermi surface and the hole Fermi surface vanishes around by the nesting driven paramagnetic to -antiferromagnetic transition.
The length scale associated with the electronic phase separation can be estimated if we consider that the activation energy () corresponds to the pure elastic energy generated due to the volume difference between metallic and insulating phase Bid et al. (2003). The bulk modulus of EuNiO3 and LaNiO3 is approximately 320 GPa and 380 GPa, respectively Zhou et al. (2004). The out-of-plane lattice constant of the SLs shows around 0.2% expansion across the MIT Middey et al. (2018a), yielding an energy density () 160-190 kJ/m3 associated with the transformation. By assuming that the metallic nucleating regions are spherical with a diameter , 0.42 eV corresponds to 7.0-7.4 nm. We note that conductive-atomic force microscopy study with a spatial resolution of 100 nm has found nucleation of metallic domains with size 100-300 nm in a NdNiO3 thin film Preziosi et al. (2018). Our results emphasizes that nucleation of such metallic phase happens at much shorter length scale.
Earlier X-ray absorption spectroscopy experiment demonstrated the presence of short-range charge ordering even in metallic phase of all NiO3 Piamonteze et al. (2005). Our present noise measurements emphasize similar characteristics for both samples, such as random resistance fluctuations, 1/ noise for and RTN in resistance fluctuations, non-1/ and non-Gaussian characterization of noise for . Further, the very similar length scale associated with nucleation of metallic clusters in the insulating phase in both samples also suggests that the samples have similar electronic and magnetic properties in nanoscale. However, the much smaller noise magnitude of 2ENO/1LNO around compared to 1ENO/1LNO SL, and additional noise peak near infer that the details of the electrical transport process depend on the presence/absence of long-range charge and magnetic orderings. Complimentary microscopy experiments with sub-nm resolution should help to clarify the details of the development of long-range charge ordered phase from a short-range charge ordered phase and the magnetic nature of phase separated phases around the transition temperatures.
IV Conclusion
To summarize, we have observed the presence of large excess noise around the metal-insulator and magnetic transitions in EuNiO3/LaNiO3 thin films. The appearance of RTN, causing non-1/ noise below implies that the electronic phase separation is responsible for the excess noise. This is further corroborated by the observation of a large non-Gaussian noise in the insulating phase. Noise in the metallic phase shows 1/ behavior with the Gaussian statistics of the resistance fluctuations. Observation of the maxima of near the for 2ENO/1LNO SL is likely to be connected to the Fermi surface nesting driven origin of -type antiferromagnetic ordering. Our experiments highlight the importance of resistance fluctuations study near the phase transition which can be applied to understand transition between two electronic phases of any system.
V Acknowledgements
SM acknowledges IISc start up grant and DST Nanomission grant no. DST/NM/NS/2018/246 for financial support. AB thanks SERB, DST for financial support. J.C. is supported by the Gordon and Betty Moore Foundation EPiQS Initiative through Grant No. GBMF4534.
Appendix
To compare the noise level of EuNiO3/LaNiO3 with other nickelates, we have calculated the Hooge parameter Hooge (1969), defined as (, total number of charge carriers has been evaluated from Hall effect measurement). The value of for different nickelates have been tabulated in table 1. The large value of suggests that the origin of noise of these NiO3 are different from the scattering mechanism of electron with lattice phonon mode predicted by Hooge for metals and semiconductors hooge1972discussion . A possible explanation of large increase in noise is the classical percolation of electrons in inhomogeneous medium Tremblay et al. (1986).
| System | Hooge parameter at 300 K |
|---|---|
| 1EuNiO3/1LaNiO3 | 104 |
| 2EuNiO3/1LaNiO3 | 104 |
| LaNiO3-δ ghosh1997dependence | 103 |
| SmNiO3 Sahoo et al. (2014) | |
| NdNiO3 Bisht et al. (2017); Alsaqqa et al. (2017) |
References
- Imada et al. (1998) M. Imada, A. Fujimori, and Y. Tokura, Rev. Mod. Phys. 70, 1039 (1998).
- Tokura (2006) Y. Tokura, Reports on Progress in Physics 69, 797 (2006).
- Middey et al. (2016) S. Middey, J. Chakhalian, P. Mahadevan, J. W. Freeland, A. J. Millis, and D. D. Sarma, Annual Review of Materials Research 46, 305 (2016).
- Catalano et al. (2018) S. Catalano, M. Gibert, J. Fowlie, J. Íñiguez, J.-M. Triscone, and J. Kreisel, Reports on Progress in Physics 81, 046501 (2018).
- Medarde (1997) M. L. Medarde, Journal of Physics: Condensed Matter 9, 1679 (1997).
- Catalan (2008) G. Catalan, Phase Transitions 81, 729 (2008).
- Mercy et al. (2017) A. Mercy, J. Bieder, J. Íñiguez, and P. Ghosez, Nature Communications 8, 1667 (2017).
- Stewart et al. (2011) M. K. Stewart, J. Liu, M. Kareev, J. Chakhalian, and D. N. Basov, Phys. Rev. Lett. 107, 176401 (2011).
- Staub et al. (2002) U. Staub, G. I. Meijer, F. Fauth, R. Allenspach, J. G. Bednorz, J. Karpinski, S. M. Kazakov, L. Paolasini, and F. d’Acapito, Phys. Rev. Lett. 88, 126402 (2002).
- Mazin et al. (2007) I. I. Mazin, D. I. Khomskii, R. Lengsdorf, J. A. Alonso, W. G. Marshall, R. M. Ibberson, A. Podlesnyak, M. J. Martínez-Lope, and M. M. Abd-Elmeguid, Phys. Rev. Lett. 98, 176406 (2007).
- Barman et al. (1994) S. R. Barman, A. Chainani, and D. D. Sarma, Phys. Rev. B 49, 8475 (1994).
- Mizokawa et al. (2000) T. Mizokawa, D. I. Khomskii, and G. A. Sawatzky, Phys. Rev. B 61, 11263 (2000).
- Park et al. (2012) H. Park, A. J. Millis, and C. A. Marianetti, Phys. Rev. Lett. 109, 156402 (2012).
- Johnston et al. (2014) S. Johnston, A. Mukherjee, I. Elfimov, M. Berciu, and G. A. Sawatzky, Phys. Rev. Lett. 112, 106404 (2014).
- Subedi et al. (2015) A. Subedi, O. E. Peil, and A. Georges, Phys. Rev. B 91, 075128 (2015).
- Bisogni et al. (2016) V. Bisogni, S. Catalano, R. J. Green, M. Gibert, R. Scherwitzl, Y. Huang, V. N. Strocov, P. Zubko, S. Balandeh, J.-M. Triscone, and et al., Nature Communications 7, 13017 (2016).
- Shamblin et al. (2018) J. Shamblin, M. Heres, H. Zhou, J. Sangoro, M. Lang, J. Neuefeind, J. A. Alonso, and S. Johnston, Nature Communications 9, 86 (2018).
- Lee et al. (2011a) S. Lee, R. Chen, and L. Balents, Phys. Rev. Lett. 106, 016405 (2011a).
- Lee et al. (2011b) S. Lee, R. Chen, and L. Balents, Phys. Rev. B 84, 165119 (2011b).
- Hepting et al. (2014) M. Hepting, M. Minola, A. Frano, G. Cristiani, G. Logvenov, E. Schierle, M. Wu, M. Bluschke, E. Weschke, H.-U. Habermeier, E. Benckiser, M. Le Tacon, and B. Keimer, Phys. Rev. Lett. 113, 227206 (2014).
- Middey et al. (2018a) S. Middey, D. Meyers, M. Kareev, Y. Cao, X. Liu, P. Shafer, J. W. Freeland, J.-W. Kim, P. J. Ryan, and J. Chakhalian, Phys. Rev. Lett. 120, 156801 (2018a).
- (22) R. Scherwitzl, P. Zubko, I. Gutierrez Lezama, S. Ono, A. F. Morpurgo, G. Catalan, and J.?M. Triscone, Advanced Materials, 22, 5517 (2010).
- (23) J . Shi , S. D. Ha , Y. Zhou, F. Schoofs, and S. Ramanathan Nat. Commun. 4, 2676 (2013).
- (24) J. Shi, Y. Zhou and S. Ramanathan, Nat. Commun. 5, 4860 (2014).
- (25) S. D. Ha , J. Shi, Y. Meroz, L. Mahadevan, and S. Ramanathan, Phys. Rev. Appl. 2, 064003 (2014).
- (26) B. K. Jones - IEE Proceedings-Circuits, Devices and Systems, 149, 13 (2002).
- Koushik et al. (2011) R. Koushik, M. Baenninger, V. Narayan, S. Mukerjee, M. Pepper, I. Farrer, D. A. Ritchie, and A. Ghosh, Physical Review B 83, 085302 (2011).
- Chandni et al. (2009) U. Chandni, A. Ghosh, H. Vijaya, and S. Mohan, Physical review letters 102, 025701 (2009).
- Kundu et al. (2017) H. K. Kundu, S. Ray, K. Dolui, V. Bagwe, P. R. Choudhury, S. Krupanidhi, T. Das, P. Raychaudhuri, and A. Bid, Physical review letters 119, 226802 (2017).
- Clarke and Hsiang (1976) J. Clarke and T. Y. Hsiang, Physical Review B 13, 4790 (1976).
- Babić et al. (2007) D. Babić, J. Bentner, C. Sürgers, and C. Strunk, Physical Review B 76, 134515 (2007).
- (32) F. Reif, Fundamentals of statistical and thermal physics, Waveland Press (2009).
- Weissman (1988) M. B. Weissman, Rev. Mod. Phys. 60, 537 (1988).
- Ghosh et al. (2004) A. Ghosh, S. Kar, A. Bid, and A. Raychaudhuri, arXiv preprint cond-mat/0402130 (2004).
- Sahoo et al. (2014) A. Sahoo, S. D. Ha, S. Ramanathan, and A. Ghosh, Physical Review B 90, 085116 (2014).
- Alsaqqa et al. (2017) A. M. Alsaqqa, S. Singh, S. Middey, M. Kareev, J. Chakhalian, and G. Sambandamurthy, Physical Review B 95, 125132 (2017).
- Bisht et al. (2017) R. S. Bisht, S. Samanta, and A. K. Raychaudhuri, Phys. Rev. B 95, 115147 (2017).
- Bid et al. (2003) A. Bid, A. Guha, and A. Raychaudhuri, Physical Review B 67, 174415 (2003).
- Middey et al. (2018b) S. Middey, D. Meyers, M. Kareev, X. Liu, Y. Cao, J. W. Freeland, and J. Chakhalian, Phys. Rev. B 98, 045115 (2018b).
- Middey et al. (2018c) S. Middey, D. Meyers, R. K. Patel, X. Liu, M. Kareev, P. Shafer, J.-W. Kim, P. J. Ryan, and J. Chakhalian, Applied Physics Letters 113, 081602 (2018c).
- Zhou, Goodenough, and Dabrowski (2005) J.-S. Zhou, J. B. Goodenough, and B. Dabrowski, Phys. Rev. Lett. 94, 226602 (2005).
- (42) S. K. Ojha, S. Ray, T. Das, S. Middey, S. Sarkar, P. Mahadevan, Z. Wang, Y. Zhu, X. Liu, M. Kareev, and J. Chakhalian, Phys. Rev. B 99, 235153 (2019).
- Hooge (1969) F. N. Hooge, Phys. Lett. 29, 139 (1969).
- Piamonteze et al. (2005) C. Piamonteze, H. C. N. Tolentino, A. Y. Ramos, N. E. Massa, J. A. Alonso, M. J. Martínez-Lope, and M. T. Casais, Phys. Rev. B 71, 012104 (2005).
- (45) F. N. Hooge, Physica 60, 130 (1972).
- Tremblay et al. (1986) A.-M. S. Tremblay, S. Feng, and P. Breton, Phys. Rev. B 33, 2077 (1986).
- Kiss and Svedlindh (1994) L. B. Kiss and P. Svedlindh, IEEE Transactions on Electron Devices 41, 2112 (1994).
- Daptary et al. (2016) G. N. Daptary, S. Kumar, P. Kumar, A. Dogra, N. Mohanta, A. Taraphder, and A. Bid, Physical Review B 94, 085104 (2016).
- Dutta and Horn (1981) P. Dutta and P. Horn, Reviews of Modern physics 53, 497 (1981).
- Daptary et al. (2017) G. N. Daptary, C. Sow, S. Sarkar, S. Chiniwar, P. A. Kumar, A. Sil, and A. Bid, Physica B: Condensed Matter 511, 74 (2017).
- Seidler et al. (1996) G. Seidler, S. Solin, and A. Marley, Physical review letters 76, 3049 (1996).
- Daptary et al. (2014) G. N. Daptary, C. Sow, P. A. Kumar, and A. Bid, Physical Review B 90, 115153 (2014).
- Seidler and Solin (1996) G. Seidler and S. Solin, Physical Review B 53, 9753 (1996).
- Eguchi et al. (2009) R. Eguchi, A. Chainani, M. Taguchi, M. Matsunami, Y. Ishida, K. Horiba, Y. Senba, H. Ohashi, and S. Shin, Phys. Rev. B 79, 115122 (2009).
- Zhou et al. (2004) J.-S. Zhou, J. B. Goodenough, and B. Dabrowski, Phys. Rev. B 70, 081102 (2004).
- Preziosi et al. (2018) D. Preziosi, L. Lopez-Mir, X. Li, T. Cornelissen, J. H. Lee, F. Trier, K. Bouzehouane, S. Valencia, A. Gloter, A. Barthélémy, et al., Nano letters 18, 2226 (2018).
- (57) A. Ghosh, A. K. Raychaudhuri, R. Sreekala, M. Rajeswari, and T. Venkatesan, Journal of Physics D: Applied Physics, 30, L75 (1997).