Leveraging Sentence Similarity in Natural Language Generation:
Improving Beam Search using Range Voting
Abstract
We propose a method for natural language generation, choosing the most representative output rather than the most likely output. By viewing the language generation process from the voting theory perspective, we define representativeness using range voting and a similarity measure. The proposed method can be applied when generating from any probabilistic language model, including n-gram models and neural network models. We evaluate different similarity measures on an image captioning task and a machine translation task, and show that our method generates longer and more diverse sentences, providing a solution to the common problem of short outputs being preferred over longer and more informative ones. The generated sentences obtain higher BLEU scores, particularly when the beam size is large. We also perform a human evaluation on both tasks and find that the outputs generated using our method are rated higher.
1 Introduction
A language model specifies a probability distribution over sequences of words: given a sequence of length , the model assigns a probability to the entire sequence. The probability distribution may be conditioned: for example in machine translation the distribution is conditioned on the source language sentence.
In many applications, it is desirable to output a single sequence, rather than a distribution. A common approach is to choose the most likely sequence. However, this is problematic when the most likely sequence is not representative of the whole distribution.
For example, in dialogue generation tasks, the most likely output can be “I don’t know”, even when most of the probability mass is assigned to long informative sequences. Cao and Clark (2017) call this the “boring output problem”.
For a real-valued distribution, we can choose a representative output by taking the mean. However, for a discrete distribution (such as over sequences), the mean is not defined. In this paper, we choose a representative output using tools from voting theory, allowing us to avoid the boring output problem. The general idea is that, if the distribution assigns most of the probability mass to a group of similar sequences, we would like to generate one of them – even if they have low probability as individual sequences, they have high probability as a group. We can formulate this process as a range voting election, where the sentences vote for each other, with the strength of a vote being proportional to the similarity between the voter sequence and the candidate sequence.
Our approach can be used to mitigate problems commonly associated with language models. For example, a long-recognised problem is that shorter sequences are assigned higher probabilities and thus choosing the most likely sequence favours short sequences (Brown et al., 1995). Indeed, Stahlberg and Byrne (2019) show that the most likely output in machine translation is often the empty string. By designing the similarity function to be asymmetric such that more informative candidate sequences receive stronger votes, we can generate longer and more diverse outputs (see Fig. 1 for an example).
We focus on simple similarity metrics based on n-grams and generate the candidates and voters using beam search. We evaluate on two tasks: image captioning and machine translation. For both tasks, we find that our approach achieves higher BLEU scores, and performs better in a human evaluation. Our approach also generates longer and more diverse outputs, with the generated length and diversity more closely matching the length and diversity of the reference captions and reference translations.

0.00230: a couple of people that are sitting on a bench
0.00132: a man sitting on a bench next to a dog
0.00079: a black and white photo of a man sitting on a
bench
0.00075: a couple of people sitting on a bench
0.00066: a man sitting on a bench with a dog
0.00064: a man and a woman sitting on a bench
0.00048: a man and a woman sitting on a park bench
0.00046: a black and white photo of a man and a horse
0.00033: a black and white photo of a man and a dog
0.00025: a black and white photo of a man on a horse
2 Related work
Much work has gone into analysing sources of errors in language generation, often focused on machine translation. Koehn and Knowles (2017) raise 6 challenges for machine translation, including degrading performance for longer sentences, and degrading performance for larger beam sizes. Stahlberg and Byrne (2019) distinguish model errors (high probabilities of bad sequences) and search errors (failing to find sequences preferred by the model). They show that the global optimal translations (according to likelihood) are considerably worse than translations found by beam search. This points to both serious model errors and serious search errors, which cancel out to some degree. This suggests there is much work to be done in improving both our models and our search objectives – the latter is the aim of this paper.
Ott et al. (2018) find that beam search typically covers only a small proportion of the model’s probability mass,111Since our paper was submitted, this finding was replicated by Eikema and Aziz (2020), who further argue that the maximum-likelihood decoding objective is hard to justify when the maximum likelihood is so low. and they show that the degradation for large beams is at least partly due to the training data containing target sentences that are exact copies of source sentences. They also suggest that beam search is an effective search strategy, for the maximum-likelihood search objective, finding hypotheses with higher model probabilities than the reference translations.
Cohen and Beck (2019) also find a performance degradation with larger beam sizes across different tasks (translation, image captioning and summarisation) and propose to add a search discrepancy heuristic to beam search. For image captioning, Vinyals et al. (2017) show that larger beams not only decrease performance but also reduce the diversity of the captions. They claim this is an overfitting effect and propose the use of small beam sizes as further regularization.
In unconditional, open-ended language generation, Holtzman et al. (2020) find that using likelihood as the decoding objective leads to bland and repetitive text with unnaturally high probability and too little variance. They claim this is not due to a search error, but due to the maximum-likelihood decoding objective. They propose sampling, truncated the distribution to the top percent of tokens.
2.1 Generation length and diversity
To increase the length and diversity of a model’s outputs, some authors have proposed changes to the model architecture. In dialogue generation, Cao and Clark (2017) use a latent variable model to capture the possible “topics” of a response.
Others have proposed changing the objective function. In dialogue generation, Li et al. (2016a) optimise mutual information instead of probability. In machine translation, Tu et al. (2017) modify an encoder-decoder model by adding a “reconstructor” to predict the input based on the output.
However, modifying the model or the objective function depends on the particular task, and applying these techniques to an existing system requires retraining the model. In this paper, we focus on general methods which can be applied to any probabilistic model in any generation task. Length normalisation (Wu et al., 2016; Freitag and Al-Onaizan, 2017) explicitly penalises shorter sequences during the beam expansion phase by dividing the log-probability of a sequence by its length. Diverse decoding (Li et al., 2016b; Li and Jurafsky, 2016) penalises repeated expansions of the same beam node. Diverse beam search (Vijayakumar et al., 2018) penalises generation of similar beams using their Hamming diversity. These last two methods aim to increase the diversity within a beam, but not necessarily across the dataset.
Kool et al. (2019) propose a stochastic beam search based on the Gumbel-Top- trick to sample without replacement. The proposed approach can trade-off BLEU score against translation diversity.
Finally, it is important to make sure that improvements to a model can be properly evaluated. After our paper was submitted, Freitag et al. (2020) report that the references used in machine translation often exhibit poor diversity, which can unfairly penalise models which exhibit good diversity. They propose to use paraphrased reference translations instead. These paraphrases yield higher correlation with human judgement when evaluated using BLEU, and could be used in future work to improve the evaluation of translation systems which aim to generate appropriately diverse outputs.
2.2 Minimum Bayes Risk Decoding
Kumar and Byrne (2004) introduce the Minimum Bayes Risk (MBR) decoder for machine translation. Like our proposed approach, this aims to use the whole distribution, rather than picking the most likely sequence. They frame the problem in terms of Bayes Risk: given the true distribution over outputs, and given a loss function between the system output and the target output, the Bayes Risk is defined as the expected loss. The best output is the one which minimises the Bayes Risk.
However, the true distribution over outputs is not known, so Kumar and Byrne approximate it using the model’s distribution. The MBR decoder first uses beam search, and then re-ranks it according to the BLEU scores between sequences in the beam.
Tromble et al. (2008) apply MBR over translation lattices. Shimizu et al. (2012) use MBR with a smoothed BLEU loss function and propose to limit the possible translations to those that are similar to most-likely translation generated by beam search.
Blain et al. (2017) propose to re-rank the sentences generated by beam search using a similarity metric. Their approach is similar to ours but doesn’t include the probability of the sentences given by the decoder, and thus would degrade completely in the limit of very large beam sizes. They find that using BLEU as a similarity metric reduces the quality of generated translations, according to both BLEU and a human evaluation.
3 Method
3.1 Beam search
When working with a distribution over sequences, it is not feasible to consider all possible sequences. Finding the most likely sequence can be computationally expensive – in fact, for an RNN it is undecidable in the general case (Chen et al., 2018). A common solution is to use beam search, which generates the sequence one token at a time, maintaining a list of the most promising sequences at each time step (for example: Brown et al., 1995; Koehn, 2004a). Greedy search is the special case where .
Beam search introduces an extra hyper-parameter, the beam size . Increasing covers more of the search space, but increases the computational cost. It is tempting to assume that increasing will produce better results, but empirically, the quality of the most likely sequence starts to decrease after exceeds a certain threshold (Koehn and Knowles, 2017; Cohen and Beck, 2019).
In the next section, we propose an alternative way to generate from a beam, which aims to avoid the drop in performance as beam size increases. Rather than choosing the most likely sequence, we choose the most representative sequence.
3.2 Range voting
To formalise representativeness, we propose to use a voting procedure. Although voting has been applied to ensembles of classifiers (for an overview, see: Kuncheva, 2004; Kuncheva and Rodríguez, 2014), we are not aware of work using voting to select from a distribution.
We can see each sequence as a candidate in an election, and the probability of a sequence as the proportion of votes for that candidate. From this perspective, the problem of probability mass being split across long sequences is the well-known problem of vote splitting. Suppose candidate wins an election. Now suppose we run the election again, but add an additional candidate , identical to . A voting system is robust against vote splitting (and called independent of clones) if the winner must be or (Tideman, 1987).
A well-studied system which is independent of clones is range voting (Heckscher, 1892; Smith, 2000; Tideman, 2006; Lagerspetz, 2016). Each voter scores each candidate in the range , and the candidate with the highest total score wins.
In our setting, probability mass can be seen as the proportion of votes placing a candidate as first choice (see Fig. 1 for an example). For range voting, we need to augment the votes with scores for all other candidates. We propose to do this using a similarity measure. The final score for a sequence (the set of candidates) is given in (1), for a set of voter sequences and a similarity measure .
| (1) |
A sequence can act as both voter and candidate. Each voter sequence is weighted by its probability, and casts a vote for each candidate sequence, where the strength of the vote is the similarity between the voter and the candidate. The simplest way to apply this method is to use beam search to define both the set of candidates and the set of voters.
This can be seen as a generalisation of taking an average. In a Euclidean space, the mean is equivalent to voting with quadratic similarity , and the median is equivalent to voting with linear similarity , for some constant .
Although the vote splitting problem may appear abstract, it can happen in practice, even without considering similarity. When using subword vocabularies (Sennrich et al., 2016), there are multiple ways of encoding any given sentence. The model’s probability mass is split across sentences with identical surface form but different encodings.
Defining semantic similarity between sentences is recognised as a hard problem (Achananuparp et al., 2008; Cer et al., 2017; Pawar and Mago, 2019). In this work, we focus on simple, domain-agnostic similarity measures which do not require additional training.
First, we consider similarity based on n-grams. For a sequence , we write for its set of n-grams, and for its bag (or multiset) of n-grams. We define two measures in (2–3). Both are asymmetric, to encourage informative sequences: if contains plus more information, should be high, but if contains less information, then should be lower. This allows an informative candidate sequence to gather more votes.
| (2) | ||||
| (3) |
Second, inspired by Mueller and Thyagarajan (2016), we consider a similarity measure based on the hidden states of the decoders (LSTM and Transformer) during generation (see §4.1). For each sequence, we find the average of the hidden states, and then compute the cosine similarity. We refer to this measure as and .
3.3 Comparison with MBR Decoding
The formulation used for range voting is reminiscent of MBR decoding (see §2.2). In fact, if the similarity measure in (1) is , range voting recovers MBR decoding. From a theoretical point of view, range voting provides an independent motivation for MBR decoding, and furthermore, one which does not require the assumption that we can approximate the true distribution by the model’s distribution. We know that the model’s distribution does not match the true distribution (or else we would have already solved the task), and so this is a strong assumption to make.
From a practical point of view, range voting suggests that any similarity measure could be used, and not necessarily the evaluation metric. Using BLEU has several disadvantages. Firstly, BLEU can be harsh: when there are no 3- or 4-gram matches, the score is 0. Secondly, BLEU is a corpus-level metric which does not decompose over sentences. Finally, BLEU is precision-based, penalising translations containing information that is not in the reference. In MBR, this means that candidate sequences are penalised for containing more information than voter sequences. Our proposed similarity measures are asymmetric in the opposite direction, to encourage generation of long and informative sequences.
Indeed, in our experiments, we have found that simple similarity measures produce longer and more diverse sentences than BLEU, and for translation better results, even though BLEU is used as the evaluation metric.
Furthermore, the voting theory perspective can yield analytical insights even when range voting is not used. For example, the performance degradation found by Cohen and Beck (2019) can be interpreted in terms of vote splitting. They argue for the need to filter out sequences which begin with a low-probability token that is followed by very-high-probability tokens, in favour of sequences where all tokens have fairly high probability. The sequences they want to filter out have not split the vote (later tokens have probability close to 1, so there are no similar sequences that have high probability), but the sequences they want to keep have split the vote (there are similar sequences with similar probability). Their method aims to remove these problematic sequences that don’t split the vote, while our method aims to be robust against vote splitting.
4 Experiments
| BLEU-1 | BLEU-4 | |||||||
|---|---|---|---|---|---|---|---|---|
| Beam size | 1 | 2 | 10 | 100 | 1 | 2 | 10 | 100 |
| Beam search | 66.66 | 67.97 | 67.22 | 66.18 | 25.39 | 26.83 | 27.16 | 26.31 |
| \hdashlineLength normalisation | 66.66 | 68.47 | 64.72 | 63.10 | 25.39 | 26.72 | 25.76 | 24.72 |
| Diverse decoding | 66.66 | 67.90 | 67.24 | 66.43 | 25.39 | 26.68 | 26.93 | 26.37 |
| \hdashline | 66.66 | 68.55 | 66.26 | 66.36 | 25.39 | 26.47 | 25.61 | 24.60 |
| 66.66 | 68.54 | 66.31 | 66.46 | 25.39 | 26.47 | 25.62 | 24.58 | |
| 66.66 | 68.20 | 67.36 | 67.19 | 25.39 | 26.82 | 27.22 | 27.13 | |
| 66.66 | 68.20 | 67.63 | 67.21 | 25.39 | 26.82 | 27.23 | 27.13 | |
| 66.66 | 67.97 | 68.42 | 69.10 | 25.39 | 26.83 | 27.96 | 28.23 | |
| \hdashline (MBR) | 66.66 | 67.93 | 67.66 | 68.56 | 25.39 | 26.83 | 27.80 | 28.71 |
| (MBR) | 66.66 | 67.98 | 67.87 | 69.45 | 25.39 | 26.84 | 27.89 | 29.19 |
We evaluate our method on two tasks: image captioning and machine translation. For MBR, we use BLEU () and a smoothed version of BLEU () which adds 1 to the -gram counts for to mitigate the harshness of the metric (Shimizu et al., 2012).
We consider two baselines: length normalisation and diverse decoding, described in §2.1. For machine translation, we also consider diverse beam search as a further baseline. Other methods mentioned in §2 cannot be straightforwardly applied as they require modifying the model or the training objective.
4.1 Image captioning
We use the MSCOCO dataset (Lin et al., 2014), which consists of 82,783 training images and 40,504 validation images, each annotated with 5 captions from human annotators.
We use the “Show and Tell” encoder-decoder architecture of Vinyals et al. (2015). The encoder is a pretrained Inception V3 CNN (Szegedy et al., 2016) from which we extract a feature vector from the final pooling layer (Ioffe and Szegedy, 2015). The decoder is an LSTM (Hochreiter and Schmidhuber, 1997) with 512 hidden units, initialising the hidden state using the encoder. The vocabulary consists of the 5000 most common words in the training captions, for which embeddings of size 512 are learned from scratch.
4.1.1 BLEU scores
Table 1 shows BLEU scores (Papineni et al., 2002) on the MSCOCO validation set computed using NLTK (Bird et al., 2009). The bigram similarity measures and the measure improve BLEU scores for almost all beam sizes. In contrast, diverse decoding has almost no effect on BLEU, while length normalisation performs worse than standard beam search. The best result with our similarity metrics is achieved by at . This is significantly better than the best result for standard beam search (), with for a paired bootstrap test following Koehn (2004b). Using and increasing the beam size to gives the overall best results.
Sampling methods proposed for open-ended generation perform poorly. Top-k sampling (Fan et al., 2018) achieves BLEU scores of 17.15 and 13.79 , nucleus sampling (Holtzman et al., 2020) achieves a score of 13.62
Consistent with Ott et al. (2018) and Koehn and Knowles (2017), increasing with beam search too much reduces BLEU. However, this drop does not occur for our voting method.
| Distinct captions | Distinct unigrams | Distinct bigrams | |||||||
|---|---|---|---|---|---|---|---|---|---|
| Beam size | 2 | 10 | 100 | 2 | 10 | 100 | 2 | 10 | 100 |
| Beam search | 9208 | 5488 | 4150 | 668 | 621 | 605 | 3395 | 2778 | 2479 |
| \hdashlineLength normalisation | 9978 | 6418 | 5039 | 681 | 627 | 587 | 3502 | 2863 | 2471 |
| Diverse decoding | 9942 | 6424 | 4403 | 672 | 646 | 612 | 3402 | 3023 | 2561 |
| \hdashline | 10727 | 8916 | 10808 | 687 | 646 | 628 | 3576 | 3232 | 3596 |
| 10727 | 8902 | 10768 | 687 | 645 | 638 | 3572 | 3238 | 3607 | |
| 9519 | 7598 | 9221 | 673 | 620 | 580 | 3446 | 2854 | 2887 | |
| 9522 | 7590 | 9248 | 673 | 620 | 581 | 3444 | 2848 | 2892 | |
| 9208 | 7613 | 10133 | 668 | 629 | 655 | 3395 | 2891 | 3331 | |
| \hdashline (MBR) | 9159 | 6512 | 6763 | 667 | 612 | 570 | 3392 | 2666 | 2446 |
| (MBR) | 9206 | 6522 | 7019 | 667 | 613 | 560 | 3396 | 2675 | 2415 |
4.1.2 Caption length
| Average caption length | ||||
|---|---|---|---|---|
| Beam size | 1 | 2 | 10 | 100 |
| Beam search | 8.41 | 8.79 | 9.18 | 9.11 |
| \hdashlineLength norm. | 8.41 | 9.19 | 10.24 | 10.43 |
| Diverse decod. | 8.41 | 8.71 | 9.12 | 9.15 |
| \hdashline | 8.41 | 9.22 | 10.40 | 11.20 |
| 8.41 | 9.21 | 10.38 | 11.15 | |
| 8.41 | 8.96 | 9.86 | 10.55 | |
| 8.41 | 8.96 | 9.86 | 10.55 | |
| 8.41 | 8.79 | 9.17 | 8.82 | |
| \hdashline (MBR) | 8.41 | 8.77 | 9.27 | 9.32 |
| 8.41 | 8.79 | 9.24 | 9.13 | |
To analyse differences between methods, we first look at caption length, shown in Table 3. Standard beam search produces slightly longer captions as increases up to 10. All n-gram measures generate longer captions than standard beam search, and length continues to increase as goes to 100. Length normalisation also increases caption length, but this is at the cost of BLEU score (see §4.1.1). Diverse decoding does not increase caption length. The measure produces slightly shorter captions – as it is symmetric, it does not favour long sequences as the asymmetric n-gram measures do (see §3.2). As predicted by our range voting interpretation, MBR, for which the asymmetry is in the opposite direction, produces shorter captions than the simple n-gram similarity metrics.
4.1.3 Caption diversity
Following the approach of Li et al. (2016a), Dhingra et al. (2017), and Xu et al. (2017, 2018), we investigate the diversity of the generated captions by counting the number of distinct captions, unigrams, and bigrams (see Table 2).
For standard beam search, the number of distinct captions drops as increases. Both baselines weaken this effect, but the drop is still present. In contrast, range voting maintains caption diversity as increases, for all similarity measures.
Similarly, standard beam search sees a drop in the number of distinct unigrams and bigrams as increases, and the baselines do not seem to mitigate this. In contrast, the unigram measures and the measure maintain both unigram diversity and bigram diversity as increases, while the bigram measures partially maintain bigram diversity. As expected from our range voting perspective, MBR generates less diverse captions.
4.1.4 Human evaluation
BLEU is known to be imperfect, and does not always match human judgements (Callison-Burch et al., 2006; Blain et al., 2017). While the n-gram similarity measures produce similar BLEU scores to standard beam search, they also produce longer captions, which are potentially more informative. To investigate whether they are more informative in way that is not reflected by BLEU, we took 500 validation images for human evaluation, comparing the captions produced by standard beam search () against our best-performing n-gram measure (, ). Each pair of captions was presented in a random order, with the original image, and judged on a five-point scale (one caption much better, slightly better, or no difference).
The voted caption was rated better 106 times, and worse 73 times. This is statistically significant, with for a two-tailed sign test, discarding ties (Emerson and Simon, 1979). However, for captions rated much better, the voted caption was better 27 times and worse 40 times. This is suggestive but not fully significant ().
These results support the claim that a voted caption represents more of the information present in a model’s distribution over captions – this often leads to a better caption, but where the model is wrong, adding wrong information can make the caption much worse. After all, our method is designed as a better way to select from a distribution, not as an improvement to the distribution itself.
| Beam size | 1 | 2 | 4 | 10 | 30 | 100 |
|---|---|---|---|---|---|---|
| Beam search | 24.04 | 25.10 | 25.36 | 24.91 | 23.46 | 20.56 |
| \hdashlineLength normalisation | 24.04 | 25.19 | 25.59 | 25.55 | 24.40 | 21.78 |
| Diverse decoding | 24.04 | 24.88 | 25.17 | 24.71 | 23.49 | 20.82 |
| Diverse beam search | 24.04 | 24.55 | 24.70 | 23.93 | 22.14 | 18.38 |
| Beam search (no copy) | 23.96 | 25.10 | 25.43 | 25.23 | 24.38 | 22.59 |
| \hdashline | 23.96 | 25.17 | 25.48 | 25.55 | 24.97 | 24.20 |
| 23.96 | 25.17 | 25.47 | 25.54 | 24.95 | 24.21 | |
| 23.96 | 25.14 | 25.49 | 25.70 | 25.08 | 24.62 | |
| 23.96 | 25.20 | 25.53 | 25.39 | 24.69 | 23.96 | |
| 23.96 | 25.10 | 25.44 | 25.51 | 24.67 | 23.36 | |
| \hdashline (MBR) | 23.96 | 25.09 | 25.42 | 25.51 | 24.79 | 23.53 |
| (MBR) | 23.96 | 25.10 | 25.42 | 25.51 | 24.81 | 23.65 |
4.2 Machine translation
For the translation task, we use the WMT’14 English-German dataset, consisting of 4.5M sentence pairs. We train a Transformer ‘big’ model (Vaswani et al., 2017), implemented in the Tensor2Tensor library (Vaswani et al., 2018). We use the joint source and target byte-pair encoding vocabulary (Sennrich et al., 2016) with 32,000 tokens available on Tensor2Tensor. All results reported are for the newstest2014 test set, containing 2737 sentence pairs (Bojar et al., 2014).222We are evaluating systems translating from English into German, but half of the newstest2014 sentences were originally in German and translated into English. Translation artifacts are known to have an impact on machine translation performance (for example: Kurokawa et al., 2009; Holmqvist et al., 2009; Lembersky et al., 2012). One reviewer asked whether there is a difference in performance for the two halves of the dataset, as found by Freitag et al. (2019). In terms of BLEU score, range voting appears more effective for forward-translation (original text in English), but in terms of manual evaluation, it appears more effective for backward-translation (original text in German). For reasons of space, we only report results for the whole dataset. The BLEU scores were computed using SacreBleu (Post, 2018).
Ott et al. (2018) found that a common source of model error comes from outputting a copy of the input sentence, still in the source language. We also observe this phenomenon: with beam size 4, 0.4% of the outputs are exact copies of the input. This increases to 3.8% of the outputs for beam size 100. When counting the number of partial copies333A partial copy is defined to be a generated sentence containing at least 50% of the unigrams in the input sentence. the effect is even stronger: for beam sizes 4 and 100, respectively 1.3% and 12.4% of the generated translations are partial copies. Because of this, we add the method proposed by Ott et al. (2018), which filters out partial copies during beam search, as an extra baseline.
4.2.1 BLEU scores
The BLEU scores obtained on the WMT’14 En-De newstest2014 test set are shown in Table 4.
For beam search and all considered baselines, the scores for the larger beam sizes drop considerably. Adding the copy pruning heuristic from Ott et al. (2018) does help mitigate this problem somewhat but does not solve it: there is almost a 3 BLEU point drop between and .
To decouple a trivial source of model errors (input copies) from search errors, we apply our range voting method on the beams obtained with the filtering heuristic (Table 4, bottom half). Regardless of which similarity metric is used, re-ranking using range voting improves the BLEU score, and with the similarity, we achieve the best overall score of 25.70. Furthermore, the performance drop at large beam sizes is reduced when using range voting to about 1 BLEU point for .
There are two possible reasons for lower performance at larger beams: (1) different candidates: the sentence selected for a small beam is not in the larger beam; or (2) different voter preferences: the sentence selected for a small beam size is still there, but range voting selects a different sentence. In fact, both phenomena occur. First, for beam search and all similarity metrics, about 10% and 5% of the sentences selected at and respectively are not in the beam of size 100. Second, 48% and 61% of the sentences chosen by standard beam search with and respectively are also chosen for , but this drops to 32% and 36% respectively when using range voting with similarity. This suggests that generating candidates and voters independently could lead to further improvements, which we explore in §3.
Sampling methods also perform poorly on this task. Top k sampling achieves BLEU scores of 17.39 and 15.21 , nucleus sampling achieves a score of 10.10
4.2.2 Translation length
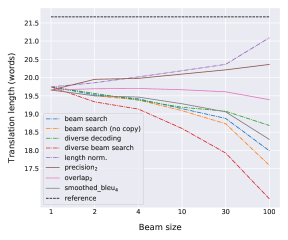
The average length of the generated translations are shown in Figure 2. All similarity metrics generate longer translations than standard beam search with and without filtering, but shorter than length normalisation. At beam size , length normalised beam search generates almost an extra word per translation compared to .
Just as for image captioning, the length of translations generated by standard beam search decreases as the beam size increases. We again note that the translations generated by range voting with asymmetric similarity metrics are on average longer, except for MBR where the asymmetry in the similarity metric penalises longer candidates. However, it is no longer the case that increasing the beam size also increases the length of the translations generated by range voting.
4.2.3 Translation diversity
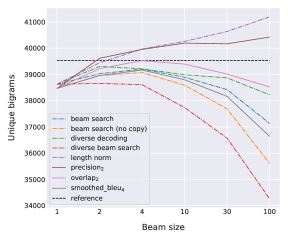
The numbers of distinct bigrams generated are shown in Figure 2. Out of diverse decoding and diverse beam search, which aim to increase diversity within a beam, only diverse decoding increases the number of generated bigrams compared to beam search. Length normalisation generates the most unique bigrams, and this increases with beam size, also due to the translations being longer on average. On the other hand, the copy filtering heuristic decreases the number of distinct bigrams generated. Just as for image captioning, range voting increases the diversity of the generated translations. For all similarity metrics, more unique bigrams are generated than beam search with copy filtering (on top of which range voting was applied). Furthermore, the simple n-gram metrics generate more unique bigrams than standard beam search, recovering the drop occurring for the filtering heuristic.
4.2.4 Human evaluation
We used a human evaluation to investigate differences not reflected by BLEU. For 500 sentences, we compared the strongest baseline (length normalisation, ) with range voting (, , as this performed well on BLEU, length, and diversity), following the procedure as in §4.1.4. The voted translation was rated better 69 times, and worse 44 times. This is statistically significant, with for a two-tailed sign test. For translations rated much better, the difference is not significant (36 better, 28 worse).
4.2.5 Including more voters
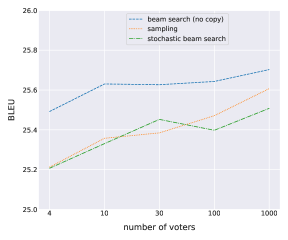
The range voting formulation doesn’t require the set of candidates and voters to be the same (see Equation 1). We can capture more knowledge from the underlying distribution by using a larger and more diverse set of voters (and could be acquired more efficiently by repeatedly sampling) whilst constraining the set of candidates to avoid model errors. This was similarly done by Tromble et al. (2008), who refer to the sets of voters and candidates as the “evidence” and “hypothesis” spaces.
For the voters, we increase from 4 to 1000 and apply 3 different search methods: sampling times, stochastic beam search (Kool et al., 2019), and beam search with copy filtering. For the candidates we use beam search with copy filtering and . We fix the similarity metric to , which was the best performing metric for large ( §4.2.1).
For all 3 generation methods, increasing the number of voters increases BLEU (Figure 3), suggesting that the previous drop in performance is due to worse candidates in larger beams, rather than worse voter preferences.
5 Conclusion
Instead of generating the most likely sequence, we propose a method to generate the most representative sequence, formalising representativeness using a similarity measure and range voting.
The evaluation on image captioning and machine translation shows that despite using simple similarity measures, we achieve an increase in BLEU score, an increase in caption length and diversity, and statistically significantly better human evaluation performance on both tasks.
For the image captioning task, performance of our method does not drop as beam size increases, removing the sensitivity of results to this hyperparameter. On the machine translation task, performance does drop for larger beam sizes, although by much less than with standard beam search or the baselines. Furthermore, performance increases as the number of voters increases, for a fixed set of candidates.
Using better similarity measures that capture semantics could further improve results and is a promising direction for further research.
Finally, our approach can be applied to any probabilistic language model, without any need for additional training. This opens up many other tasks, including summarisation, dialogue systems, and question answering. If multiple outputs can be used (e.g. offering options to a user), our method can be extended to use reweighted range voting (Smith, 2005), a procedure that elects multiple candidates.
Acknowledgements
We would like to thank Kris Cao for discussions about distributions over sequences, which prompted the initial idea for this project. We would like to thank Dr. Robert Harle and Prof. Ann Copestake for making this project possible, and for providing some early feedback. We would like to thank Andreas Vlachos, Guy Aglionby, James Thorne, Chris Davis, and the NLIP reading group in Cambridge, for feedback on earlier drafts of this paper. Finally, we would like to thank Chris Dyer for his insightful comments and suggestions.
References
- Achananuparp et al. (2008) Palakorn Achananuparp, Xiaohua Hu, and Xiajiong Shen. 2008. The evaluation of sentence similarity measures. In Proceedings of the 10th International Conference on Data Warehousing and Knowledge Discovery, pages 305–316. Springer.
- Bird et al. (2009) Steven Bird, Ewan Klein, and Edward Loper. 2009. Natural Language Processing with Python: Analyzing Text with the Natural Language Toolkit. O’Reilly Media Inc.
- Blain et al. (2017) Frédéric Blain, Lucia Specia, and Pranava Madhyastha. 2017. Exploring hypotheses spaces in neural machine translation. In Proceedings of the 16th Machine Translation Summit (MT Summit XVI). Asia-Pacific Association for Machine Translation (AAMT).
- Bojar et al. (2014) Ondřej Bojar, Christian Buck, Christian Federmann, Barry Haddow, Philipp Koehn, Johannes Leveling, Christof Monz, Pavel Pecina, Matt Post, Herve Saint-Amand, et al. 2014. Findings of the 2014 Workshop on Statistical Machine Translation. In Proceedings of the Ninth Workshop on Statistical Machine Translation, pages 12–58.
- Brown et al. (1995) Peter F Brown, John Cocke, Stephen A Della Pietra, Vincent J Della Pietra, Frederick Jelinek, Jennifer C Lai, and Robert L Mercer. 1995. Method and system for natural language translation. US Patent 5,477,451.
- Callison-Burch et al. (2006) Chris Callison-Burch, Miles Osborne, and Philipp Koehn. 2006. Re-evaluation the role of BLEU in machine translation research. In Proceedings of the 11th Conference of the European Chapter of the Association for Computational Linguistics (EACL).
- Cao and Clark (2017) Kris Cao and Stephen Clark. 2017. Latent variable dialogue models and their diversity. In Proceedings of the 15th Conference of the European Chapter of the Association for Computational Linguistics (EACL).
- Cer et al. (2017) Daniel Cer, Mona Diab, Eneko Agirre, Iñigo Lopez-Gazpio, and Lucia Specia. 2017. SemEval-2017 task 1: Semantic textual similarity multilingual and crosslingual focused evaluation. In Proceedings of the 11th International Workshop on Semantic Evaluation (SemEval-2017), pages 1–14.
- Chen et al. (2018) Yining Chen, Sorcha Gilroy, Kevin Knight, and Jonathan May. 2018. Recurrent neural networks as weighted language recognizers. In Proceedings of the 2018 Conference of the North American Chapter of the Association for Computational Linguistics: Human Language Technologies (Volume 1: Long Papers), pages 2261–2271.
- Cohen and Beck (2019) Eldan Cohen and Christopher Beck. 2019. Empirical analysis of beam search performance degradation in neural sequence models. In Proceedings of the 36th International Conference on Machine Learning, volume 97 of Proceedings of Machine Learning Research, pages 1290–1299. PMLR.
- Dhingra et al. (2017) Bhuwan Dhingra, Lihong Li, Xiujun Li, Jianfeng Gao, Yun-Nung Chen, Faisal Ahmed, and Li Deng. 2017. Towards end-to-end reinforcement learning of dialogue agents for information access. In Proceedings of the 55th Annual Meeting of the Association for Computational Linguistics (Volume 1: Long Papers), pages 484–495. Association for Computational Linguistics.
- Eikema and Aziz (2020) Bryan Eikema and Wilker Aziz. 2020. Is MAP decoding all you need? the inadequacy of the mode in neural machine translation. Unpublished manuscript, arXiv preprint 2005.10283v1.
- Emerson and Simon (1979) John D Emerson and Gary A Simon. 1979. Another look at the sign test when ties are present: The problem of confidence intervals. The American Statistician, 33(3):140–142.
- Fan et al. (2018) Angela Fan, Mike Lewis, and Yann Dauphin. 2018. Hierarchical neural story generation. In Proceedings of the 56th Annual Meeting of the Association for Computational Linguistics (Volume 1: Long Papers), pages 889–898. Association for Computational Linguistics.
- Freitag and Al-Onaizan (2017) Markus Freitag and Yaser Al-Onaizan. 2017. Beam search strategies for neural machine translation. In Proceedings of the First Workshop on Neural Machine Translation, pages 56–60.
- Freitag et al. (2019) Markus Freitag, Isaac Caswell, and Scott Roy. 2019. APE at scale and its implications on MT evaluation biases. In Proceedings of the Fourth Conference on Machine Translation (Volume 1: Research Papers), pages 34–44.
- Freitag et al. (2020) Markus Freitag, David Grangier, and Isaac Caswell. 2020. BLEU might be guilty but references are not innocent. Unpublished manuscript, arXiv preprint 2004.06063v1.
- Heckscher (1892) Albert Gottlieb Heckscher. 1892. Bidrag til grundlæggelse af en afstemningslære. Om methoderne ved udfindelse af stemmerflerhed i parlamenter (afsteming over ændringforslag m.v.) ved valg og domstole. Ph.D. thesis, University of Copenhagen.
- Hochreiter and Schmidhuber (1997) Sepp Hochreiter and Jürgen Schmidhuber. 1997. Long Short-Term Memory. Neural Computation, 9(8):1735–1780.
- Holmqvist et al. (2009) Maria Holmqvist, Sara Stymne, Jody Foo, and Lars Ahrenberg. 2009. Improving alignment for smt by reordering and augmenting the training corpus. In Proceedings of the Fourth Workshop on Statistical Machine Translation, pages 120–124. Association for Computational Linguistics.
- Holtzman et al. (2020) Ari Holtzman, Jan Buys, Maxwell Forbes, and Yejin Choi. 2020. The curious case of neural text degeneration. In Proceedings of the 8th International Conference on Learning Representations (ICLR).
- Ioffe and Szegedy (2015) Sergey Ioffe and Christian Szegedy. 2015. Batch normalization: Accelerating deep network training by reducing internal covariate shift. In Proceedings of the 32nd International Conference on Machine Learning, volume 37 of Proceedings of Machine Learning Research, pages 448–456.
- Koehn (2004a) Philipp Koehn. 2004a. Pharaoh: a beam search decoder for phrase-based statistical machine translation models. In Conference of the Association for Machine Translation in the Americas, pages 115–124. Springer.
- Koehn (2004b) Philipp Koehn. 2004b. Statistical significance tests for machine translation evaluation. In Proceedings of the 2004 conference on empirical methods in natural language processing (EMNLP), pages 388–395.
- Koehn and Knowles (2017) Philipp Koehn and Rebecca Knowles. 2017. Six challenges for neural machine translation. In First Workshop on Neural Machine Translation, pages 28–39. Association for Computational Linguistics.
- Kool et al. (2019) Wouter Kool, Herke Van Hoof, and Max Welling. 2019. Stochastic beams and where to find them: The Gumbel-top-k trick for sampling sequences without replacement. In Proceedings of the International Conference on Machine Learning, pages 3499–3508.
- Kumar and Byrne (2004) Shankar Kumar and William Byrne. 2004. Minimum Bayes-Risk decoding for statistical machine translation. In Proceedings of the Human Language Technology Conference of the North American Chapter of the Association for Computational Linguistics: HLT-NAACL 2004, pages 169–176.
- Kuncheva (2004) Ludmila I. Kuncheva. 2004. Combining Pattern Classifiers: Methods and Algorithms. John Wiley & Sons.
- Kuncheva and Rodríguez (2014) Ludmila I. Kuncheva and Juan J Rodríguez. 2014. A weighted voting framework for classifiers ensembles. Knowledge and Information Systems, 38(2):259–275.
- Kurokawa et al. (2009) David Kurokawa, Cyril Goutte, and Pierre Isabelle. 2009. Automatic detection of translated text and its impact on machine translation. In Proceedings of the 12th Machine Translation Summit (MT Summit XII). Association for Machine Translation in the Americas.
- Lagerspetz (2016) Eerik Lagerspetz. 2016. Social Choice and Democratic Values. Springer.
- Lembersky et al. (2012) Gennadi Lembersky, Noam Ordan, and Shuly Wintner. 2012. Language models for machine translation: Original vs. translated texts. Computational Linguistics, 38(4):799–825.
- Li et al. (2016a) Jiwei Li, Michel Galley, Chris Brockett, Jianfeng Gao, and Bill Dolan. 2016a. A diversity-promoting objective function for neural conversation models. In Proceedings of the 2016 Conference of the North American Chapter of the Association for Computational Linguistics: Human Language Technologies (Volume 1: Long Papers), pages 110–119.
- Li and Jurafsky (2016) Jiwei Li and Dan Jurafsky. 2016. Mutual information and diverse decoding improve neural machine translation. Unpublished manuscript, arXiv preprint 1601.00372v2.
- Li et al. (2016b) Jiwei Li, Will Monroe, and Dan Jurafsky. 2016b. A simple, fast diverse decoding algorithm for neural generation. Unpublished manuscript, arXiv preprint 1611.08562v2.
- Lin et al. (2014) Tsung-Yi Lin, Michael Maire, Serge Belongie, James Hays, Pietro Perona, Deva Ramanan, Piotr Dollár, and C Lawrence Zitnick. 2014. Microsoft COCO: Common objects in context. In European Conference on Computer Vision, pages 740–755. Springer.
- Mueller and Thyagarajan (2016) Jonas Mueller and Aditya Thyagarajan. 2016. Siamese recurrent architectures for learning sentence similarity. In Proceedings of the 30th AAAI Conference on Artificial Intelligence.
- Ott et al. (2018) Myle Ott, Michael Auli, David Grangier, and Marc’Aurelio Ranzato. 2018. Analyzing uncertainty in neural machine translation. In Proceedings of the 35th International Conference on Machine Learning (ICML).
- Papineni et al. (2002) Kishore Papineni, Salim Roukos, Todd Ward, and Wei-Jing Zhu. 2002. BLEU: a method for automatic evaluation of machine translation. In Proceedings of the 40th Annual Meeting of the Association for Computational Linguistics, pages 311–318.
- Pawar and Mago (2019) Atish Pawar and Vijay Mago. 2019. Challenging the boundaries of unsupervised learning for semantic similarity. IEEE Access, 7.
- Post (2018) Matt Post. 2018. A call for clarity in reporting BLEU scores. In Proceedings of the Third Conference on Machine Translation: Research Papers, pages 186–191. Association for Computational Linguistics.
- Sennrich et al. (2016) Rico Sennrich, Barry Haddow, and Alexandra Birch. 2016. Neural machine translation of rare words with subword units. In Proceedings of the 54th Annual Meeting of the Association for Computational Linguistics (Volume 1: Long Papers), pages 1715–1725.
- Shimizu et al. (2012) Hiroaki Shimizu, Masao Utiyama, Eiichiro Sumita, and Satoshi Nakamura. 2012. Minimum Bayes-Risk decoding extended with similar examples: NAIST-NICT at IWSLT 2012. In International Workshop on Spoken Language Translation (IWSLT) 2012.
- Smith (2000) Warren D. Smith. 2000. Range voting. Unpublished manuscript.
- Smith (2005) Warren D. Smith. 2005. Reweighted range voting – new multiwinner voting method. Unpublished manuscript.
- Stahlberg and Byrne (2019) Felix Stahlberg and Bill Byrne. 2019. On NMT search errors and model errors: Cat got your tongue? In Proceedings of the 2019 Conference on Empirical Methods in Natural Language Processing and the 9th International Joint Conference on Natural Language Processing (EMNLP-IJCNLP), pages 3347–3353.
- Szegedy et al. (2016) Christian Szegedy, Vincent Vanhoucke, Sergey Ioffe, Jon Shlens, and Zbigniew Wojna. 2016. Rethinking the inception architecture for computer vision. In Proceedings of the IEEE Conference on Computer Vision and Pattern Recognition, pages 2818–2826. Institute of Electrical and Electronics Engineers.
- Tideman (1987) Nicolaus Tideman. 1987. Independence of clones as a criterion for voting rules. Social Choice and Welfare, 4(3):185–206.
- Tideman (2006) Nicolaus Tideman. 2006. Collective Decisions and Voting: The Potential for Public Choice. Routledge.
- Tromble et al. (2008) Roy Tromble, Shankar Kumar, Franz Och, and Wolfgang Macherey. 2008. Lattice Minimum Bayes-Risk decoding for statistical machine translation. In Proceedings of the 2008 Conference on Empirical Methods in Natural Language Processing, pages 620–629. Association for Computational Linguistics.
- Tu et al. (2017) Zhaopeng Tu, Yang Liu, Lifeng Shang, Xiaohua Liu, and Hang Li. 2017. Neural machine translation with reconstruction. In Proceedings of the 31st AAAI Conference on Artificial Intelligence.
- Vaswani et al. (2018) Ashish Vaswani, Samy Bengio, Eugene Brevdo, Francois Chollet, Aidan Gomez, Stephan Gouws, Llion Jones, Łukasz Kaiser, Nal Kalchbrenner, Niki Parmar, Ryan Sepassi, Noam Shazeer, and Jakob Uszkoreit. 2018. Tensor2Tensor for neural machine translation. In Proceedings of the 13th Conference of the Association for Machine Translation in the Americas (Volume 1: Research Papers), pages 193–199.
- Vaswani et al. (2017) Ashish Vaswani, Noam Shazeer, Niki Parmar, Jakob Uszkoreit, Llion Jones, Aidan N Gomez, Łukasz Kaiser, and Illia Polosukhin. 2017. Attention is all you need. In Advances in neural information processing systems, pages 5998–6008.
- Vijayakumar et al. (2018) Ashwin Vijayakumar, Michael Cogswell, Ramprasaath Selvaraju, Qing Sun, Stefan Lee, David Crandall, and Dhruv Batra. 2018. Diverse beam search for improved description of complex scenes.
- Vinyals et al. (2015) Oriol Vinyals, Alexander Toshev, Samy Bengio, and Dumitru Erhan. 2015. Show and tell: A neural image caption generator. In Proceedings of the 2015 IEEE Conference on Computer Vision and Pattern Recognition (CVPR), pages 3156–3164. Institute of Electrical and Electronics Engineers.
- Vinyals et al. (2017) Oriol Vinyals, Alexander Toshev, Samy Bengio, and Dumitru Erhan. 2017. Show and tell: Lessons learned from the 2015 MSCOCO image captioning challenge. IEEE Transactions on Pattern Analysis and Machine Intelligence, 39(4):652–663.
- Wu et al. (2016) Yonghui Wu, Mike Schuster, Zhifeng Chen, Quoc V Le, Mohammad Norouzi, Wolfgang Macherey, Maxim Krikun, Yuan Cao, Qin Gao, Klaus Macherey, Klingner Jeff, Shah Apurva, Johnson Melvin, Liu Xiaobing, Kaiser Łukasz, Gouws Stephan, Kato Yoshikiyo, Kudo Taku, Kazawa Hideto, Stevens Keith, Kurian George, Patil Nishant, Wang Wei, Young Cliff, Smith Jason, Riesa Jason, Rudnick Alex, Vinyals Oriol, Corrado Greg, Hughes Macduff, and Dean Jeffrey. 2016. Google’s neural machine translation system: Bridging the gap between human and machine translation. Unpublished manuscript, arXiv preprint 1609.08144v2.
- Xu et al. (2018) Xinnuo Xu, Ondřej Dušek, Ioannis Konstas, and Verena Rieser. 2018. Better conversations by modeling, filtering, and optimizing for coherence and diversity. In Proceedings of the 2018 Conference on Empirical Methods in Natural Language Processing (EMNLP), pages 3981–3991.
- Xu et al. (2017) Zhen Xu, Bingquan Liu, Baoxun Wang, SUN Chengjie, Xiaolong Wang, Zhuoran Wang, and Chao Qi. 2017. Neural response generation via GAN with an approximate embedding layer. In Proceedings of the 2017 Conference on Empirical Methods in Natural Language Processing (EMNLP), pages 617–626.
Appendix A Translation length and diversity
| Average translation length | ||||||
|---|---|---|---|---|---|---|
| Beam size | 1 | 2 | 4 | 10 | 30 | 100 |
| Beam search | 19.74 | 19.53 | 19.42 | 19.15 | 18.88 | 17.99 |
| \hdashlineLength norm. | 19.74 | 19.86 | 20.02 | 20.19 | 20.36 | 21.09 |
| Diverse decoding | 19.74 | 19.57 | 19.38 | 19.19 | 19.08 | 18.69 |
| Diverse beam search | 19.74 | 19.33 | 19.13 | 18.60 | 17.93 | 16.68 |
| Beam search (no copy) | 19.66 | 19.50 | 19.39 | 19.09 | 18.73 | 17.59 |
| \hdashline | 19.66 | 19.79 | 19.86 | 19.93 | 20.03 | 19.96 |
| 19.66 | 19.79 | 19.86 | 19.93 | 20.03 | 19.96 | |
| 19.66 | 19.69 | 19.70 | 19.67 | 19.61 | 19.39 | |
| 19.66 | 19.95 | 19.98 | 20.09 | 20.21 | 20.36 | |
| 19.66 | 19.50 | 19.48 | 19.31 | 19.12 | 18.27 | |
| \hdashline (MBR) | 19.66 | 19.50 | 19.46 | 19.28 | 19.06 | 18.18 |
| (MBR) | 19.66 | 19.50 | 19.46 | 19.28 | 19.06 | 18.30 |
| Number of distinct bigrams | ||||||
|---|---|---|---|---|---|---|
| Beam size | 1 | 2 | 4 | 10 | 30 | 100 |
| Beam search | 38629 | 39029 | 39205 | 38894 | 38424 | 37135 |
| \hdashlineLength normalisation | 38629 | 39445 | 39971 | 40263 | 40638 | 41195 |
| Diverse decoding | 38629 | 39307 | 39217 | 38989 | 38870 | 38227 |
| Diverse beam search | 38629 | 38661 | 38611 | 37740 | 36575 | 34266 |
| Beam search (no copy) | 38473 | 38956 | 39073 | 38593 | 37694 | 35609 |
| \hdashline | 38473 | 39353 | 39743 | 39775 | 39636 | 39334 |
| 38473 | 39354 | 39739 | 39772 | 39634 | 39334 | |
| 38473 | 39221 | 39528 | 39396 | 39015 | 38526 | |
| 38473 | 39617 | 39955 | 40195 | 40170 | 40426 | |
| 38473 | 38956 | 39223 | 38930 | 38277 | 36787 | |
| \hdashline (MBR) | 38473 | 38957 | 39157 | 38792 | 38166 | 36564 |
| (MBR) | 38473 | 38961 | 39169 | 38799 | 38166 | 36645 |