Universal fluctuations in the bulk of Rayleigh-Bénard turbulence
Abstract
We present an investigation of the root-mean-square (rms) temperature and the rms velocity in the bulk of Rayleigh-Bénard turbulence, using new experimental data from the current study and experimental and numerical data from previous studies. We find that, once scaled by the convective temperature , the value of at the cell centre is a constant, i.e. , over a wide range of the Rayleigh number () and the Prandtl number (), and is independent of the surface topographies of the top and bottom plates of the convection cell. A constant close to unity suggests that is a proper measure of the temperature fluctuation in the core region. On the other hand, , the vertical rms velocity at the cell centre scaled by the convective velocity , shows a weak -dependence () over at and is independent of plate topography. Similar to a previous finding by He & Xia (Phys. Rev. Lett., vol. 122, 2019, 014503), we find that the rms temperature profile in the region of the mixing zone with a mean horizontal shear exhibits a power-law dependence on the distance from the plate, but now the universal profile applies to both smooth and rough surface topographies and over a wider range of . The vertical rms velocity profile obey a logarithmic dependence on . The study thus demonstrates that the typical scales for the temperature and the velocity are the convective temperature and the the convective velocity , respectively. Finally, we note that may be utilised to study the flow regime transitions in the ultra-high--number turbulent convection.
1 Introduction
Rayleigh-Bénard convection (RBC), a fluid layer confined between two plates heated from below and cooled from above, continues to attract attention not only because of its relevance to geophysical and astrophysical flows, but also owing to the fact that it’s an idealised model for the study of thermally driven turbulence (for reviews, see, for example, Ahlers, Grossmann & Lohse (2009); Lohse & Xia (2010); Chillà & Schumacher (2012); Xia (2013)). In RBC, buoyancy injects energy into the turbulence and creates vigorous velocity and temperature fluctuations. Understanding the dynamics of these fluctuations has been one of the central issues (Grossmann & Lohse, 2004). The RBC system is controlled by two dimensionless parameters, i.e. the Rayleigh number and the Prandtl number , where is the gravitational acceleration constant, the height of the convection cell, the temperature difference across the top and bottom plates, and are the thermal expansion coefficient, the thermal diffusivity and the kinematic viscosity of the working fluid, respectively.
Two turbulence states with different probability density functions (PDFs) of the temperature at the cell centre were observed in turbulent RBC, i.e. a ‘soft turbulence’ state with a Gaussian PDF and a ‘hard turbulence’ state with an exponential PDF (Heslot, Castaing & Libchaber, 1987). In the latter, the temperature fluctuation normalised by obeys a power law with . A mixing-length model was proposed to explain this dependence (Castaing et al., 1989). However, later studies show that not only depends on but also on the plate topography even for the most widely studied aspect-ratio-unity cylindrical cells (see table 1 for a summary). It is thus natural to ask is there any universal behaviours of the temperature fluctuations in the bulk flow.
In addition to the value of at the cell centre, the functional form of the root-mean-square (rms) temperature profile is also of great interest as its shape determines the transport properties across the boundary. Based on different assumptions of the local force balance, theory predicts different profiles of (Adrian, 1996). Only very recently, a clear understanding of is obtained (He & Xia, 2019): While in a region with mean horizontal shear (the viscous force balances the inertia force), obeys a power-law dependence on ; in regions with abundant plume emissions (the buoyancy balances the inertia force), is in a logarithmic form, which are true for idealised case, i.e. turbulent RBC in cells with smooth surfaces (“smooth cell”). With the presence of roughness on the top and bottom boundaries (“rough cell”), enhances considerably (Du & Tong, 2001). An interesting question is will show universal behaviours in cells with different plate topographies? In addition to the shape of , there is no generally accepted characteristic temperature scale in the bulk. For instance, has been widely used as a typical temperature scale, but the maximum value is also used sometimes (see, for example, Wang et al. (2018)). The -dependence of scaled by different scales exhibit different features: While for different differs (Sun, Cheung & Xia (2008); Ahlers et al. (2012)), for different collapses better in the mixing zone. Therefore, the typical temperature scale in the bulk is not clear at present.
Compared to numerous studies on temperature fluctuations, the investigation on velocity fluctuations in turbulent RBC is scarce. The velocity fluctuation is usually studied in terms of a Reynolds number based on the vertical rms velocity , i.e. . It is found that scales with to a 0.5 power law, consistent with the free-fall like argument (Shen, Xia & Tong (1995); Daya & Ecke (2001); Qiu et al. (2004); Shang, Tong & Xia (2008)). To the best of our knowledge, there is almost no direct measurement of velocity fluctuations in rough cells. The typical velocity scale in the bulk flow also remains to be explored.
In this paper, we present an investigation of the temperature and the velocity fluctuations in the bulk of turbulent RBC. We demonstrate that the typical temperature and velocity scales in the bulk are, respectively, the convective temperature and the convective velocity . Once scaled by these quantities, the fluctuations in the bulk exhibit universal behaviours. These findings shed new light on the bulk dynamics in convective turbulence.
2 The experimental setup and relevant parameters
| Ref. | Geometry | Surface type | ||||
| 0.7 | 0.36 | -0.147 | Cylinder | S | ||
| 0.7 | 0.37 | -0.145 | Cylinder | S | ||
| 5.4 | 0.192 | -0.14 | Cylinder | R | ||
| 5.46 | N.A. | -0.10 | Cylinder | S | ||
| 5.46 | N.A. | -0.48 | Cube | S | ||
| 7 | 5.9 | -0.35 | Cube | S | ||
| 5.2 | N.A. | -0.18 | Cylinder | S | ||
| 4.3 | -0.1 | Cylinder | S & R | |||
| 4.3 | 9.38 | -0.35 | Cube | S | ||
| 12.3 | N.A. | -0.17 | Cylinder | S | ||
| 23.34 | Cylinder | R | ||||
| present | 4.3 | Cylinder | S & R |
The experiment was carried out in an upright cylindrical cell with an aspect ratio , where mm is the cell diameter and mm is its height. The design and construction of the cell can be found in Xie & Xia (2017). We mention only its essential features here. The cell consists of three parts, i.e. a copper top plate, a copper bottom plate and a Plexiglas sidewall. The bottom plate was heated by rubber electrical heaters and the top plate was cooled by passing temperature controlled water through a chamber fitted onto its top surface. The temperature of the top (bottom) plate was measured using four (five) thermistors from which we calculated , and the Nusselt number , where is the heat flux supplied at the bottom plate and the thermal conductivity of the fluid. Deionzed and degassed water was used as the working fluid with a mean fluid temperature kept at a constant of . Thus the Prandtl number was . By changing , we achieved a range of . To study the effects of wall roughness on the fluctuations of the temperature and the velocity, another set of measurements in a rough cell were made. The roughness elements were in the form of square-latticed pyramids with a height of 8 mm. The heat transport in rough cells show three regimes depending on (Xie & Xia, 2017). The range in the present study in the rough cell is in the heat-transport-enhanced regimes.
The temperature fluctuation, , inside the cell was measured using a waterproof thermistor with a head diameter of mm and a response time of ms, where stands for time averaging. Two sets of temperature fluctuation measurements were made. In the first set, the temperature fluctuations at the centre of the smooth cell and the rough cell were measured as a function of . In the second set, the vertical rms temperature profiles were measured in the rough cell. The location of mm was set at the valley of the roughness elements on the bottom plate. At each vertical position , temperature time trace was measured for one-hour with a sampling rate of 15 Hz. Good care was taken to ensure that the system was isolated from the surrounding temperature variations. For the detailed thermal isolation method, we refer to Xie, Ding & Xia (2018).
The vertical velocity fluctuation, characterised by a Reynolds number , was measured at the centre of the rough cell, using a laser Doppler velocimeter (LDV). Here is the vertical rms velocity. The flow was seeded with tracer particles with a diameter of 2.893 m. The LDV sampling rate was 30 Hz. Typical measurement lasted for 12 hours to obtain sufficient statistics of the second-order quantity like the rms velocity.
Consider the region outside the boundary layers, the relevant physical parameters governing the flow dynamics are , and , where is the specific heat flux, and are, respectively, the density and the specific heat capacity of the working fluid. A simple dimensional analysis yields the convective temperature and the convective velocity : and (Deardorff, 1970). The two scales can be expressed in dimensionless forms in terms of , and :
| (1) |
3 Results and discussions
3.1 The temperature fluctuation in the bulk
We first study the rms temperature profiles. Figures 1() show normalised, respectively, by the temperature difference across the top and bottom plates and the convective temperature measured in the rough cell for and . The rms temperatures () measured at the centre of the smooth cell for are plotted as hexagons. For comparison, we also plot in these figures measured in smooth cells from Du & Tong (2000) at and from Wei et al. (2014) at . The horizontal axes are normalised by .
It is seen that the profiles measured in either a smooth cell or a rough cell for different collapse onto each other outside the thermal boundary layer (TBL). With increasing , increases to a maximum and then decreases gradually when moving towards the cell centre. These observations are in general consistent with earlier studies (Lui & Xia, 1998). However, considerable differences between measured in smooth cells and in rough cells are observed (figure 1). First, the outer edge of the TBL, i.e. the peak position of , is shifted towards the cell centre, which is because the motionless fluids trapped in the bottom of valleys between roughness elements have very small temperature fluctuations. Second, enhances considerably near the edge of the TBL in rough cells owing to more thermal plumes being emitted from the tip of roughness elements. This enhancement is also true at the cell centre since the data in the smooth cell are systematically smaller than those in the rough cell. However, we note, even for a smooth cell, Ahlers et al. (2012) showed that for different does not collapse in the classical regime of turbulent RBC. The above results suggest that is not the suitable characteristic scale for . When scaled with , the temperature fluctuations at the cell centre, for both the smooth and the rough cells, collapse onto each other (but not for the profile in the mixing zone), and the magnitude of the fluctuation at the edge of the TBL also becomes comparable in two cases (figure 1). To compare directly the rms temperature profiles in the bulk region, in figures 1, the distance of the data measured in the rough cells is offset by the roughness height . Remarkably, compared with (figure 1), in smooth and rough cells collapses onto each other outside the TBL (figure 1), suggesting that is a characteristic temperature scale in the bulk of turbulent convection.
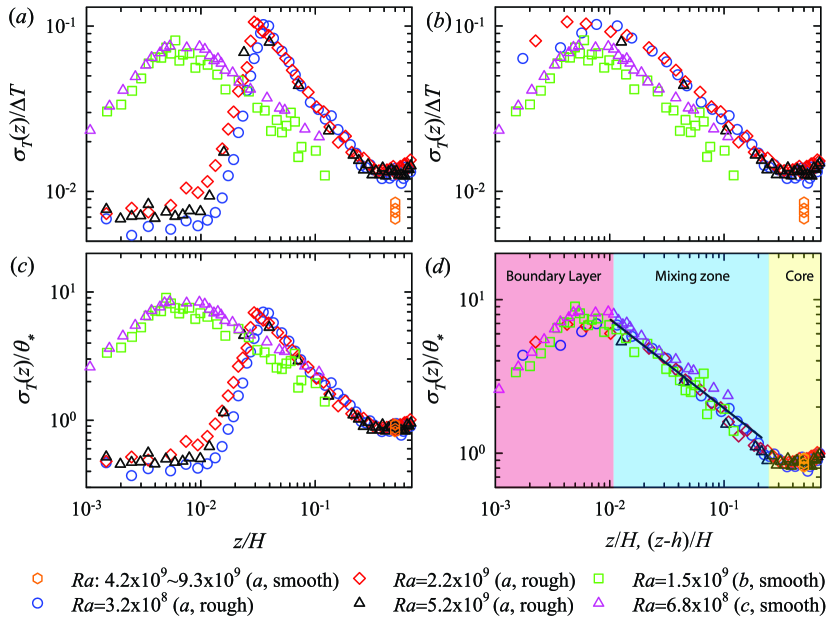
We now examine the universal profiles shown in figure 1() in detail. They can be divided into three regions, i.e. a TBL region, a mixing zone, and a core region, which are marked with different background colours. In the mixing zone spanning , a power law fits the data nicely. This scaling exponent is consistent with results in literature (Wei & Ahlers, 2016; Wang et al., 2018; He & Xia, 2019), and also close to the theoretical prediction of by Adrian (1996). This observation further supports that obeys a power-law decay in a region where a mean horizontal shear exists, and it is true for both smooth cells and rough cells. In the core region (), is nearly a constant independent of and the plate topography, suggesting a universal temperature fluctuation here.
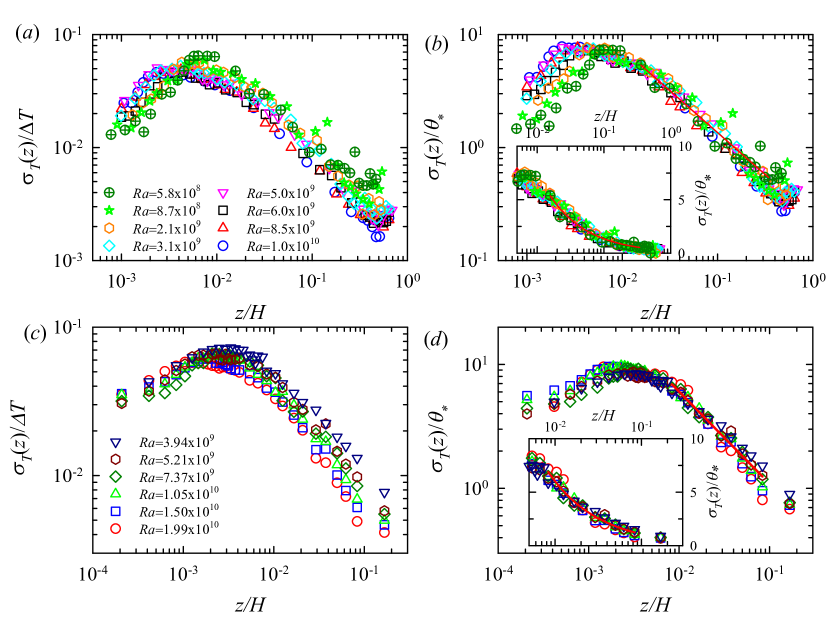
We next test the convective temperature in other cell geometries. Figures 2() show normalised respectively by and measured along the centreline in a cubic cell. The rms temperature profiles obtained along the cell centreline in a rectangular cell are shown in figures 2. The data in the cubic cell are taken from Wang & Xia (2003) and those in the rectangular cell are from Sun et al. (2008). Let’s focus on the cubic case first. It is seen that the originally -dependent profiles (figure 2) collapse onto each other once they are scaled by (figure 2). The solid line in figure 2() is a power law fit to the data in the range , yielding . Note that for different do not collapse inside the TBL. This is because is a temperature scale for the bulk, so is not applicable in the near wall region where the viscosity and the thermal diffusivity dominate the dynamics. Similar behaviours are observed in the rectangular cell, i.e. when compared with , the collapses better for different , and it can be fitted by a power-law with a scaling exponent of in the mixing zone. The insets of figures 2() plot the same data as the main figures but in log-linear plots. They clearly show that these profiles cannot be fitted by logarithmic functions. Note that the scaling exponent is different from the cylindrical cells, suggesting that turbulent fluctuations in the bulk are cell-geometry-dependent, which may be partially attributed to the geometry-dependence of the large-scale flow dynamics.
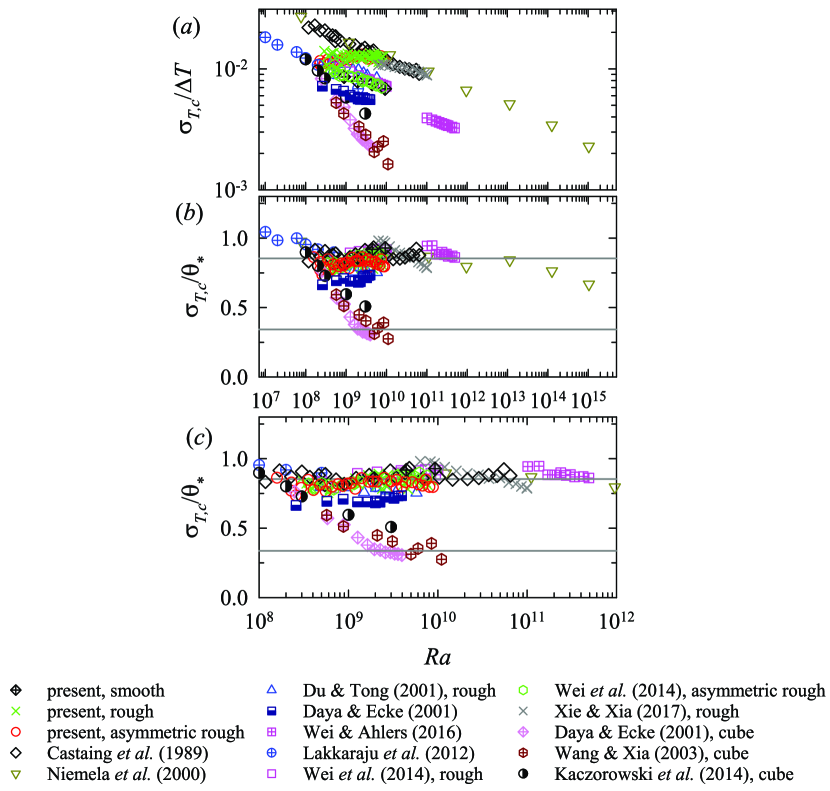
As in the core region is a constant (figure 1), we next focus on its value at the cell centre. Figure 3() plots versus measured in smooth cells and rough cells from present study. For comparison, adopted from a number of sources are also shown. These data span and , and were measured in smooth cells and rough cells. Details about their , , scaling property and cell type can be found in table 1.
When scaled with , both the magnitude and the scaling property of are seen to vary dramatically among different experiments (figure 3). The data reveal that generally decreases with . Present measurements in rough cells even show a positive , i.e. . Figure 3() plots the same data as those in figure 3(), but scaled with and figure 3() shows a zoomed region with . To obtain , we first took published data of as a function of and from the cited references, then calculated using equation 1 with , and that were measured together with . The ratio is therefore .
We first look at data measured in cylindrical cells. It is seen that from different experiments collapses around a straight line for (in the so-called ‘hard turbulence’ regime), suggesting the existence of a universal constant. The upper solid line in figure 3() marks the mean value, i.e. . A mean value close to unity suggests that is indeed a representative temperature in the core region. This universal constant indicates that a common mechanism governs temperature fluctuation dynamics in the core region.
For measured in cubic cells, one sees that they decrease with for and appear to reach another plateau around afterwards (the lower solid line in figure 3). If this feature can be verified by data for higher , then this means the above constant is cell geometry dependent. This dependence may be a result of the different azimuthal dynamics of the large-scale flow in the two geometries. A previous study suggests that the scaling of temperature fluctuations depend on cell geometry (Daya & Ecke, 2001). Now one sees that reaches different plateaus in cells with different geometries. It can thus be used to characterise and quantify the level of turbulent fluctuations in different cell geometries. The apparent different behaviours in the bulk fluctuation remain to be explained. We note a potential application of the above result is in cases where it is difficult to measure directly. In such situations, one can use the global quantities like , and to obtain an estimate of the level of turbulent fluctuations in the core region.
3.2 The vertical velocity fluctuation in the bulk
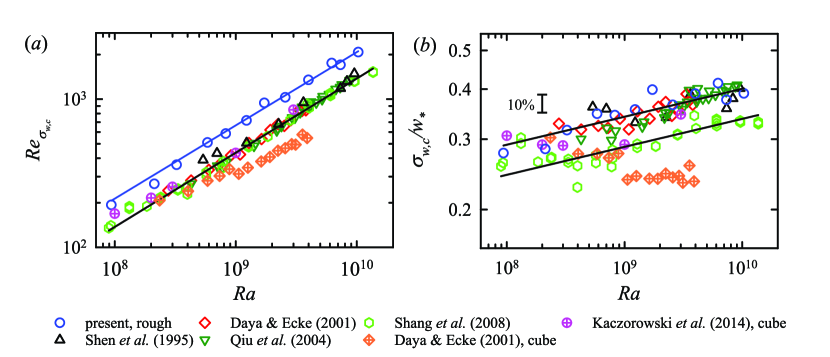
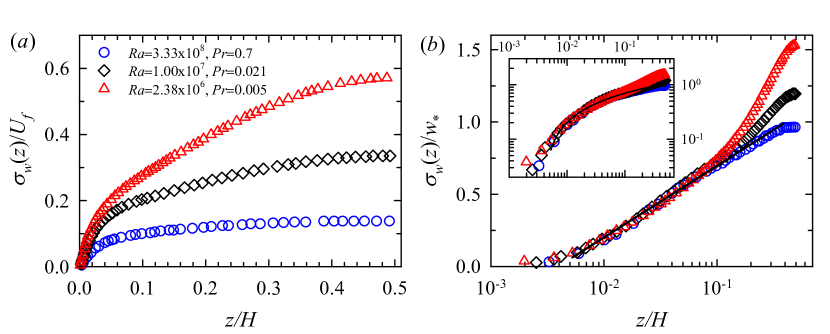
We study the velocity fluctuations in this section. Figure 4() shows the Reynolds number based on the vertical velocity fluctuation measured at the centre of the rough cell. For comparison, obtained in smooth cells from Shen et al. (1995), Daya & Ecke (2001), Qiu et al. (2004) and Shang et al. (2008) in cylinders and from Daya & Ecke (2001) and Kaczorowski et al. (2014) in cubes are also shown. The in both smooth and rough cells with can be described by power laws, i.e. (rough cell) and (smooth cell). Note a transition is seen for in the data obtained in a cube by Daya & Ecke (2001), implying a geometry dependence of the velocity fluctuation. As these data are taken in a cell with , they are not used in the fitting. The velocity fluctuations in the rough cell are enhanced by 50% when compared with those in smooth cells. This directly confirms that not only the temperature fluctuations are enhanced in a rough cell, but also the velocity fluctuations.
To test if the convective velocity is a characteristic scale for velocity in the core region, we study . The is obtained by that we first calculating , and then using equation 1 with , and that were measured simultaneously with . The ratio between and is therefore . Figure 4() plots versus . For the data from Daya & Ecke (2001), Qiu et al. (2004) and Shang et al. (2008), there is no data available. To obtain , we used the heat transport scaling relation , which was obtained in the range and the range (Xia, Lam & Zhou, 2002). For the rest of the data, and the corresponding were measured simultaneously. Interestingly, the data in rough cells and smooth cells collapse onto each other, suggesting that exhibits universal behaviours that is independent of the plate topography. The scaled shows a rather weak dependence, i.e. , as indicated by the solid lines in the figure. Note that the data from Shang et al. (2008) are lower than the others. We currently do not understand this small difference. It may be due to the systematic error introduced when calculating , which involves that was not measured simultaneously with .
Next, we examine the profiles of the vertical rms velocity in the mixing zone. Experimentally, obtaining velocity rms profiles requires long-time and multi-point measurement. Because of this, experimentally measured profiles of are scarce. For this reason, we use profiles from numerical studies. Figure 5() shows the horizontally averaged vertical rms velocity profiles , which are adopted from Scheel & Schumacher (2016). Both and for these profiles vary over a wide range. It is seen that, when normalised by the free-fall velocity , the profiles do not collapse onto a single curve, suggesting that is not able to capture the essential physics here. Figure 5() plots the same data set as those in figure 5() but with the vertical axis scaled by . The data for different and now collapse onto each other in the mixing zone, suggesting that is a proper velocity scale. The in the range can be fitted by a logarithmic function, i.e. . This logarithmic dependence is in agreement with the theoretical prediction by Adrian (1996). It is also observed that the logarithmic region increases with and . The inset of figure 5() plots the same data as the main figure in log-log scale, showing that the data can not be fitted by a power law. Note in the core region are larger than those shown in figure 4() and they do not collapse onto each other. A possible reason may be that the data presented in figure 4 were taken at a single point, i.e. the cell centre, but those in figure 5 were averaged along a horizontal cross section which includes strong velocity fluctuations produced by thermal plumes carried with the large-scale circulation.
3.3 Implications for ultra-high-Rayleigh-number convection
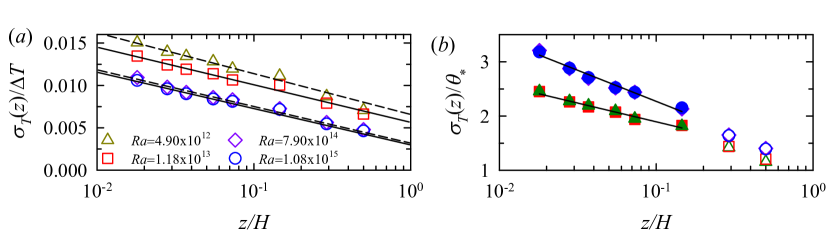
We now study whether the convective temperature is applicable to the ultra-high- () data and may possibly shed some lights on the turbulence in this regime. The data are taken from Ahlers et al. (2012) with an adapted plot shown in figure 6(). Those data were measured in pressurised SF6 gas with reaching and . It is seen that the logarithmic functions fit nicely. But data for different do not collapse onto each other, and they seem to have similar decay rates (the pre-factor of the logarithmic term). The observed logarithmic dependence in the plume abundant region, i.e. near the sidewall, is also obtained by He & Xia (2019) recently. In figure 6(), we show that once is scaled by , they fall into two groups. The solid lines in the figure are logarithmic fits to the data in the range , yielding for and for . The difference in the decay rates suggests that the bulk fluctuations undergo a transition. We note that He et al. (2012) have stated that the system has reached the ultimate state of thermal convection for . A systematic investigation on the -dependence of could provide more evidences on the existence of an internal flow state transition.
4 Conclusions
We have studied the temperature and the velocity fluctuations in the bulk of Rayleigh-Bénard turbulence using new experimental data from the present study and experimental and numerical data from previous studies. We show that, when scaled by the convective temperature , the rms temperature at the cell centre is a constant, i.e. , over the Rayleigh number range of and the Prandtl number range of , and is independent of the surface topographies of the top and bottom plates of the convection cell. A constant close to unity suggests that the convective temperature is a proper measure of the temperature fluctuation in the core region. The vertical rms velocity, on the other hand, shows a rather weak -dependence, i.e. , which is also independent of the plate topography. In the mixing zone with a mean horizontal shear, the rms temperature profile obeys a power-law dependence on the vertical distance from the plate, and the vertical rms velocity profile obeys a logarithmic dependence on . The study thus demonstrates that the typical scales for the temperature and the velocity are the convective temperature and the convective velocity , respectively. The discovery of these universal aspects of fluctuations sheds new light on the bulk dynamics in convective turbulence. We further show that could be used to study internal flow state transitions in the ultra-high- turbulent convection. We note that, despite universal properties hold over a wide range of and and surface topographies, is found to depend on the cell geometry, i.e. it is a constant of 0.34 in cubes and 0.85 in cylinders. The scaling exponent of the profile also depends on the cell geometry. Finally, the present study focuses on turbulent fluctuations in convection cells with an aspect ratio around unity. It will be interesting to study if the universal behaviours observed here will also exist in cells with varying aspect ratios.
Acknowledgement
We thank S.-D. Huang and Y.-H. He for discussions. This work was supported by a SUSTech Startup Fund and by the Hong Kong Research Grant Council under grant Nos. CUHK 14301115 and 14302317.
References
- Adrian (1996) Adrian, R. J. 1996 Variation of temperature and velocity fluctuations in turbulent thermal convection over horizontal surfaces. Int. J. Heat Mass Transfer 39, 2303–2310.
- Ahlers et al. (2012) Ahlers, G., Bodenschatz, E., Funfschilling, D., Grossmann, S., He, X., Lohse, D., Stevens, R. J. A. M. & Verzicco, R. 2012 Logarithmic temperature profiles in turbulent Rayleigh-Bénard convection. Phys. Rev. Lett. 109, 114501.
- Ahlers et al. (2009) Ahlers, G., Grossmann, S. & Lohse, D. 2009 Heat transfer and large scale dynamics in turbulent Rayleigh-Bénard convection. Rev. Mod. Phys. 81.
- Castaing et al. (1989) Castaing, B., Gunaratne, G., Heslot, F., Kadanoff, L., Libchaber, A., Thomae, S., Wu, X.-Z., Zaleski, S. & Zanetti, G. 1989 Scaling of hard thermal turbulence in Rayleigh-Bénard convection. J. Fluid Mech. 204, 1–30.
- Chillà & Schumacher (2012) Chillà, F & Schumacher, J. 2012 New perspectives in turbulent Rayleigh-Bénard convection. Eur. Phys. J. E 35, 58.
- Daya & Ecke (2001) Daya, Z. A. & Ecke, R. E. 2001 Does turbulent convection feel the shape of the container? Phys. Rev. Lett. 87, 184501.
- Deardorff (1970) Deardorff, J. W. 1970 Convective velocity and temperature scales for the unstable planetary boundary layer and for Rayleigh convection. J. Atmos. Sci. 27, 1211–1213.
- Du & Tong (2000) Du, Y. B. & Tong, P. 2000 Turbulent thermal convection in a cell with ordered rough boundaries. J. Fluid Mech. 407, 57–84.
- Du & Tong (2001) Du, Y. B. & Tong, P. 2001 Temperature fluctuations in a convection cell with rough upper and lower surfaces. Phys. Rev. E 63, 046303.
- Grossmann & Lohse (2004) Grossmann, S. & Lohse, D. 2004 Fluctuations in turbulent Rayleigh-Bénard convection: the role of plumes. Phys. Fluids 16, 4462–4472.
- He et al. (2012) He, X., Funfschilling, D., Nobach, H., Bodenschatz, E. & Ahlers, G. 2012 Transition to the Ultimate State of Turbulent Rayleigh-Bénard Convection. Phys. Rev. Lett. 108, 024502.
- He & Xia (2019) He, Y.-H. & Xia, K.-Q. 2019 Temperature fluctuation profiles in turbulent thermal convection: a logarithmic dependence versus a power-law dependence. Phys. Rev. Lett. 122, 014503.
- Heslot et al. (1987) Heslot, F., Castaing, B. & Libchaber, A. 1987 Transitions to turbulence in helium gas. Phys. Rev. A 36, 5870–5873.
- Kaczorowski et al. (2014) Kaczorowski, M., Chong, K.-L. & Xia, K.-Q. 2014 Turbulent flow in the bulk of Rayleigh-Bénard convection: aspect-ratio dependence of the small-scale properties. J. Fluid Mech. 747, 73–102.
- Lakkaraju et al. (2012) Lakkaraju, R., Stevens, R. J. A. M., Verzicco, R., Grossmann, S., Prosperetti, A., Sun, C. & Lohse, D. 2012 Spatial distribution of heat flux and fluctuations in turbulent Rayleigh-Bénard convection. Phys. Rev. E 86, 056315.
- Lohse & Xia (2010) Lohse, D. & Xia, K.-Q. 2010 Small-scale properties of turbulent Rayleigh-Bénard convection. Annu. Rev. Fluid Mech. 42, 335–364.
- Lui & Xia (1998) Lui, S.-L. & Xia, K.-Q. 1998 Spatial structure of the thermal boundary layer in turbulent convection. Phys. Rev. E 57, 5494–5503.
- Niemela et al. (2000) Niemela, J. J., Skrbek, L., Sreenivasan, K. R. & Donnelly, R. J. 2000 Turbulent convection at very high Rayleigh numbers. Nature 404, 837–840.
- Qiu et al. (2004) Qiu, X. L., Shang, X.-D., Tong, P. & Xia, K.-Q. 2004 Velocity oscillations in turbulent Rayleigh-Bénard convection. Phys. Fluids 16, 412–423.
- Scheel & Schumacher (2016) Scheel, J. D. & Schumacher, J. 2016 Global and local statistics in turbulent convection at low Prandtl numbers. J. Fluid Mech. 802, 147–173.
- Shang et al. (2008) Shang, X.-D., Tong, P. & Xia, K.-Q. 2008 Scaling of the local convective heat flux in turbulent Rayleigh-Bénard convection. Phys. Rev. Lett. 100, 244503.
- Shen et al. (1995) Shen, Y., Xia, K.-Q. & Tong, P. 1995 Measured local-velocity fluctuations in turbulent convection. Phys. Rev. Lett. 75, 437–440.
- Sun et al. (2008) Sun, C., Cheung, Y.-H. & Xia, K.-Q. 2008 Experimental studies of the viscous boundary layer properties in turbulent Rayleigh-Bénard convection. J. Fluid Mech. 605, 79–113.
- Wang & Xia (2003) Wang, J. & Xia, K.-Q. 2003 Spatial variations of the mean and statistical quantities in the thermal boundary layers of turbulent convection. Eur. Phys. J. B 32, 127–136.
- Wang et al. (2018) Wang, Y., Xu, W., He, X., Yik, H., Wang, X., Schumacher, J. & Tong, P. 2018 Boundary layer fluctuations in turbulent Rayleigh-Bénard convection. J. Fluid Mech. 840, 408–431.
- Wei & Ahlers (2016) Wei, P. & Ahlers, G. 2016 On the nature of fluctuations in turbulent Rayleigh-Bénard convection at large Prandtl numbers. J. Fluid Mech. 802, 203–244.
- Wei et al. (2014) Wei, P., Chan, T.-S., Ni, R., Zhao, X.-Z. & Xia, K.-Q. 2014 Heat transport properties of plates with smooth and rough surfaces in turbulent thermal convection. J. Fluid Mech. 740, 28–46.
- Xia (2013) Xia, K.-Q. 2013 Current trends and future directions in turbulent thermal convection. Theo. Appl. Mech. Lett 3, 052001.
- Xia et al. (2002) Xia, K.-Q., Lam, S. & Zhou, S.-Q. 2002 Heat-flux measurement in high-Prandtl-number turbulent Rayleigh-Bénard Convection. Phys. Rev. Lett. 88, 064501.
- Xie et al. (2018) Xie, Y.-C., Ding, G.-Y. & Xia, K.-Q. 2018 Flow topology transition via global bifurcation in thermally driven turbulence. Phys. Rev. Lett. 120, 214501.
- Xie & Xia (2017) Xie, Y.-C. & Xia, K.-Q. 2017 Turbulent thermal convection over rough plates with varying roughness geometries. J. Fluid Mech. 825, 573–599.