The Formation of Ultra-Diffuse Galaxies in the RomulusC Galaxy Cluster Simulation
Abstract
We study the origins of 122 ultra-diffuse galaxies (UDGs) in the RomulusC zoom-in cosmological simulation of a galaxy cluster (M M⊙), one of the only such simulations capable of resolving the evolution and structure of dwarf galaxies (M M⊙). We find broad agreement with observed cluster UDGs and predict that they are not separate from the overall cluster dwarf population. UDGs in cluster environments form primarily from dwarf galaxies that experienced early cluster in-fall and subsequent quenching due to ram pressure. The ensuing dimming of these dwarf galaxies due to passive stellar evolution results in a population of very low surface brightness galaxies that are otherwise typical dwarfs. UDGs and non-UDGs alike are affected by tidal interactions with the cluster potential. Tidal stripping of dark matter, as well as mass loss from stellar evolution, results in the adiabatic expansion of stars, particularly in the lowest mass dwarfs. High mass dwarf galaxies show signatures of tidal heating while low mass dwarfs that survive until typically have not experienced such impulsive interactions. There is little difference between UDGs and non-UDGs in terms of their dark matter halos, stellar morphology, colors, and location within the cluster. In most respects cluster UDG and non-UDGs alike are similar to isolated dwarf galaxies, except for the fact that they are typically quenched.
keywords:
galaxies:clusters:general – galaxies:evolution – galaxies: – galaxies:dwarf1 Introduction
The population of dwarf galaxies in cluster environments has been known to include uniquely low surface brightness objects compared to low mass galaxies in the local Universe (e.g. Sandage & Binggeli, 1984; Impey et al., 1988; Conselice et al., 2003). While their properties point to a unique formation mechanism compared to local dwarfs, a significant limitation in understanding the evolution of dwarf galaxies in such dense environments has been their elusiveness to detection. Recent advancements in detecting low surface brightness structures, led by observatories such as Dragonfly and Subaru, have revealed that this population of very diffuse, low luminosity galaxies are numerous. These galaxies, recently categorized as ‘ultra-diffuse’ galaxies (UDGs), are characterized by their large effective radii and very low surface brightness. They are found primarily in cluster and group environments (van Dokkum et al., 2015; van der Burg et al., 2016; Román & Trujillo, 2017a; Wittmann et al., 2017; Greco et al., 2018; Mancera Piña et al., 2018), with significant populations detected in the Coma, Virgo, and Fornax clusters (Mihos et al., 2015; Koda et al., 2015; Muñoz et al., 2015; Mowla et al., 2017), as well as lower mass galaxy groups and even Milky Way-mass halos (Román & Trujillo, 2017b; Mancera Piña et al., 2018). In some cases, these UDGs have very unique properties, such as large numbers of globular clusters for their stellar mass (van Dokkum et al., 2017) or dynamical masses that are dominated by stars out to large radii (van Dokkum et al., 2018b, 2019b). The question of whether such galaxies can form in CDM and what processes are required to produce them may have important implications to galaxy formation theory (e.g. Di Cintio et al., 2017a), and potentially even the nature of dark matter (e.g. Wasserman et al., 2019).
Idealised simulations (e.g. Yozin & Bekki, 2015; Dutta Chowdhury et al., 2019), analytic and semi-analytic models (e.g. Amorisco & Loeb, 2016; Ogiya, 2018; Rong et al., 2017; Carleton et al., 2019), and cosmological simulations (e.g. Di Cintio et al., 2017a; Chan et al., 2018; Jiang et al., 2019a; Liao et al., 2019; Martin et al., 2019) have all been utilized in attempts to understand the origin of UDGs and their properties, often coming to different conclusions. A dynamical origin to UDGs has been proposed by several groups, which would have UDGs forming from tidal heating and/or stripping due to interactions with the galaxy cluster environment (e.g. Ogiya, 2018; Jiang et al., 2019a; Liao et al., 2019). However, recent observations of UDGs have shown a lack of tidal features and estimate their current tidal radii to be larger than 7 kpc (Mowla et al., 2017), though such observations do not rule out tidal heating which can puff up a galaxy without the features associated with tidal stripping. Another possibility is that UDGs reside in halos with particularly high spin (Amorisco & Loeb, 2016), and indeed cosmological simulations of isolated galaxies have shown that angular momentum is an important component to forming low surface brightness galaxies (Di Cintio et al., 2019). Cosmological simulations have also shown that bursty feedback from supernovae (SN), which lead to the formation of cored dark matter profiles (Governato et al., 2010, 2012; Pontzen & Governato, 2012, 2013; Di Cintio et al., 2014), also lead to extended, diffuse stellar distributions and galaxies with UDG-like properties (Di Cintio et al., 2017a). In this scenario, UDG formation does not require a dense environment, although the environment is likely important for reproducing other observed properties such as colors, gas content (or lack thereof), and stellar ages (Chan et al., 2018).
Self-consistently modeling UDG formation in dense environments is challenging for cosmological simulations because it requires simulating a massive halo, central galaxy, and circum-galactic/intracluster gas with enough resolution elements to study the internal structure of low mass galaxies. In general, smaller halos have been more accessible, such as Milky Way-mass halos (Liao et al., 2019) or low-mass groups (Jiang et al., 2019a). These simulations have found that UDGS can form either as a result of tidal interactions with their host halo and ram pressure stripping, or develop UDG-like properties while still relatively isolated due to bursty star formation and supernovae feedback, as found in Di Cintio et al. (2017a), or by residing in high-spin halos.
However, such experiments using cosmological simulations of cluster environments have so far been limited either to low resolution simulations able to resolve only the most massive dwarf galaxies with kpc resolution and a few hundred particles (Martin et al., 2019) or semi-analytic galaxy evolution models applied to dark matter only simulations (Carleton et al., 2019). Cosmological hydrodynamic simulations that resolve the internal structure of low mass dwarf galaxies in clusters are required to better understand UDG formation.
The Romulus simulations (Tremmel et al., 2017) consist of a 25 Mpc-per-side uniform volume simulation (Romulus25) as well as the RomulusC cosmological galaxy cluster simulation (Tremmel et al., 2019). Both are run with state-of-the art sub-grid physics and resolution. RomulusC is one of the highest resolution cosmological simulations ever completed of a galaxy cluster, comparable only to the recent TNG50 simulation, which also consists of a single cluster of similar mass (Nelson et al., 2019; Pillepich et al., 2019). It therefore represents an important opportunity to, for the first time, self-consistently study the evolution of dwarf galaxies (M M⊙) in galaxy cluster environments. Galaxies in RomulusC with stellar and virial masses as small as M⊙ and M⊙ respectively are resolved with star particles and more than dark matter particles. We are also able to use Romulus25 to self-consistently compare properties of cluster dwarf galaxies to hundreds of isolated systems simulated with the same physics and resolution. In §2 we provide an overview of the simulation properties and our criteria for selecting galaxies as UDGs. In §3 we examine the properties of UDGs predicted by RomulusC and compare with both observations and the overall cluster and isolated populations of dwarf galaxies. In §4 we study the evolution of dwarf galaxies in the cluster environment and examine its role in UDG formation. We discuss the implications and limitations of our results in §5 and we summarize the results in §6.
2 The RomulusC Simulation
RomulusC (Tremmel et al., 2019) is a cosmological zoom-in simulation of a small galaxy cluster with total virial mass of M⊙, R kpc, and M M⊙111RΔ is defined as the radius enclosing a mean density of , where is the critical density at . MΔ is the mass enclosed within RΔ.. The initial conditions for RomulusC were extracted using the ‘zoom-in’ volume re-normalization technique of Katz & White (1993) to define a Lagrangian region associated with the most massive halo of a 50 Mpc-per-side uniform volume dark matter-only simulation. The resulting ‘zoom-in region’ was re-simulated at higher resolution with full hydrodynamic treatment using the new Tree+SPH code ChaNGa (Menon et al., 2015) while maintaining the gravitational influence of the evolving large-scale structure of dark matter, which is modeled with much coarser resolution.
ChaNGa includes standard physics modules previously used in GASOLINE (Wadsley et al., 2004; Wadsley et al., 2008; Wadsley et al., 2017) such as a cosmic UV background (Haardt & Madau, 2012) including self-shielding (Pontzen et al., 2008), star formation, ‘blastwave’ SN feedback (Stinson et al., 2006), and low temperature metal cooling. ChaNGa implements an updated SPH routine that uses a geometric mean density in the SPH force expression, allowing for the accurate simulation of shearing flows with Kelvin-Helmholtz instabilities (Ritchie & Thomas, 2001; Menon et al., 2015; Governato et al., 2015). RomulusC includes an updated implementation of turbulent diffusion (Wadsley et al., 2017), which results in a realistic intracluster medium (ICM) (Wadsley et al., 2008; Tremmel et al., 2019; Butsky et al., 2019) and metal distributions within galaxies (Shen et al., 2010). Finally, a time-dependent artificial viscosity and an on-the-fly time-step adjustment (Saitoh & Makino, 2009) system allow for more realistic treatment of weak and strong shocks (Wadsley et al., 2017).
RomulusC is run with the same hydrodynamics, sub-grid physics, resolution, and cosmology as the Romulus25 simulation (Tremmel et al., 2017). The cosmology is CDM with cosmological parameter values following the recent results from Planck (, , h, ; Planck Collaboration et al., 2016). The simulation has a Plummer equivalent force softening of pc (a spline softening of 350 pc is used, which converges to a Newtonian force at 700 pc). Unlike many similar cosmological runs, the dark matter particles are oversampled relative to gas particles, such that the simulation is run with initially times more dark matter particles than gas. The result is a dark matter particle mass of M⊙ and gas particle mass of M⊙. This will decrease numerical effects resulting from two-body relaxation and energy equi-partition, which occur when particles have significantly different masses, both of which can affect the structure of simulated galaxies (Ludlow et al., 2019). This increased dark matter resolution also allows for the ability to track the dynamics of supermassive black holes within galaxies (Tremmel et al., 2015). Romulus25 has been shown to reproduce important galaxy and supermassive black hole scaling relations (Tremmel et al., 2017; Ricarte et al., 2019).
2.1 Sub-grid physics
2.1.1 Star formation and gas cooling
Star formation and associated feedback from supernovae are crucial processes that require sub-grid models in cosmological simulations like RomulusC. As in previous work (Stinson et al., 2006) for runs at this resolution, star formation (SF) is regulated with parameters that encode star formation efficiency in dense gas, the coupling of SN energy to the ISM, and the physical conditions required for star formation:
-
1.
The normalization of the SF efficiency, c, and formation timescale, yr, are both used to calculate the probability of creating a star particle from a gas particle that has a dynamical time
(1) -
2.
The fraction of SN energy coupled to the ISM, .
-
3.
The minimum density, n cm-3, and maximum temperature, T K, thresholds beyond which cold gas is allowed to form stars.
Star particles form with a mass of M⊙, or 30% the initial gas particle mass. We assume a Kroupa IMF (Kroupa, 2001) with associated metal yields and SN rates. Feedback from SN uses the ‘blastwave’ implementation (Stinson et al., 2006), with thermal energy injection and a cooling shutoff period approximating the ‘blastwave’ phase of SN ejecta when cooling is inefficient. Passive evolution of stellar populations are accounted for directly in the simulation via mass loss due to stellar winds and supernovae ejecta. In post-processing we also account for the gradual dimming of older stellar populations due to the loss of more massive, brighter stars which is included in the population synthesis models used to generate our stellar emission tables.
Gas cooling at low temperatures is regulated by metal abundance as in Guedes et al. (2011) as well as SPH hydrodynamics that includes both thermal and metal diffusion as described in Shen et al. (2010) and Governato et al. (2015). An important limitation of the Romulus simulations is the lack of cooling from high temperature metal lines. For low mass galaxies such as those we focus on in this work, metal line cooling is sub-dominant due to both low metallicity and low virial temperature of the dark matter halos hosting the galaxies. However, massive halos like galaxy clusters will be affected by such choices. The choice to not include metal-line cooling is outlined in more detail in Tremmel et al. (2019) and is due to the fact that, although RomulusC has the highest resolution for a cosmological simulation performed at this mass scale, it is still not enough to self-consistently simulate the multiphase ISM and, in particular, molecular cooling. Christensen et al. (2014) found that the inclusion of metal cooling without molecular hydrogen physics and more detailed models of star formation resulted in over-cooling in galaxies. While some simulations that are run at similar resolution to Romulus opt to include high temperature metal line cooling and instead boost the efficiency of stellar feedback (Shen et al., 2012; Dalla Vecchia & Schaye, 2012; Schaye et al., 2015; Sokołowska et al., 2016, 2018), this will not necessarily result in realistic circumgalactic media nor realistic galaxies beyond bulk properties such as their final stellar and gas masses. Christensen et al. (2014) find that ISM models that include both metal lines and H2 physics result in galaxies with star formation histories and outflow rates more similar to primordial cooling runs than to simulations with metal lines and no H2. This will be particularly true for the low mass halos presented here, which would likely be more affected by artificially boosted SN feedback prescriptions. The structure of the ICM of the RomulusC cluster has been shown to be consistent with observations, despite the lack of metal-line cooling (Tremmel et al., 2019).
2.1.2 Black hole physics
Supermassive black hole (SMBH) formation, dynamics, growth, and feedback are implemented into all Romulus simulations and described in more detail in Tremmel et al. (2017), where it is shown that low mass galaxies are generally unaffected by SMBH feedback (though see Sharma et al., 2019). While SMBH feedback certainly affects the evolution of the brightest cluster galaxy and other massive galaxies, it only marginally changes the overall structure of the ICM, even in the cluster core (Tremmel et al., 2019). While in this work we verify that interaction between dwarf galaxies and their environment is the most important process to forming UDGs in cluster environments, we explore in more detail how the presence of SMBHs in dwarf galaxies may affect their final morphology and star formation history in Sharma et al. (2019). We do confirm that the presence of a SMBH is not required to form a UDG, nor to keep a galaxy from becoming a UDG.
For the sake of completeness, we will briefly review the implementation of SMBH physics in Romulus. SMBHs are seeded in cold ( K), dense (), and pristine () gas, primarily in the first Gyr of the simulation. SMBH growth is modeled with a modified Bondi-Hoyle formalism that accounts for angular momentum supported gas. A fraction (0.2%) of the accreted mass is transferred to surrounding gas particles as thermal energy and the cooling of particles receiving this energy is turned off for the length of the SMBH’s timestep (generally yr). Accretion onto SMBHs is Eddington limited, assuming a radiative efficiency of 10%. SMBHs are allowed to move freely within their host galaxies, with unresolved dynamical friction accounted for in a sub-grid model (Tremmel et al., 2015), resulting in SMBH mergers that can be significantly delayed with respect to galaxy mergers (Tremmel et al., 2018a, b).
2.1.3 Sub-grid parameter optimization
Free parameters within our sub-grid models for star formation, SN feedback, and SMBH growth and feedback, were optimized using dozens of zoom-in cosmological simulations run with the same resolution as Romulus, as described in Tremmel et al. (2017). The parameter combination that resulted in galaxies that best matched four roughly orthogonal empirical relations were selected. The relations used were: 1) stellar mass-halo mass (Moster et al., 2013), 2) SMBH mass-stellar mass (Schramm & Silverman, 2013), 3) HI mass-stellar mass (using ALFALFA data, see Cannon et al., 2011; Haynes et al., 2011), and 4) bulge-to-total ratio versus specific angular momentum (Obreschkow & Glazebrook, 2014). Calibration was only performed on isolated galaxies at . Therefore, the evolution of galaxy properties (morphology, star formation history, etc) with redshift, as well as properties of satellite galaxies, are purely predictions from the simulation and have in no way been optimized to match any observations.
2.2 Halo and Galaxy Extraction
Dark matter halos, sub-halos, and all of their baryonic content, including central galaxies, are extracted using the Amiga Halo Finder (Knollmann & Knebe, 2009). AHF utilizes a spherical top-hat collapse technique to define the virial radius (Rvir) and mass (Mvir) of each halo and sub-halo. In our analysis we also include M200 and R200, the mass and radius containing an average overdensity of 200 times the critical density of the universe at that halo’s redshift. We only consider a halo or sub-halo resolved if it has a virial mass of at least M⊙, meaning that it contains at least dark matter particles. The centers of halos are calculated using the shrinking spheres approach (Power et al., 2003), which consistently traces the centers of the central galaxies within each halo. By nature of being a zoom-in simulation, the main halo and surrounding region in RomulusC are simulated at high resolution while the rest of the cosmological volume is sampled at much lower mass resolution. Galaxies near the boundaries of the simulation can become ‘contaminated’ with low resolution elements. We avoid including such galaxies in our analysis by requiring each galaxy to have less than of its dark matter particles be contaminated by low resolution elements. We only include galaxies that, at , exist well within our zoom-in region, no more than 1.5 Mpc from the center of the cluster, while the zoom-in region extends out to Mpc.
Following Munshi et al. (2013), when comparing our results with observations we apply a factor of 0.6 and 1.25 to the stellar and halo masses in order to provide a more accurate representation of what the inferred values would be given typical observational and abundance matching techniques. According to Munshi et al. (2013) these corrections are rather conservative for galaxies in the mass range we focus on in this Paper. Such a correction has also been justified by recent observations comparing more advanced techniques to typical photometric estimates of stellar mass (Leja et al., 2019). We note that the results of this paper are insensitive to this choice, as they do not play a role in determining the structural properties of the galaxies (effective radius, central surface brightness, etc) and will only affect the (observed) stellar masses we predict from the simulation.
In our analysis we define dwarf galaxies to be any resolved galaxy with a post-correction stellar mass below M⊙. In addition to galaxies from RomulusC, we also compare our cluster dwarf galaxies to the population of isolated dwarf galaxies in the Romulus25 cosmological simulation. As discussed in §2, both simulations are run with the same resolution, sub-grid physics, and cosmology. When selecting for isolated galaxies, we select only galaxies that do not lie within the virial radius of another halo with larger virial mass. We also employ an additional criterion motivated by the results from Geha et al. (2012), where each isolated dwarf galaxy must be at least 1.5 Mpc away from any galaxy with stellar mass greater than M⊙. Dwarf galaxies at closer distances to such massive galaxies are likely to have been affected by their environment and should not be considered isolated. Galaxies and their host halos are extracted from the simulation in the same way as in RomulusC.
2.3 Selection of UDGs in RomulusC
| log(M⋆ [M⊙]) | Ntotal | Nudg | UDG Fraction |
|---|---|---|---|
| 64 | 41 | ||
| 45 | 37 | ||
| 43 | 31 | ||
| 49 | 13 |
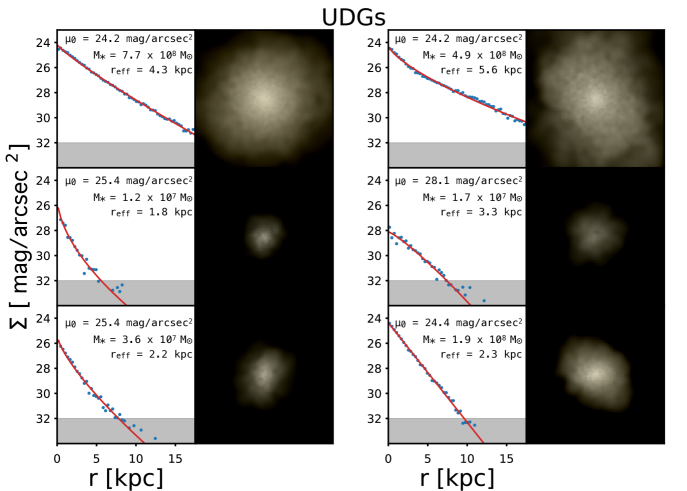
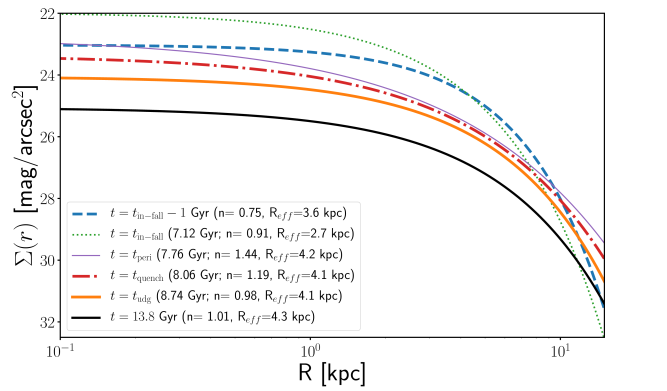
For each resolved, uncontaminated galaxy in RomulusC at , we generate surface brightness profiles in V and B bands due to the stellar populations, where stellar emission is calculated using tables generated from population synthesis models (http://stev.oapd.inaf.it/cgi-bin/cmd; Marigo et al., 2008; Girardi et al., 2010). This will naturally account for the passive evolution of stellar populations, which result in a dimming over time as the most massive stars evolve and explode as SN. From Johnson V and B bands, we generate g-band surface brightness profiles following the conversion from Jester et al. (2005). The profiles are integrated within circular annuli, assuming only stars within each given dark matter halo contribute and absorption from gas and dust is unimportant. This latter assumption is safe for dwarf galaxies, which typically have low metallicities (e.g. van Zee, 2000). The profiles are then fit to a single Sersic profile (Sérsic, 1963) of the following form:
| (2) |
We fit each galaxy using a least squares fit on Sersic index, , effective radius, Reff, and the surface brightness at the effective radius, . In order to both match the angular resolution of typical UDG observations (e.g. van Dokkum et al., 2015; Mowla et al., 2017) and avoid fitting to structure below the resolution limit of the simulation, we create and then fit our surface brightness profiles using radial bins of 300 pc. We fit out to the first radial bin with surface brightness dimmer than 32 mag/arcsec2, a typical limit for the most sensitive low surface brightness observations (e.g. van Dokkum et al., 2014). We place a further limitation on the radial bins used in this fit that they extend no further than the closest companion galaxy. At this resolution, it is difficult to resolve satellite galaxies at such low masses so this is a constraint rarely applied. Following van Dokkum et al. (2015), we classify a galaxy as being a UDG if it meets each of two criteria based on the single Sersic fits we generate: 1) it has an effective radius (Reff) that is greater than 1.5 kpc, and 2) it has a central surface brightness () dimmer than 24 magnitudes/arcsec2. Note that is different from that we fit to in Eqn. 2. Rather, this is the value of the surface brightness from the Sersic fit (Eqn. 2) evaluated at .
Each profile and Sersic fit is generated as if the observer is looking at the galaxy face-on. Galaxy re-orientations are performed based on the angular momentum of gas particles within the inner 5 kpc of the halo or, when there are less than 100 such particles, star particles within the inner 5 kpc. The rationale behind this is that we want to capture all galaxies that could potentially be categorized as a UDG and, by orienting in this way, we maximize the effective size and minimize the surface brightness of all of our galaxies. This way, when we select UDGs, we will be selecting all galaxies that would potentially be categorized as such were they to be viewed at random inclinations.
We find a total of 122 galaxies that fit our adopted definition of UDG within 1.5 Mpc of the center of the cluster at and 80 within R200. Example images, surface brightness profiles, and Sersic fits are shown in Figure 1. This predicted abundance is a factor of higher than many estimates for low mass clusters such as RomulusC (van der Burg et al., 2017; Román & Trujillo, 2017b; Mancera Piña et al., 2018), though in agreement with other cosmological simulation results (Liao et al., 2019; Jiang et al., 2019a). We do, however, stress that this is an upper limit as we do not account for the effect of random orientation which can make galaxies appear less diffuse. If galaxies have a low axes ratio, doing a full GalFit analysis may also decrease some effective radii. Some numerical effects may also artificially boost our population of UDGs. We discuss all of this further in §5.
3 Properties of UDGs in RomulusC
Table 1 shows the fraction of galaxies that we categorize as UDGs as a function of galaxy stellar mass. Low mass galaxies are more likely to be UDGs and all of our UDGs are less than M⊙ in stellar mass. UDGs in RomulusC have stellar masses as high as M⊙ and total halo virial masses as high as M⊙ at (halo masses are typically smaller than at in-fall, as discussed further in §3.3), corresponding to M⊙ in dark matter only simulations (Munshi et al., 2013). As described in §2.2, in the following analysis we compare to non-UDG dwarf galaxies, which we define as any resolved galaxy with stellar mass below M⊙. In this section we describe the observable properties of the UDGs in our sample in terms of morphology and color, comparing both to the ambient simulated dwarf galaxy population in the cluster and field environments, as well as observations of cluster UDGs. We also examine their position and kinematics within the cluster environment in RomulusC.
3.1 UDG morphology and colors
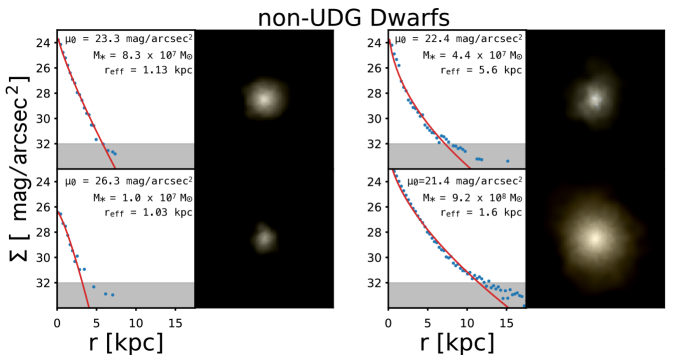
Figure 2 shows the size-mass relation for RomulusC galaxies as well as isolated dwarf galaxies from the Romulus25 simulation. In terms of their size, UDGs are not a unique population compared to non-UDGs. Rather, they represent, particularly at stellar masses below M⊙, the larger galaxies among the overall distribution of cluster dwarf galaxies. Cluster galaxies follow the same relation as the isolated galaxies, although they lack the smallest galaxies at any given stellar mass. This is contrary to observations that find significant populations of dwarf galaxies in clusters with effective radii below 1 kpc (e.g. Gavazzi et al., 2005; Eigenthaler et al., 2018; Venhola et al., 2019a).
The isolated galaxy population is consistent with the empirical relation from Lange et al. (2016) at stellar masses above M⊙. Although biased slightly high on average, the Romulus25 isolated galaxies are within a factor of two of the empirical relation. Non-UDG cluster galaxies match well to the Lange et al. (2016) results while the UDGs are above it. At the lowest masses (MM⊙) the deviation from the (extrapolated) empirical relation for both cluster and isolated dwarf galaxies is more significant. The observations from Lange et al. (2016) are insensitive to the lowest surface brightness galaxies and when we account for this our results match much better to the empirical relation (thick outlined points in the figure). These low surface brightness dwarfs contribute to the slight bias of our simulated galaxies toward higher effective radius in both environments. For galaxies with M M⊙ resolution effects could be important in determining their larger sizes, as we discuss further in §5.
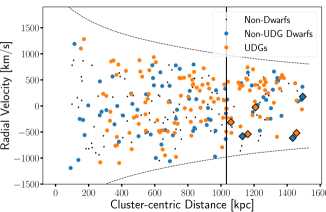
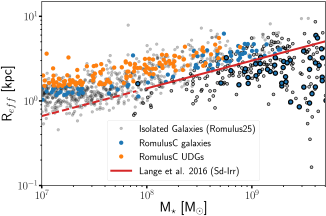
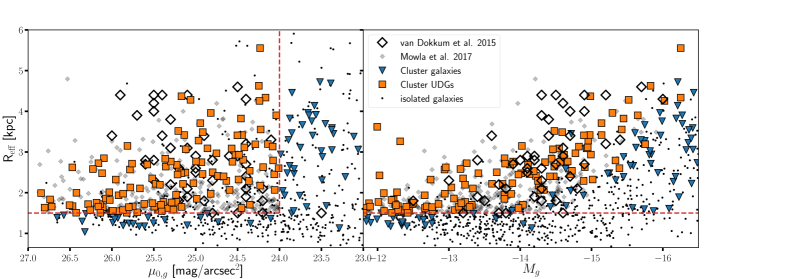
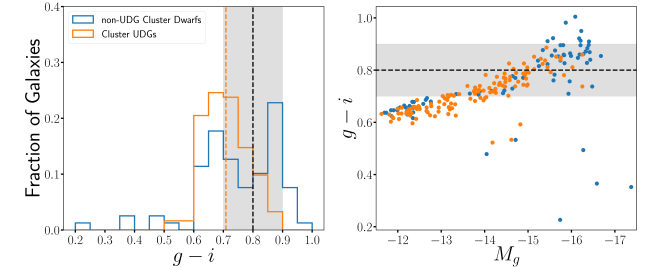
Figure 3 plots the effective radius, central surface brightness, and total g-band magnitude () for simulated cluster galaxies from RomulusC and isolated galaxies from Romulus25 alongside the observed sample of Coma cluster UDGs from van Dokkum et al. (2015) and Mowla et al. (2017). Cluster UDGs do not inhabit a unique region in RMg space compared to cluster and isolated dwarf galaxies, though there are more large, low surface brightness, low-luminosity galaxies in the cluster compared to the field. There is an overall good agreement between the observed UDGs and those in RomulusC. The most noticeable, though minor, difference is the lack of galaxies in RomulusC with low ( mag/arcsec2) central surface brightness and kpc.
Figure 4 shows the distribution of UDG and non-UDG dwarf galaxy colors in RomulusC. The typical dwarf galaxy colors in RomulusC are red () down to a g-band magnitude of -12, consistent with observed cluster dwarf galaxies (Roediger et al., 2017; Eigenthaler et al., 2018). Dwarf galaxies we classify as UDGs and non-UDGs have similar colors, with dimmer, lower mass galaxies typically being bluer, also consistent with observations (Boselli et al., 2014; Roediger et al., 2017; Eigenthaler et al., 2018). The colors are slightly bluer than the average UDG color presented in van Dokkum et al. (2015) (), but this difference is due to the inclusion of lower luminosity, bluer galaxies from RomulusC. The RomulusC UDG population deviates from the typical color of observed UDGs below , where there is only one UDG in the van Dokkum et al. (2015) sample.
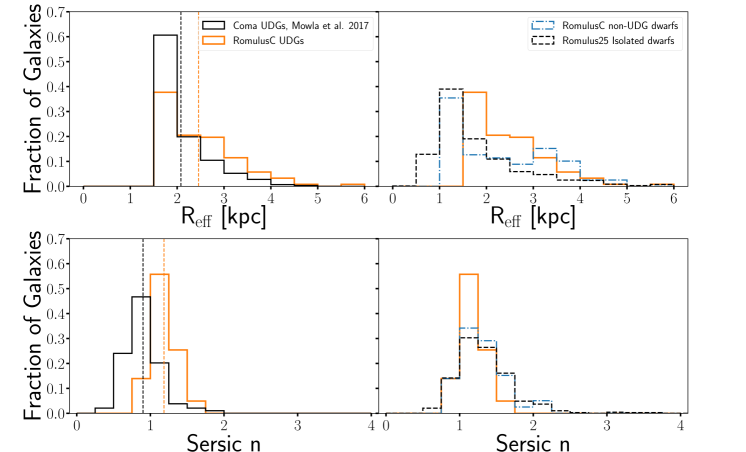
The right-hand panels of Figure 5 compare the distribution in Reff and Sersic index of cluster UDG and non-UDG dwarf galaxies, as well as isolated galaxies from Romulus25. Other than the fact that UDGs are not allowed to have small effective radii by definition and are therefore more likely to have larger sizes, cluster UDGs do not look significantly different from non-UDGs or field galaxies in terms of Reff and are essentially identical in terms of their Sersic index distribution. As mentioned above, we see that RomulusC lacks dwarf galaxies with R kpc that exist in isolation. Overall, these results indicate that UDGs are not a unique population of galaxies, but rather a sub-set of the ambient dwarf galaxy population in our simulations. Further, their morphology is not significantly altered by the cluster environment compared to isolated galaxies. In the left hand panels, we also compare to observed UDG morphologies from Mowla et al. (2017). While we find overall good agreement with observed cluster UDGs, RomulusC UDGs have slightly larger sizes and larger Sersic indices. Despite their slightly larger Sersic indices compared with the Mowla et al. (2017) sample, the lack of UDGs with is consistent with a wide range of observations (Román & Trujillo, 2017a; Venhola et al., 2017; Cohen et al., 2018; Mancera Piña et al., 2019).
3.2 Location, dynamics, and infall time
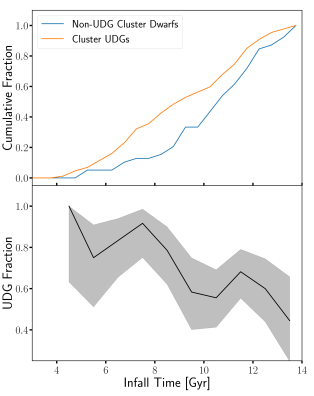
Figure 6 plots the cluster-centric distance and radial velocity of cluster galaxies. The small number of dwarf galaxies that have yet to cross R200 by are shown as diamonds. There is also a significant population of ‘splashback’ galaxies that have already crossed R200 but their orbits have taken them back outside of it. Most of these galaxies happen to be moving outward (positive radial velocities), but some are on their way back inward. While there is overall little difference in phase space location between UDGs and non-UDGs, interestingly there is a dearth of UDGs within kpc from cluster center (or 0.2 R200). This agrees with observational results from Mancera Piña et al. (2018) and may point to the fact that UDGs are more likely to become tidally disrupted at small cluster-centric distances. However, we stress that limitations in halo finding and artificial satellite disruption due to resolution effects (as discussed in §5.4) would need to be addressed in more detail before any direct conclusions can be made from the simulations, which we leave to future work.
There is little difference between the phase space location of UDGs, non-UDGs, and more massive galaxies, but there is a difference between their in-fall times, defined as the time a galaxy first crosses R200 of the cluster. The upper panel in Figure 7 plots the distribution of in-fall times for UDG and non-UDG dwarf galaxies in RomulusC. The small number of dwarfs that have yet to cross R200 are not included. UDGs are more likely to have fallen in at earlier times. The lower panel in Figure 7 shows the fraction of galaxies that are UDGs at as a function of in-fall time. More than 80% of the dwarf galaxies that in-fall before become UDGs by . This falls to for galaxies that have fallen into the cluster more recently.
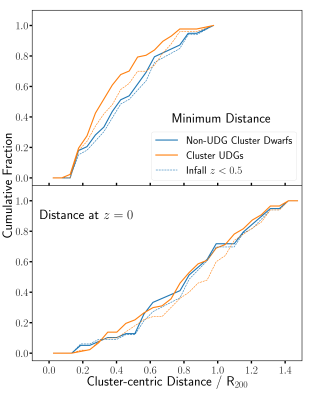
Figure 8 plots the distribution of both cluster-centric distances and the minimum distance attained by cluster dwarf galaxies. Again, only those that have already crossed R200 are included. The final distance distributions are nearly identical, but there is a difference in the minimum distance to cluster center attained throughout their orbital evolution. The difference is relatively small and is mostly due to the different in-fall times, as the difference is diminished if we consider only galaxies with in-fall at . However this does mean that UDGs have typically interacted with a denser environment as the (proto-)cluster is denser at high redshift. Still, we note that not all UDGs have passed close to cluster center ( of UDGs have never passed closer than 0.5 R200). Further, UDGs and non-UDGs that have in-fall times at lower redshift have similar minimum cluster-centric distances.
3.3 Dark matter halos
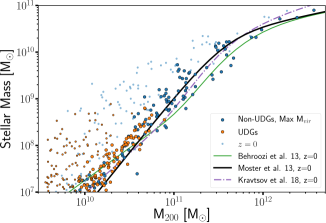
Figure 9 plots the relationship between stellar mass and halo mass at (small points) for RomulusC galaxies. Plotted in larger points is the relation for these same galaxies at the time they reach their peak halo mass. Prior to in-fall, cluster galaxies are consistent with the same abundance matching relations as isolated galaxies in Romulus25 (Tremmel et al., 2017). While these galaxies often in-fall much earlier than , we expect the stellar mass halo mass relation to remain relatively constant with redshift (Behroozi et al., 2013). Because the Romulus simulations were calibrated to match the Moster et al. (2013) relation for isolated galaxies, this result is not purely a prediction of the simulation. What it shows is that, prior to in-fall, UDGs and non-UDGs alike had halo masses consistent with the isolated galaxy population of Romulus25. Following in-fall, halos lose dark matter from tidal stripping, but the central galaxy remains unaffected, pushing the galaxies to the left of the abundance matching relations.
At the time of peak halo mass, UDGs in RomulusC have stellar masses as high as M⊙ and halo virial masses as high as M⊙, corresponding to a mass of M⊙ in a dark matter only simulation (Munshi et al., 2013). While it is often difficult to make concrete observational conclusions about the halo mass of UDGs, Dragonfly 44 is thought to occupy a relatively massive halo based on its large velocity dispersions (van Dokkum et al., 2016), though current estimates place its most likely dynamical mass to be not much beyond M⊙ (van Dokkum et al., 2019b). The large populations of globular clusters observed in several UDGs (van Dokkum et al., 2017) has been used as an argument that they come from more massive halos than their stellar masses would normally imply. Our results do not support this picture, as both UDGs and non-UDGs inhabit average mass DM halos for their stellar mass at the time of in-fall.
Other UDGs have been reported to have much lower dynamical masses than expected, with dark matter sub-dominant compared to stars in terms of total mass, or potentially missing all together (van Dokkum et al., 2018a; van Dokkum et al., 2019a). We do not attempt to extract such halos from the simulation, as we place strict boundaries on which halos we consider well resolved based on the number of dark matter particles they have. It is also unclear whether our halo finder would be properly optimized to find such systems.
It is possible that these observed galaxies do have dark matter, but heavily cored dark matter profiles. Our galaxies do not form heavily cored dark matter profiles due to their resolution being too low (see §5 for more discussion on this). There is some decrease to the dark matter density in the centers of cluster satellite halos due to tidal stripping (see §4.1), but not enough to form resolved cores. The typical dark matter density profile inside 1 kpc for cluster dwarf galaxies is cuspy with a slope of approximately . This is in contrast with recent results from cosmological simulations presented by Di Cintio et al. (2017a) that isolated UDGs have significantly cored dark matter profiles. This is because the same mechanism that causes cored dark matter profiles (rapid, repeated outflows from bursty star formation and supernovae feedback; Pontzen & Governato, 2012, 2013) results in the puffing up of the stellar mass as well. Not only do we not see evidence of dark matter cores, but we also see no evidence of star formation histories being any more bursty for UDGs versus non-UDGs. We stress that puffing up both DM and stellar mass distributions via supernovae feedback requires higher resolution than what we have in Romulus (Dutton et al., 2019, see discussion in §5). So, while this is a feature of our simulation resolution rather than a true prediction, our results show that the formation of UDGs can occur without bursty supernovae feedback causing both stars and dark matter to expand. Rather the formation channel at play in Romulus must be unique from what is predicted for isolated UDGs in Di Cintio et al. (2017a).
4 The Origin of UDGs in Galaxy Clusters
In this section we explore the origin of UDGs in galaxy clusters by tracking RomulusC galaxies back in time and examining how their key morphological properties change as they interact with the cluster environment. Because UDGs in our simulation span two orders of magnitude in stellar mass, in order to ensure that we control for any differences in evolution as a function of galaxy mass we split galaxies into three stellar mass bins: , , and < M⊙. Each bin contains approximately one-third of the total UDG population.
4.1 Cluster In-fall and Quenching
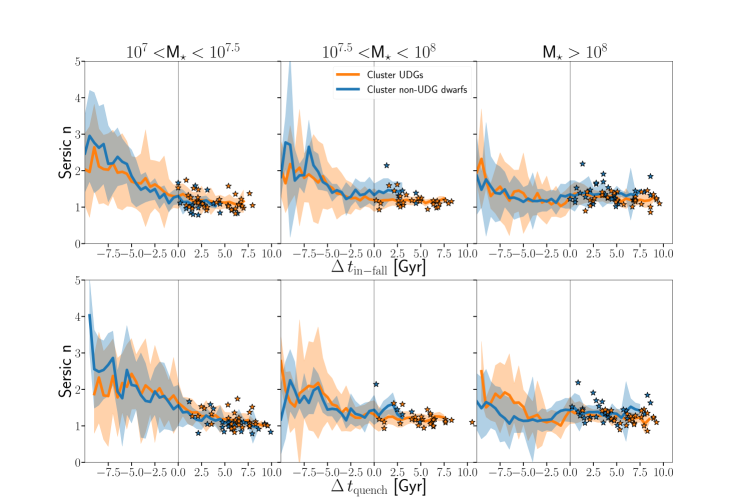
We track several properties back in cosmic time and plot their evolution relative to tin-fall, the first time when each galaxy crosses R200, and tquench, the time at which star formation ceases in the inner 1 kpc of each galaxy. Figures 10, 11, and 12 plot such evolutionary tracks for Sersic index (), Reff, and central surface brightness () respectively. The thick blue and orange lines represent the mean values at each time for non-UDGs and UDGs (at ), respectively, and the shaded regions the standard deviation at any given time. We present the average time evolution in units of Gyrs, but have also examined the results were we to normalize by the dynamical time at R200 following the same methodology as Wang et al. (2020) and Jiang & van den Bosch (2016). We find no meaningful difference in the behavior when using this normalization.
Some galaxies fail to track back in time, due to the halo finder failing to recover their progenitor halo during a step. This can happen either due to a close interaction with the cluster center or with another cluster member galaxy that causes the halo finder to be unable to separate the two halos. The galaxies included on these plots are those that trace back to at least Gyrs in simulation time and prior to both in-fall and quenching. These criteria remove of dwarf galaxies in each bin. We stress that at earlier times the galaxies are much less massive and so are resolved with fewer particles, making some of the earliest morphological properties uncertain, particularly at our lowest stellar mass bin.
For Sersic (Figure 10) there is little difference in the mean evolution between UDG and non-UDG dwarf galaxies in all mass bins. There is a gradual decrease in from at early times to that is most apparent at low mass.
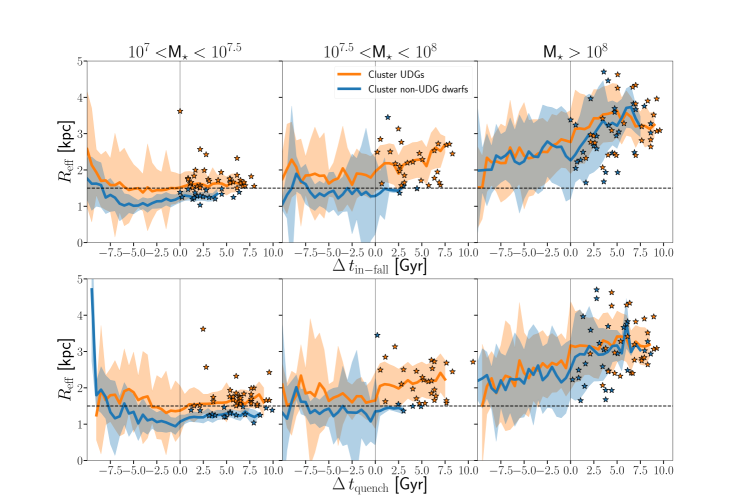
The effective radius (Figure 11) of RomulusC dwarfs tends to increase by following the quenching of star formation (bottom figures). This increase is likely due to a combination of tidal heating, tidal and ram pressure stripping, and stellar mass loss due to passive stellar evolution. In the highest mass bin, many galaxies that become UDGs already fit our Reff criteria for UDG classification well before quenching or cluster in-fall. At the lowest mass bin, where this size evolution is most important in determining each galaxy’s classification as a UDG at , UDG progenitors already have typically larger effective radii compared to their non-UDG counterparts long before in-fall or quenching. However, the relatively small increase in size following the quenching of star formation helps many of these low mass galaxies fit our UDG criteria.
Substantial evolution is seen in the central g-band surface brightness, , for both UDG and non-UDG galaxies in the cluster as shown by Figure 12. The highest mass dwarf galaxies have much higher surface brightness prior to in-fall into the cluster. The same is true for lower mass dwarf galaxies but many, particularly those in the lowest mass bin, begin to see substantial change well before in-fall. More enlightening is the evolution in with respect to tquench (lower panels in Figure 12). Prior to quenching the central surface brightness is relatively constant, but following the shutdown of star formation declines steadily with time. This decline corresponds to as much as 1-3 magnitudes/arcsec2 by . For all UDGs at all masses this evolution is important for bringing them below the central surface brightness threshold set by our selection criteria. For the lowest mass bins, every galaxy falls below this threshold by (which is why the galaxy size becomes the most important criteria for determining their status as a UDG). For the highest mass bin the opposite is true: all galaxies are large enough to be UDGs so the central surface brightness is the determining factor in their final classification.
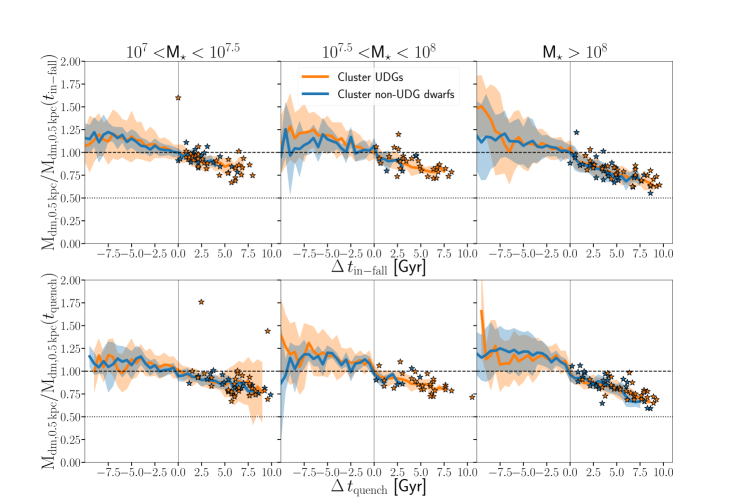
In Figure 13 we explore the evolution of dark matter in the central 0.5 kpc of cluster dwarf galaxies. Dark matter content in the centers of cluster dwarfs decreases by as much as by . The evolution in dark matter is due to tidal stripping as the halos interact with the cluster potential, which is why this decline typically begins close to cluster in-fall. This tidal stripping can affect the dark matter in the center of the halo where dark matter particles often have more radial orbits that take them out to larger distances where they are susceptible to these tidal effects (Zolotov et al., 2012). While this is not extreme enough to form dark matter cores in RomulusC, it is able to decrease the density an appreciable amount. Figure 14 shows the evolution in stellar mass in the inner 0.5 kpc of the same galaxies in RomulusC. Following cluster in-fall and quenching, the stellar mass decreases. A significant part of this is likely due to stellar evolution, where of the mass is removed from stars in the form of winds and SN ejecta. In addition to this, we expect adiabatic expansion to take place in response to the rapid removal of gas and dark matter due to ram pressure and tidal forces respectively (Arraki et al., 2014).
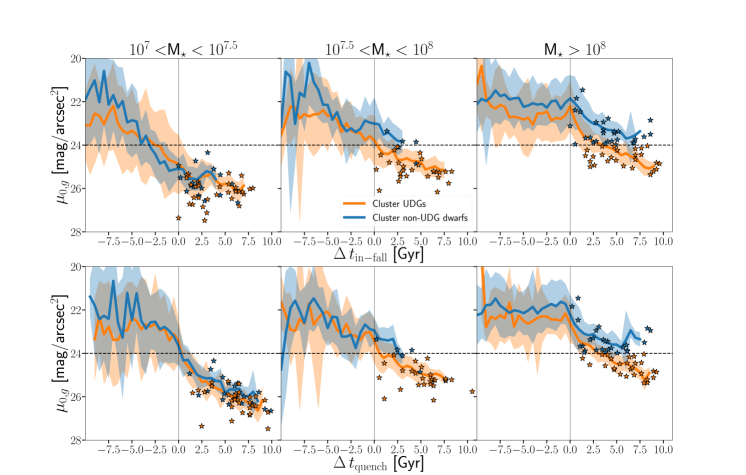
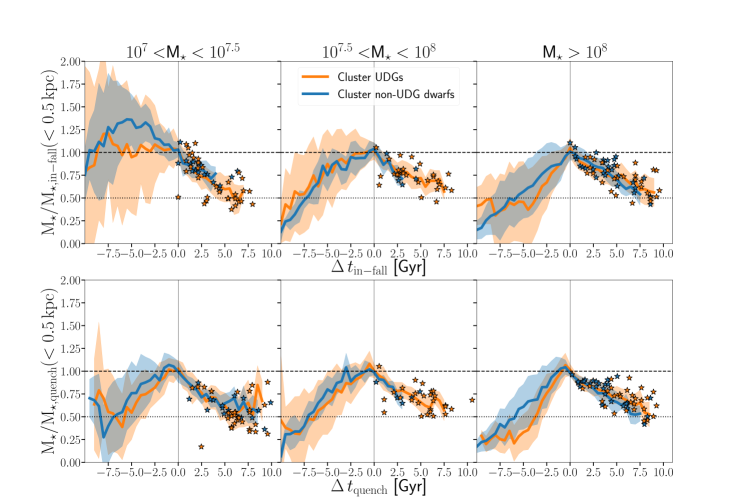
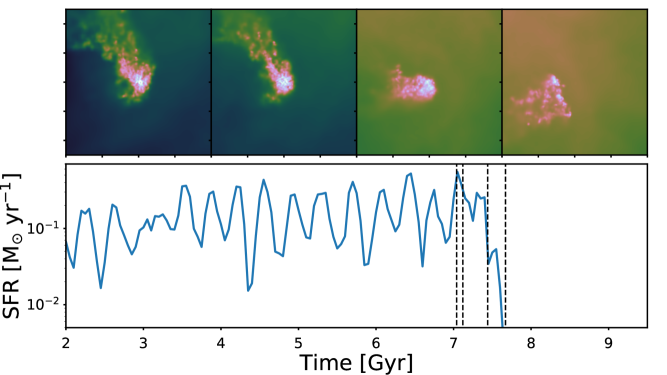
While the stellar mass in the center of these galaxies does decrease, it doesn’t do so by a substantial enough amount to account for the several magnitude decrease in central surface brightness shown in Figure 12. It can therefore be concluded that the decrease in central surface brightness is rather the result of passive stellar evolution. Figure 15 shows how this process works in more detail for the most massive UDG in our sample. On the top we show the gas column density at four snapshots as the galaxy first crosses inward of R200. Below that, we show the evolution of its star formation rate, which declines over the next Gyr and fully quenches at Gyr, approximately 1 Gyr after the initial in-fall. On the bottom we show the evolution of the surface brightness profile at six different times. Before in-fall (blue, dashed line), the galaxy is star forming with a central surface brightness 1 magnitude brighter than the UDG threshold. As the galaxy crosses R200 (green, dotted line) ram pressure begins to quench star formation. However, while ram pressure begins to remove gas from the outskirts of the galaxy, it can also compress gas toward the center (Fujita & Nagashima, 1999; Bekki & Couch, 2003; Kronberger et al., 2008; Du et al., 2019; Steyrleithner et al., 2020), resulting in a momentary increase in the central surface brightness. This effect can also be seen for UDGs in our highest mass bin in Figure 12. On average, the effect is less than what is seen in Figure 15. Indeed an in-fall radius of R200 is a somewhat arbitrary choice and we leave to future work more detailed investigations of environmental effects on galaxy properties and their dependence on cluster-centric radius. In general, it is reasonable to say that beyond R200 galaxies are experiencing significant environment effects. Such influence is not limited to galaxies within R200, as lower mass galaxies have their gas removed by ram pressure well outside R200. The more massive galaxies like the one in Figure 15, however, are able to maintain their gas supply long enough to feel the stronger ram pressure within R200 including the increase in star formation activity from ram pressure-induced compression before completely quenching. By the time the galaxy has reached pericenter (thin, magenta line), star formation has been quenched everywhere but the very center and tidal heating has caused the effective radius to increase rapidly (see §4.2). The high ram pressure felt by the galaxy at pericenter passage is enough to fully quench it (red, dot-dashed line), leaving the stellar population to age and dim over time. This passive evolution results in a decrease in the surface brightness, eventually causing the already large galaxy to become very low surface brightness such that it would be considered a UDG (orange, solid line) Myr after quenching and Gyr after pericenter passage. This passive dimming continues with roughly constant effective radius and Sersic index until (black, solid line).
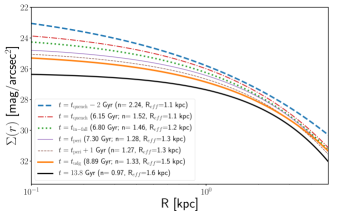
Figure 16 shows another example of the evolution of the surface brightness profile, this time for a low mass dwarf galaxy (M M⊙) that is both too bright and too small to be considered a UDG by our definition at in-fall. Low mass galaxies typically quench more easily and do not require larger amounts of ram pressure at pericenter. Rather, in this example the galaxy quenches several hundred Myr prior to cluster in-fall. A couple Gyrs prior to quenching (blue, dashed line) the galaxy fails both central surface brightness and effective radius criteria for being a UDG. As star formation quenches, the surface brightness decreases and the size begins to gradually increase over time. At pericenter (thin, purple line) the galaxy does not undergo a dramatic increase in effective radius as seen in the more massive galaxy. Rather, the galaxy continues to gradually increase in effective radius until it becomes large enough and dim enough to be considered a UDG (orange line). In total, the radius increases by 36% between quenching and 2.7 Gyr later when it would be considered a UDG. During the next Gyr the effective radius increases by less than 10% (black line; ). During the few Gyr following quenching, stars will lose mass to winds which will then be removed from the relatively shallow potential well of the low mass galaxy by ram pressure. The resulting mass loss, combined with the tidal stripping of dark matter, will result in adiabatic expansion of stars and a gradual increase in effective radius (Arraki et al., 2014).
Passive evolution is not unique to the cluster environment, as shown in Figure 17. Central surface brightness values of galaxies in isolation follow the same trend with stellar age as galaxies in RomulusC. Galaxies with older stellar populations at their centers have lower central surface brightness. The cluster environment is important mainly as a way to quench star formation in low mass galaxies, which are generally star forming in isolation.
4.2 Tidal Interactions and UDG Formation
In the previous section, as well as Figure 9, we discuss how dwarf galaxies lose dark matter after cluster in-fall due to tidal stripping and that this mass loss not only occurs in the outskirts of satellite dwarf halos but also in their centers. In addition, progenitors to UDGs have preferentially earlier cluster in-fall times and get closer to cluster center relative to non-UDGs (see §3.2). This early in-fall and close approach to cluster core may also make UDG progenitors more susceptible to tidal heating from the cluster potential. In this section we examine in more detail the effect of tidal interactions with the cluster potential, in particular the effect of a galaxy’s first pericenter passage on its morphological evolution. Again, we present the average time evolution in units of Gyrs, but have also examined the results normalized by the dynamical time following Wang et al. (2020) and Jiang & van den Bosch (2016), but find no meaningful difference when this normalization is used.
The top panels of Figure 18 follow Reff as a function of time relative to first pericenter passage. In the two more massive bins there is typically an increase in effective radius at pericenter of , consistent with previous results examining UDG evolution in group environments (Jiang et al., 2019a). However, the evolution in effective radius at low masses, where the evolution is more critical to their final classification, is much more gradual, with the increase beginning around the time of quenching, rather than at pericenter passage. While the rapid increase in effective radius at higher masses is likely the result of tidal heating, the gradual increase seen at smaller masses is more consistent with adiabatic expansion in response to decreasing dark matter and stellar mass in the centers of galaxies (Figures 13 and 14).
Figure 19 plots the evolution in stellar and dark matter mass within 0.5 kpc of galaxy center relative to pericenter passage. Unlike the other figures, we zoom into the 5 Gyrs bracketing pericenter passage for all galaxies. At high mass, we see some evidence for a decrease in both stellar mass and dark matter mass as the galaxy experiences its first pericenter passage, indicative of both tidal heating and enhanced tidal stripping as the galaxy interacts with the higher density near the center of the cluster. At low masses, however, there is little evidence of a decrease in central density associated with pericenter passage. Rather, there is a gradual decline in both stellar mass and dark matter mass in the central 0.5 kpc over time beginning prior to pericenter passage and continuing well after.
Figure 18 also shows the evolution in central surface brightness relative to pericenter passage (bottom panels). The majority of the more massive dwarfs quench close to their first pericenter passage and, consistent with Figure 12 in the previous section, the central surface brightness begins to decline after this point. Lower mass galaxies have their central surface brightness already well in decline at the time of pericenter passage, consistent with the fact that these galaxies typically quench Gyr prior to pericenter passage.
While the size evolution due to tidal heating helps determine the final size of the more massive dwarfs, this evolution does not in the end determine their classification as UDGs. The classification of low mass dwarfs is more sensitive to their final size, which we have shown in this section to not have strong effects, on average, from tidal heating. At no mass scale is there evidence that UDGs and non-UDGs experience different evolution in their size or central surface brightness.
4.3 Angular momentum and galaxy sizes
Previous work has theorized that angular momentum is important for determining the sizes of galaxies and that low surface brightness galaxies reside preferentially in halos with larger spin (e.g. Dalcanton et al., 1997; Di Cintio et al., 2019). A similar argument has been made with respect to the origin of UDGs (e.g. Amorisco & Loeb, 2016). To study the effect of angular momentum on the sizes of galaxies in cluster and field environments in the Romulus simulations, we use the dimensionless spin parameter, (Bullock et al., 2001). AHF calculates this parameter for each halo in the simulation at all times, accounting for the angular momentum of all halo particles () as well as just gas particles (). This dimensionless parameter is convenient because it is redshift independent, allowing us to directly compare the spins of halos and gas at different times. However, it is also important to take into account the fact that cluster galaxies are subject to environmental effects that strip away dark matter, as well as all gas, from low mass galaxies. It is reasonable that the final halo spins may not fully represent the effect that angular momentum has on the halo as the galaxy is forming most of its stars. In Figure 11 we show that lower mass dwarf galaxies that are larger at (i.e. UDGs) are also larger at earlier times. In order to capture a potential trend between angular momentum and the formation of dwarf galaxies, we use values for and calculated at , the time at which 50% of the stars have formed in the galaxy. By doing this we sample the state of the halo and potential star forming gas during a period when the galaxy is still growing and ensure that the gas and dark matter have not yet been significantly stripped by the cluster environment.
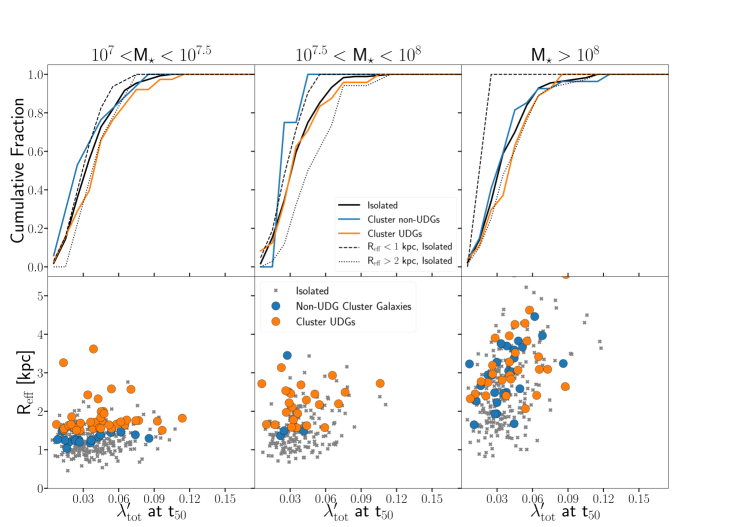
The top panels of Figure 20 plot the distributions of at for non-UDG cluster dwarfs (blue) and for UDGs (orange) in our three mass bins. We also show the distribution for the population of isolated dwarf galaxies in Romulus25 (black, solid). While UDGs do tend to have slightly higher spin values than non-UDGs, the difference is small and both are similar to the overall population of isolated dwarf galaxies. The lower panels of Figure 20 are scatter plots showing the relationship between the final effective radius and the spin parameter measured at . Galaxy sizes tend to increase toward larger spin parameters, with a stronger relationship at higher masses, but the correlation is relatively weak as the halos do not have a large diversity of spin parameters within any mass bin. Controlling for spin parameter, cluster dwarf galaxies are still typically larger, lacking the smaller dwarf galaxies present in isolation in all three mass bins.
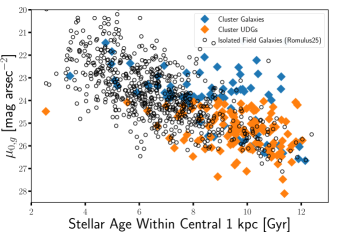
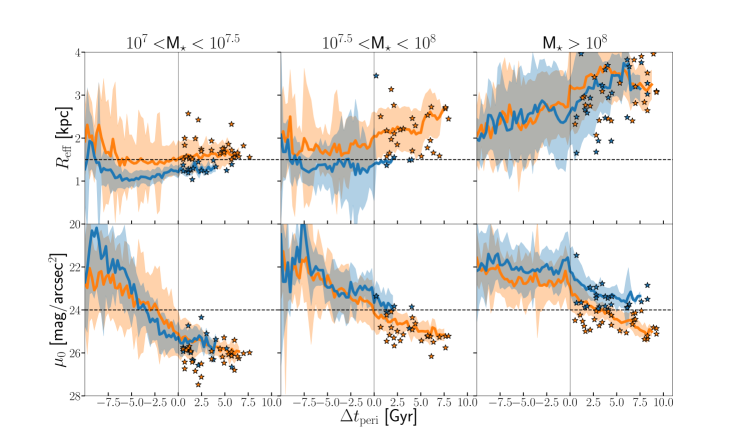
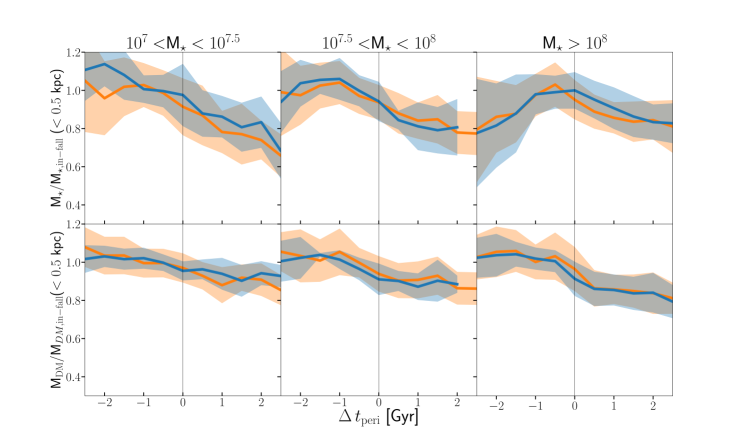
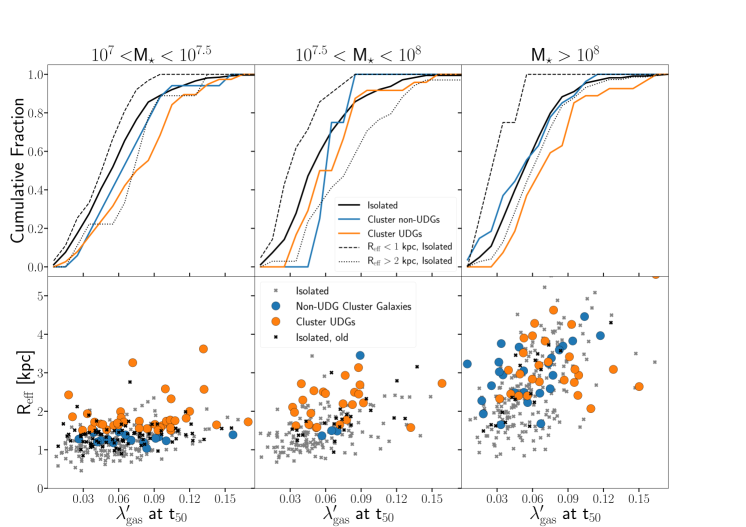
Figure 21 is similar to Figure 20 but for , the spin parameter calculated only for gas particles, at t50. Compared to total spin, there is a more significant difference in the gas spin distribution for isolated compact (R kpc; dashed, black) and large (R kpc; dotted, black) dwarf galaxies in all three mass bins. This can also be seen in the scatter plots on the bottom, where there is a more pronounced dependence of Reff on (and overall more diversity among galaxies at all mass bins). Similar to total spin, the UDGs have a slight tendency to have higher gas spin values than non-UDGs in the cluster. At the two lower mass bins, even non-UDGs are more likely to have higher gas angular momentum compared to isolated dwarfs. This lack of low angular momentum gas at low masses can explain, in part, the lack of compact dwarf galaxies in RomulusC. Galaxies with low spin parameters () and M M⊙ make up a large portion of the most compact isolated dwarf galaxies.
Still, the scatter plot on the bottom of Figure 21 shows that even controlling for gas spin, isolated galaxies tend to be smaller than cluster galaxies. This difference goes away, however, if we control for the fact that cluster dwarfs are preferentially quenched with much older stellar populations. The black points on the scatter plot show that, for a given gas spin parameter at t50, isolated dwarf galaxies with older stellar populations in their centers (a mass-weighted age of Gyrs within the inner 1 kpc) have larger sizes, more comparable to cluster dwarf galaxies. While gas angular momentum may contribute to the lack of small galaxies, particularly at low mass, the quenching of star formation also results in dwarfs with larger effective radii. This is likely a combination of 1) younger central stellar populations being brighter and pushing the effective radius inward and 2) wind mass loss and dark matter tidal stripping decreasing the inner mass density over time and puffing the galaxy up, as we describe in §4.1. This may also be partially due to a resolution effect which we discuss further in §5.
5 Discussion
In this section we will review our results in light of other observational and theoretical work and discuss various numerical effects that may have influenced our results.
5.1 The role of the cluster environment in the formation of UDGs
UDGs in the RomulusC simulation are formed through interactions with their dense cluster environment. A combination of tidal stripping and heating result in a typical increase in effective radius of after in-fall into the cluster, consistent with previous simulations presented in Jiang et al. (2019a), but only at the lowest masses does this increase in radius affect the final UDG classification. The cluster environment is crucial in shutting off star formation in low mass galaxies via ram pressure stripping (as seen in Figure 15). Jiang et al. (2019a) also find that ram-pressure, rather than tidal stripping, is the main mechanism through which gas is removed from low mass galaxies in groups. Star formation in the more massive dwarfs often remains present longer ( Gyr) after in-fall, typically until first pericenter passage, but lower mass galaxies can quench even before cluster in-fall. In Tremmel et al. (2019) we find a significant population of galaxies that quench prior to in-fall and, of these, 71% were once within the virial radius of another halo. Indeed observations have shown a significant population of quenched galaxies at large cluster-centric distances (Fujita, 2004; Haines et al., 2015). Simulations have shown that galaxies can also be quenched by the larger scale ICM without being a satellite prior to in-fall (Bahé et al., 2013; Zinger et al., 2018). It is possible that there may be other observational signatures in cluster dwarf galaxies such that their history of being pre-processed by another halo may be inferred, which we leave to future work. One limitation to this is that our zoom-in region only extends to R200 at . Future cosmological cluster simulations will be needed to better understand the formation of UDGs at larger cluster-centric distances.
We see an evolution in effective radius for both UDGs and non-UDGs that at high masses is associated with pericenter passage, in agreement with previous studies (e.g. Jiang et al., 2019a; Liao et al., 2019). The cause of such a sudden expansion is likely tidal heating. At low masses, the typical evolution in effective radius occurs more gradually as the stars respond to the loss of stellar mass via stellar winds and supernovae, a sudden loss of gas due to ram pressure, and the tidal stripping of dark matter in their cores, as seen in simulations of satellites in lower mass systems (Arraki et al., 2014). We find no clear difference in the size evolution of galaxies classified as UDGs and non-UDGs at . Only for the lowest mass galaxies does this size evolution play a significant role in their final classification, as all of the higher mass galaxies have large enough effective radii to meet our criteria. We stress that while on average low mass galaxies do not experience the sudden increase in effective radii that would result from tidal heating, there are individual cases where this does occur. What we conclude, rather, is that rapid expansion due to tidal heating is not a requirement for UDG formation in RomulusC, nor is it a unique occurrence in UDGs with respect to non-UDGs.
The importance of tidal heating may also depend on the mass of the host halo. On cluster scales, the magnitude of tidal heating seems to be similar to what is found at group scales (Jiang et al., 2019a), but Liao et al. (2019) find significantly more size evolution in their Milky Way-mass simulations. With earlier formation times, it may be that satellite halos experience a different evolution on average. For example, if more satellites are accreted at earlier times, they will interact with a denser halo and may be more susceptible to tidal heating.
While size evolution matters at the lowest masses, passive evolution is the dominant mechanism that controls formation of UDGs in this simulation. None of our dwarf galaxies have low enough central surface brightness to be considered UDGs prior to quenching. Dwarf galaxies can easily be large enough to be considered UDGs while still relatively isolated (i.e. well before in-fall into the cluster) but the cluster environment is important for quenching star formation, leading to decreased central surface brightness and redder colors more consistent with observed cluster UDGs across all masses explored here. This is in contrast to simulations that find isolated UDGs with low central surface brightnesses without quenching (Di Cintio et al., 2017b; Chan et al., 2018). This may have to do with the different, more explosive feedback prescriptions used in the other works, as well as their higher resolution capable of capturing the influence of SN feedback on the stellar and dark matter mass distribution. However, this is not to say that UDGs can only form in cluster environments within the Romulus framework. In Wright et al. (2020) we show that UDGs can form in isolation in Romulus25, and we will compare the formation channels in different environments.
Our prediction that the passive evolution of aging stellar populations is the critical mechanism to form UDGs agrees with observations of UDGs in clusters. Román & Trujillo (2017b) find populations of both red UDGs and blue UDGs, with the latter having slightly higher surface brightness than what would be considered a UDG under our definition. They then predict the surface brightness profiles for the blue UDGs after 6 Gyrs of passive evolution and find similar properties to the red UDGs, specifically a much lower central and average surface brightness. This is essentially the exact scenario predicted by RomulusC. As in the observed sample in Román & Trujillo (2017b), there is little evolution in morphology (as traced by the Sersic index) during this process. This scenario is also consistent with the fact that there is little evidence for tidal distortions in the stellar distributions of UDGs in the Coma cluster (Mowla et al., 2017).
On average UDGs have experienced very similar evolutionary histories compared to non-UDGs in RomulusC and cannot be considered a fully separate population. Mancera Piña et al. (2019) also find, using a large sample of UDGs spanning several galaxy clusters, that UDG properties are a continuation of the ambient dwarf galaxy population. One way in which UDGs and non-UDGs tend to differ is their in-fall time, with UDGs typically crossing R200 earlier than non-UDGs. A small sub-set of UDGs in Coma have been found to have metallicities, ages, and star formation histories consistent with normal dwarf galaxies, along with kinematics consistent with recent in-fall into the cluster (Alabi et al., 2018; Ferré-Mateu et al., 2018). While we do find that there are plenty of UDGs that have recently fallen into the cluster, plenty more have fallen in much earlier ().
5.2 Angular momentum and galaxy sizes
We show in §4.3 that cluster galaxies lack the population of dwarfs that form from low angular momentum gas. These are the galaxies that make up the most compact dwarf galaxies in isolation. Dwarf galaxies residing in very high spin dark matter halos has been proposed as a way of forming UDGs (Amorisco & Loeb, 2016; Liao et al., 2019). We study this connection using the dimensionless gas spin parameter, measured at , the time at which half of the stars in the galaxy have formed. Ex-situ star formation makes this connection complicated, but we confirm that using and yield qualitatively similar results, although does show the most significant difference between cluster and field galaxies.
The connection between gas angular momentum and galaxy size has been seen in other cosmological simulations, where star forming gas with high angular momentum remains at large distances. This results in lower surface brightness, larger galaxies (Di Cintio et al., 2019). The origin of the difference in gas angular momentum among cluster and isolated dwarf galaxies in Romulus is still uncertain and we leave this to future work. It is possible that these galaxies have expelled their lower angular momentum gas (e.g. Brook et al., 2011; Christensen et al., 2016), but that doesn’t explain the environmental dependence. It is possible that the galaxies in cluster environments are more likely to accrete higher angular momentum gas. Recently, Tadaki et al. (2019) showed evidence for high rates of gas accretion in proto-cluster environments, but the star formation rates were comparable to field galaxies. This lower star formation efficiency could be due to gas accreting with higher angular momentum. Such gas would spend more time at the outskirts of the galaxy at lower densities rather than quickly falling to the center where densities would increase faster.
Looking at either total or gas spin parameter, we find that our results contrast those from Amorisco & Loeb (2016) who predict that UDGs form in halos with significantly higher spin compared to average dwarf galaxies. Despite hints that gas angular momentum is important for creating larger galaxies in cluster environments, the values for both and are not significantly different from the average, isolated dwarf galaxy. This disconnect between gas and halo angular momentum is in agreement with other cosmological simulations (e.g. Teklu et al., 2015; Jiang et al., 2019b), many of which also predict misalignment between galaxy and dark matter halo angular momenta (e.g. Hahn et al., 2010). As discussed in Jiang et al. (2019b), the connection between galaxy size and spin is probably stronger if one only considered the inner halo, although part of this would be driven by the dominance of baryons in the mass (and therefore angular momentum) budget in this region.
5.3 Choice of UDG definition
We chose to define our UDG population based on the definition used in van Dokkum et al. (2015) as well as several other works. Using this criteria for UDG classification, we identify 80 UDGs within R200 of the M⊙ RomulusC galaxy cluster, approximately twice as may as observations have found for halos of this mass (Román & Trujillo, 2017b; van der Burg et al., 2017; Mancera Piña et al., 2018). It is important to note that our classifications are done assuming a face-on observer, where galaxies have the least surface brightness. Were they to be observed at different viewing angles, these galaxies may not be classified as UDGs so this number should be considered an upper limit. We also calculate surface brightness profiles using simple radial bins, rather than performing a full analysis with GalFit. It is unlikely that this would have a large effect on our results, but it could mean that we overestimate the effective radius for our galaxies with lower axis ratios. In future work we will both examine the effect of galaxy orientation and examine in more detail the morphology of UDGs, including their axis ratios (Van Nest et al., in prep).
There are other definitions that have been used in the literature for various bandpasses. All definitions generally require an effective radius of kpc or similar. A common alternative definition involves using the mean surface brightness within Reff, rather than the central surface brightness (Koda et al., 2015; van der Burg et al., 2016; Ferré-Mateu et al., 2018). At a fixed stellar mass, Reff and mean surface brightness are directly related to one another: larger galaxies have a lower mean surface brightness. In this way, the central surface brightness is a more orthogonal criterion to the effective radius which is why we choose to adopt it in this work. Following van der Burg et al. (2016), were we to define galaxies as UDGs using their r-band properties such that mag/arcsec2, most of our high mass dwarf galaxies would be classified as UDGs while most of our low mass galaxies would lie below the allowed range of surface brightness. Were we to apply this criteria, we would get 51 UDGs within R200, significantly closer to the observations. The effective radius is similar between g and r-bands so the main effect of adopting different criteria is really the range of allowed mean surface brightness. Taking into account observational limitations in detecting objects with low mean surface brightness pushes the number of large, diffuse dwarf galaxies in RomulusC closer to observations.
While the detailed accounting of the UDG population in RomulusC does depend on the classification criteria, our results regarding formation are insensitive to the specific selection criteria adopted for UDGs. We show in Figures 10, 11, and 12 that the evolution of UDGs and non-UDG dwarf galaxies are very similar. Figure 15 demonstrates that the passive evolution of the quenched galaxies affects the mean surface brightness as well as . Similarly there is little difference in the evolution in except that UDG progenitors tend to be larger than those of non-UDGs prior to cluster in-fall. When each galaxy does or does not cross the UDG threshold depends mostly on how long it has been quenched. The same qualitative results will hold true for UDG criteria that use the mean surface brightness rather than the central surface brightness.
5.4 Important Caveats and Resolution Limitations
While RomulusC is state-of-the-art for cosmological simulations of halos of this mass, the spatial and mass resolution are still low compared to zoom-in cosmological simulations of isolated galaxies and it is important to understand how this might affect our results.
5.4.1 Artificial disruption of cluster galaxies
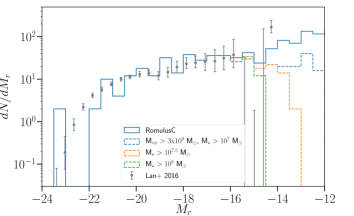
Limitations from both resolution and halo finding technique can lead to us missing galaxies closest to the center of the cluster. Figure 22 plots the luminosity function for cluster galaxies in RomulusC compared to similar mass observed clusters from Lan et al. (2016). As in observations, there is an up-turn in the number of low luminosity galaxies at . This feature is common among a wide range of host halo masses, but in RomulusC this effect is smaller than in observations. While the solid blue line in Figure 22 is for all galaxies hosted in halos with at least 1000 dark matter particles, the other three lines are for cuts we make in this work. Many low luminosity galaxies are ignored in our analysis due to our cuts on stellar and dark matter mass, driven by a strict criteria for what we consider resolved in the simulation. Thus at low masses we are pushing against the resolution limits of the simulation, which is why it is not surprising we begin to see more discrepancy with observations in this regime. It is possible that this is caused by galaxies and their host halos becoming artificially disruption due to low particle counts and poor spatial resolution (van den Bosch et al., 2018; van den Bosch & Ogiya, 2018). In other words, our analysis may miss low mass galaxies that have experienced the strongest tidal interactions with the cluster potential and should survive to . This may contribute to the lack of tidal heating we see in our low mass cluster dwarfs (§4.2) compared to higher mass galaxies as we may be selecting a biased sub-sample of the low mass dwarf galaxy population. However, the fact that we still form UDGs despite this bias indicates that strong tidal heating is not a strict requirement for low mass galaxies to attain UDG-like properties. We find that low mass galaxies are less likely to have experienced the highest background densities and therefore strongest tidal forces compared to more massive dwarfs. In part this is because massive galaxies with earlier in-fall times are more likely to survive until and are therefore more likely to have interacted with a denser (proto-)cluster environment. Controlling for in-fall time accounts for at least some of this difference, but not all. The results are similar if we control for the time of pericenter passage.
In a similar vein, for our time evolution analysis (§4.1 and 4.2) we did not include galaxies that could not be traced back in time to before cluster in-fall (a population that encompasses of our surviving galaxies). While artificial disruption described above will result in ‘over-merging’ of substructure, effectively removing them from the population, halo finding algorithms also have known problems tracking substructure within the inner regions of a halo (e.g. Joshi et al., 2016). This could hinder our ability to effectively trace a galaxy’s full history through each simulation snapshot and would preferentially affect galaxies that come closer to cluster center.
5.4.2 Resolution and galaxy sizes
The RomulusC simulation notably lacks compact dwarf galaxies (R kpc) in the cluster environment, despite the fact that many such galaxies have been observed (Gavazzi et al., 2005; Eigenthaler et al., 2018; Venhola et al., 2019b). In §4.3 and §5.2 we discuss the role that angular momentum of gas plays in the difference between field and cluster dwarf galaxies. Indeed the field galaxies can attain more compact sizes, but the average size even for field dwarfs in Romulus25 plateaus around kpc, or approximately four times the gravitational softening length of the simulation. Many simulations, including some at higher resolution, have had difficulty creating compact low mass galaxies in isolation or as satellites (e.g. El-Badry et al., 2016; Lupi et al., 2017; Jiang et al., 2019a; Chan et al., 2018; Santos-Santos et al., 2018; Garrison-Kimmel et al., 2019). While this can often be attributed to feedback and/or ISM sub-grid models, in Romulus the issue is at least partially due to resolution. With a spline kernel softening length of 350 pc, structures well below 1 kpc are difficult to resolve. Further, the relatively low resolution and simple ISM physics means that star formation must be allowed to occur at relatively low densities. All together, this means that it is difficult to generate very dense structures in the simulation such that more than half of a galaxy’s mass is within kpc from the galaxy center. This lower limit to structure can be seen in the flattening of the size-mass relation (Figure 2) at stellar masses lower than M⊙. The flattening occurs just above 1 kpc and results in our lowest mass galaxies being a factor of times larger than the empirical relation. If the resolution of Romulus acts to create, on average, larger low mass galaxies it may mean that we form UDGs too easily because more galaxies are already more diffuse. However, we stress that the results we present here connecting quenching, passive evolution, and surface brightness evolution are robust to such resolution effects.
5.4.3 Two body interactions and energy equipartition
Galaxies resolved with only a few hundred star particles (like those in our lowest mass bin) are subject to effects related to two-body relaxation and energy equipartition among different mass particles (Ludlow et al., 2019). Even though dark matter particles have similar mass to gas particles in the Romulus simulations, star particles form with only 30% of their parent gas particle mass. It may be the case that the decrease in central stellar mass densities (see Figure 14) and increase in galaxy sizes (see Figure 11) are results of this effect, which causes the puffing up of stars relative to the more massive dark matter particles, particularly in quiescent galaxies. However, the change we see in central density is only on average and can mostly be explained by wind mass loss from aging stellar populations as well as the decreasing dark matter mass density (see Figure 13). According to Ludlow et al. (2019), energy equipartition should result in an increase in the sizes of galaxies over time. However, while Ludlow et al. (2019) predict a continuous puffing up of stars over time, the evolution we find at low masses slows after a few Gyr from when star formation was quenched. This is evidence that the majority of this evolution is directly related to passive stellar evolution and mass loss.
5.4.4 Resolution and ram pressure stripping
Dense, molecular gas would be more resistant to ram pressure in the cluster environment, but such dense gas is unresolved in the simulation. Therefore even though at this resolution ram pressure stripping itself is well resolved (Roediger et al., 2015), the fact that star forming gas is less dense will make it artificially more efficient at being removed from galaxies interacting with the cluster environment. Further, feedback taking place in low density gas in low mass galaxies may be too efficient at disturbing the cold gas and make it even more susceptible to being stripped even in relatively low density environments (Schaye et al., 2015; Bahé et al., 2017). Using Romulus25 we confirm that in isolation we do not produce a significant population of quenched dwarf galaxies above a stellar mass of M⊙. Only at our lowest masses (MM⊙) do we begin to see significant evidence of such overquenching. However, we do not expect this to have a significant impact on our results, as the majority of UDGs fell into the cluster at early times. Even if they quench sooner than they should due to these resolution issues, they would have still had time to passively evolve for Gyrs, which in most cases is enough for galaxies to become UDGs at these low masses.
5.4.5 The lack of dark matter cores
Feedback from supernovae can affect the distributions of both stars and dark matter in dwarf galaxies, but this requires simulations that can resolve individual, dense star-forming regions (Governato et al., 2010, 2012; Pontzen & Governato, 2012, 2013; Di Cintio et al., 2014; El-Badry et al., 2016; Dutton et al., 2019). As already discussed at length, the limited resolution attainable for such a massive simulation as RomulusC means that the multiphase ISM cannot be resolved and stars must form in gas with lower density and higher temperature thresholds. This affects the environment in which supernovae explode and their spatial distribution throughout the galaxy. This low resolution model is incapable of forming cored dark matter profiles (e.g. Genina et al., 2018; Bose et al., 2019; Dutton et al., 2019).Other simulations have shown that this same interaction is important for puffing up the stellar mass distribution in dwarf galaxies and is directly related to forming UDGs in isolation (Di Cintio et al., 2017a; Chan et al., 2018). While the lack of dark matter cores is not a prediction of the simulation, but a result of its lower resolution, the fact that UDGs still form in RomulusC means that the formation channels we predict in this work are unique compared to that of Di Cintio et al. (2019) where bursty star formation, efficient feedback, and cored dark matter profiles are critical. In reality, it is likely that a combination of both processes are important for shaping the UDG population in both isolation and in clusters.
A cuspier dark matter profile may contribute to the lack of tidal heating of low mass dwarf galaxies in RomulusC as there is more binding energy to hold the galaxies together (Carleton et al., 2019). Still, we show in this work that impulsive tidal interactions are not required to form UDGs in the first place. The lack of dark matter cores may also contribute to Sersic indices that are slightly larger than observed UDGs (see Figure 5). More central mass concentration could mean more concentrated stellar distribution and therefore higher Sersic index.
6 Summary and Conclusions
We have selected galaxies from the RomulusC cosmological zoom-in simulation of a galaxy cluster that fit the criteria of van Dokkum et al. (2015) for being considered ultra-diffuse (R kpc, mag/arcsec2). The UDGs in RomulusC match well with the observed properties of cluster UDGs. Our simulated UDGs are all dwarf galaxies, so we compare the population of UDGs to the overall population of dwarf galaxies in the cluster (M M⊙). We leverage the fact that we can trace all galaxies back in time to better understand the role of environment in forming the UDG population. We also compare to the population of isolated dwarf galaxies from the Romulus25 simulation.
-
•
UDGs in galaxy clusters form from dwarf galaxies that have their gas removed and star formation quenched due to ram pressure as they travel through the hot, dense cluster environment. The subsequent passive stellar evolution is the cause of their low surface brightness at .
-
•
The evolution in central surface brightness is similar for UDGs and non-UDGs. Prior to quenching, UDG progenitors are 1-2 magnitudes brighter than what is required for UDG classification. This evolution cannot be accounted for by decreasing central stellar densities, which fall by typically only over the course of the simulation.
-
•
Passive evolution of stars results in a relationship between stellar age and central surface brightness that is the same in the cluster environment as it is for isolated galaxies. Dwarfs with older stellar populations have lower central surface brightness.
-
•
The evolution of galaxy morphology is similar for UDGs and non-UDGs. UDG progenitors tend to be slightly larger at low masses. Dwarf galaxies that fall into the cluster earlier () are approximately twice as likely () to become UDGs as those that fall in later.
-
•
The classification of lower mass dwarf galaxies (M M⊙) as UDGs depends mostly on their effective radius, while for higher mass dwarfs it depends on their central surface brightness.
-
•
UDGs are not a separate population compared to non-UDG dwarf galaxies in terms of absolute magnitude, central surface brightness, and effective radius. Rather, they are part of a continuous distribution of dwarf morphologies. UDGs also have similar positions and velocities relative to the center of the cluster as non-UDGs and have similar Sersic indices compared to both non-UDG cluster dwarfs and isolated dwarfs.
-
•
Both UDGs and non-UDG dwarf galaxies are, at the time of their maximum halo mass, consistent with the stellar mass-halo mass relation. UDGs have dark matter halos with peak virial mass below M⊙. Tidal stripping results in decreased halo masses and central dark matter densities at , but does not affect their final stellar mass.
-
•
Both UDGs and non-UDGs have similar halo spin values at , the time at which 50% of the galaxy’s final stellar mass has assembled. Halo spin is similar between cluster and isolated galaxies.
-
•
The effective radius of all dwarf galaxies increases typically by after quenching and in-fall into the cluster. For higher mass dwarfs this evolution is due to tidal heating at pericenter, consistent with previous results (Jiang et al., 2019a). For lower mass galaxies this evolution is more gradual, likely due to adiabatic expansion in response to a changing mass distribution. Only at low masses does this expansion play a significant role in the classification of UDGs.
-
•
Cluster dwarf galaxies lack the population of more compact dwarfs (R kpc) seen for isolated galaxies in Romulus25. This can be partly attributed to the increasing size following in-fall and quenching due to tidal stripping, tidal heating, and passive evolution. There is also a dearth of dwarf galaxies forming from very low angular momentum gas in the cluster environment compared to the field.
These results show that UDGs do not experience unique evolution compared to other cluster dwarf galaxies. Rather, early in-fall and quenching followed by Gyrs of passive evolution naturally result in a population of low surface brightness galaxies. This is aided by tidal interactions with the cluster potential, such as tidal stripping and heating, which, in conjunction with passive stellar evolution and ram pressure, result in a modest expansion in galaxy effective radius. Despite, on average, having similar evolutionary paths, there are individual UDG cases where the evolution occurs more violently through both interaction with the cluster potential or close encounters with other cluster galaxies. We leave it to future work to examine individual cases in the RomulusC simulation. In Wright et al. (2020) we build on these results and examine the population of UDGs in lower mass halos and in isolation using the Romulus25 simulation in order to compare formation channels in different environments.
Acknowledgments
The authors thank the anonymous referee for their thorough reading and constructive comments which have significantly improved the manuscript. The authors also thank Pieter van Dokkum, Shany Danieli, Lamiya Mowla, Johnny Greco, Frank van den Bosch, Arianna di Cintio, Pavel Mancera Piña, Christopher Conselice, and Priya Natarajan for useful discussions related to this work. MT gratefully acknowledges support from the YCAA Prize Postdoctoral Fellowship. ACW is supported by an ACM SIGHPC/Intel Computational & Data Science fellowship. AMB, FM, and DN acknowledge the hospitality at the Aspen Center for Physics, which is supported by National Science Foundation grant PHY-1607611. TQ was partially supported by NSF award AST-1514868. This research is part of the Blue Waters sustained-petascale computing project, which is supported by the National Science Foundation (awards OCI-0725070 and ACI-1238993) and the state of Illinois. Blue Waters is a joint effort of the University of Illinois at Urbana-Champaign and its National Center for Supercomputing Applications. This work is also part of a PRAC allocation support by the National Science Foundation (award number OAC-1613674). The analysis presented in this Paper was done using the publicly available software packages, pynbody (Pontzen et al., 2013) and TANGOS (Pontzen & Tremmel, 2018), primarily with resources provided by the NASA High-End Computing (HEC) Program through the NASA Advanced Supercomputing (NAS) Division at Ames Research Center.
Data Availability
The data for this work was generated from a proprietary branch of the ChaNGa N-Body+SPH code (Menon et al., 2015). The public repository for ChaNGa is available on github (https://github.com/N-BodyShop/changa). Analysis was conducted using the publicly available software pynbody (Pontzen et al., 2013, https://github.com/pynbody/pynbody) and TANGOS (Pontzen & Tremmel, 2018, https://github.com/pynbody/tangos). These results were generated from the RomulusC and Romulus25 cosmological simulations. The raw output from these simulations can be accessed upon request from Michael Tremmel (michael.tremmel@yale.edu), along with the TANGOS database files that were generated from these outputs and directly used for this analysis.
References
- Alabi et al. (2018) Alabi A., et al., 2018, MNRAS, 479, 3308
- Amorisco & Loeb (2016) Amorisco N. C., Loeb A., 2016, MNRAS, 459, L51
- Arraki et al. (2014) Arraki K. S., Klypin A., More S., Trujillo-Gomez S., 2014, MNRAS, 438, 1466
- Bahé et al. (2013) Bahé Y. M., McCarthy I. G., Balogh M. L., Font A. S., 2013, MNRAS, 430, 3017
- Bahé et al. (2017) Bahé Y. M., et al., 2017, MNRAS, 470, 4186
- Behroozi et al. (2013) Behroozi P. S., Wechsler R. H., Wu H.-Y., Busha M. T., Klypin A. A., Primack J. R., 2013, ApJ, 763, 18
- Bekki & Couch (2003) Bekki K., Couch W. J., 2003, ApJ, 596, L13
- Bose et al. (2019) Bose S., et al., 2019, MNRAS, 486, 4790
- Boselli et al. (2014) Boselli A., et al., 2014, A&A, 570, A69
- Brook et al. (2011) Brook C. B., et al., 2011, MNRAS, 415, 1051
- Bullock et al. (2001) Bullock J. S., Dekel A., Kolatt T. S., Kravtsov A. V., Klypin A. A., Porciani C., Primack J. R., 2001, ApJ, 555, 240
- Butsky et al. (2019) Butsky I. S., Burchett J. N., Nagai D., Tremmel M., Quinn T. R., Werk J. K., 2019, MNRAS, 490, 4292
- Cameron (2011) Cameron E., 2011, Publications of the Astronomical Society of Australia, 28, 128
- Cannon et al. (2011) Cannon J. M., et al., 2011, ApJ, 739, L22
- Carleton et al. (2019) Carleton T., Errani R., Cooper M., Kaplinghat M., Peñarrubia J., Guo Y., 2019, MNRAS, 485, 382
- Chan et al. (2018) Chan T. K., Kereš D., Wetzel A., Hopkins P. F., Faucher-Giguère C. A., El-Badry K., Garrison-Kimmel S., Boylan-Kolchin M., 2018, MNRAS, 478, 906
- Christensen et al. (2014) Christensen C. R., Governato F., Quinn T., Brooks A. M., Shen S., McCleary J., Fisher D. B., Wadsley J., 2014, MNRAS, 440, 2843
- Christensen et al. (2016) Christensen C. R., Davé R., Governato F., Pontzen A., Brooks A., Munshi F., Quinn T., Wadsley J., 2016, ApJ, 824, 57
- Cohen et al. (2018) Cohen Y., et al., 2018, ApJ, 868, 96
- Conselice et al. (2003) Conselice C. J., Gallagher John S. I., Wyse R. F. G., 2003, AJ, 125, 66
- Dalcanton et al. (1997) Dalcanton J. J., Spergel D. N., Summers F. J., 1997, ApJ, 482, 659
- Dalla Vecchia & Schaye (2012) Dalla Vecchia C., Schaye J., 2012, MNRAS, 426, 140
- Di Cintio et al. (2014) Di Cintio A., Brook C. B., Dutton A. A., Macciò A. V., Stinson G. S., Knebe A., 2014, MNRAS, 441, 2986
- Di Cintio et al. (2017a) Di Cintio A., Brook C. B., Dutton A. A., Macciò A. V., Obreja A., Dekel A., 2017a, MNRAS, 466, L1
- Di Cintio et al. (2017b) Di Cintio A., Tremmel M., Governato F., Pontzen A., Zavala J., Bastidas Fry A., Brooks A., Vogelsberger M., 2017b, MNRAS, 469, 2845
- Di Cintio et al. (2019) Di Cintio A., Brook C. B., Macciò A. V., Dutton A. A., Cardona-Barrero S., 2019, MNRAS, 486, 2535
- Du et al. (2019) Du M., et al., 2019, ApJ, 875, 58
- Dutta Chowdhury et al. (2019) Dutta Chowdhury D., van den Bosch F. C., van Dokkum P., 2019, arXiv e-prints, p. arXiv:1902.05959
- Dutton et al. (2019) Dutton A. A., Macciò A. V., Buck T., Dixon K. L., Blank M., Obreja A., 2019, MNRAS, 486, 655
- Eigenthaler et al. (2018) Eigenthaler P., et al., 2018, ApJ, 855, 142
- El-Badry et al. (2016) El-Badry K., Wetzel A., Geha M., Hopkins P. F., Kereš D., Chan T. K., Faucher-Giguère C.-A., 2016, ApJ, 820, 131
- Ferré-Mateu et al. (2018) Ferré-Mateu A., et al., 2018, MNRAS, 479, 4891
- Fujita (2004) Fujita Y., 2004, Publications of the Astronomical Society of Japan, 56, 29
- Fujita & Nagashima (1999) Fujita Y., Nagashima M., 1999, ApJ, 516, 619
- Garrison-Kimmel et al. (2019) Garrison-Kimmel S., et al., 2019, MNRAS, 487, 1380
- Gavazzi et al. (2005) Gavazzi G., Donati A., Cucciati O., Sabatini S., Boselli A., Davies J., Zibetti S., 2005, A&A, 430, 411
- Geha et al. (2012) Geha M., Blanton M. R., Yan R., Tinker J. L., 2012, ApJ, 757, 85
- Genina et al. (2018) Genina A., et al., 2018, MNRAS, 474, 1398
- Girardi et al. (2010) Girardi L., et al., 2010, ApJ, 724, 1030
- Governato et al. (2010) Governato F., et al., 2010, Nature, 463, 203
- Governato et al. (2012) Governato F., et al., 2012, MNRAS, 422, 1231
- Governato et al. (2015) Governato F., et al., 2015, MNRAS, 448, 792
- Greco et al. (2018) Greco J. P., et al., 2018, ApJ, 857, 104
- Guedes et al. (2011) Guedes J., Callegari S., Madau P., Mayer L., 2011, ApJ, 742, 76
- Haardt & Madau (2012) Haardt F., Madau P., 2012, ApJ, 746, 125
- Hahn et al. (2010) Hahn O., Teyssier R., Carollo C. M., 2010, MNRAS, 405, 274
- Haines et al. (2015) Haines C. P., et al., 2015, ApJ, 806, 101
- Haynes et al. (2011) Haynes M. P., et al., 2011, AJ, 142, 170
- Impey et al. (1988) Impey C., Bothun G., Malin D., 1988, ApJ, 330, 634
- Jester et al. (2005) Jester S., et al., 2005, AJ, 130, 873
- Jiang & van den Bosch (2016) Jiang F., van den Bosch F. C., 2016, MNRAS, 458, 2848
- Jiang et al. (2019a) Jiang F., Dekel A., Freundlich J., Romanowsky A. J., Dutton A. A., Macciò A. V., Di Cintio A., 2019a, MNRAS, p. 1490
- Jiang et al. (2019b) Jiang F., et al., 2019b, MNRAS, 488, 4801
- Joshi et al. (2016) Joshi G. D., Parker L. C., Wadsley J., 2016, MNRAS, 462, 761
- Katz & White (1993) Katz N., White S. D. M., 1993, ApJ, 412, 455
- Knollmann & Knebe (2009) Knollmann S. R., Knebe A., 2009, ApJS, 182, 608
- Koda et al. (2015) Koda J., Yagi M., Yamanoi H., Komiyama Y., 2015, ApJ, 807, L2
- Kravtsov et al. (2018) Kravtsov A. V., Vikhlinin A. A., Meshcheryakov A. V., 2018, Astronomy Letters, 44, 8
- Kronberger et al. (2008) Kronberger T., Kapferer W., Ferrari C., Unterguggenberger S., Schindler S., 2008, A&A, 481, 337
- Kroupa (2001) Kroupa P., 2001, MNRAS, 322, 231
- Lan et al. (2016) Lan T.-W., Ménard B., Mo H., 2016, MNRAS, 459, 3998
- Lange et al. (2016) Lange R., et al., 2016, MNRAS, 462, 1470
- Leja et al. (2019) Leja J., et al., 2019, ApJ, 877, 140
- Liao et al. (2019) Liao S., et al., 2019, arXiv e-prints, p. arXiv:1904.06356
- Ludlow et al. (2019) Ludlow A. D., Schaye J., Schaller M., Richings J., 2019, MNRAS, 488, L123
- Lupi et al. (2017) Lupi A., Volonteri M., Silk J., 2017, MNRAS, 470, 1673
- Mancera Piña et al. (2018) Mancera Piña P. E., Peletier R. F., Aguerri J. A. L., Venhola A., Trager S., Choque Challapa N., 2018, MNRAS, 481, 4381
- Mancera Piña et al. (2019) Mancera Piña P. E., Aguerri J. A. L., Peletier R. F., Venhola A., Trager S., Choque Challapa N., 2019, MNRAS, 485, 1036
- Marigo et al. (2008) Marigo P., Girardi L., Bressan A., Groenewegen M. A. T., Silva L., Granato G. L., 2008, A&A, 482, 883
- Martin et al. (2019) Martin G., et al., 2019, MNRAS, 485, 796
- Menon et al. (2015) Menon H., Wesolowski L., Zheng G., Jetley P., Kale L., Quinn T., Governato F., 2015, Comp. Astrophysics and Cosmology, 2, 1
- Mihos et al. (2015) Mihos J. C., et al., 2015, ApJ, 809, L21
- Moster et al. (2013) Moster B. P., Naab T., White S. D. M., 2013, MNRAS, 428, 3121
- Mowla et al. (2017) Mowla L., van Dokkum P., Merritt A., Abraham R., Yagi M., Koda J., 2017, ApJ, 851, 27
- Muñoz et al. (2015) Muñoz R. P., et al., 2015, ApJ, 813, L15
- Munshi et al. (2013) Munshi F., et al., 2013, ApJ, 766, 56
- Nelson et al. (2019) Nelson D., et al., 2019, MNRAS, p. 2010
- Obreschkow & Glazebrook (2014) Obreschkow D., Glazebrook K., 2014, ApJ, 784, 26
- Ogiya (2018) Ogiya G., 2018, MNRAS, 480, L106
- Pillepich et al. (2019) Pillepich A., et al., 2019, arXiv e-prints, p. arXiv:1902.05553
- Planck Collaboration et al. (2016) Planck Collaboration et al., 2016, A&A, 594, A13
- Pontzen & Governato (2012) Pontzen A., Governato F., 2012, MNRAS, 421, 3464
- Pontzen & Governato (2013) Pontzen A., Governato F., 2013, MNRAS, 430, 121
- Pontzen & Tremmel (2018) Pontzen A., Tremmel M., 2018, ApJS, 237, 23
- Pontzen et al. (2008) Pontzen A., et al., 2008, MNRAS, 390, 1349
- Pontzen et al. (2013) Pontzen A., Roškar R., Stinson G., Woods R., 2013, pynbody: N-Body/SPH analysis for python, Astrophysics Source Code Library, record ascl 1305.002 (ascl:1305.002)
- Power et al. (2003) Power C., Navarro J. F., Jenkins A., Frenk C. S., White S. D. M., Springel V., Stadel J., Quinn T., 2003, MNRAS, 338, 14
- Ricarte et al. (2019) Ricarte A., Tremmel M., Natarajan P., Quinn T., 2019, MNRAS, 489, 802
- Ritchie & Thomas (2001) Ritchie B. W., Thomas P. A., 2001, MNRAS, 323, 743
- Roediger et al. (2015) Roediger E., et al., 2015, ApJ, 806, 104
- Roediger et al. (2017) Roediger J. C., et al., 2017, ApJ, 836, 120
- Román & Trujillo (2017a) Román J., Trujillo I., 2017a, MNRAS, 468, 703
- Román & Trujillo (2017b) Román J., Trujillo I., 2017b, MNRAS, 468, 4039
- Rong et al. (2017) Rong Y., Guo Q., Gao L., Liao S., Xie L., Puzia T. H., Sun S., Pan J., 2017, MNRAS, 470, 4231
- Saitoh & Makino (2009) Saitoh T. R., Makino J., 2009, ApJ, 697, L99
- Sandage & Binggeli (1984) Sandage A., Binggeli B., 1984, AJ, 89, 919
- Santos-Santos et al. (2018) Santos-Santos I. M., Di Cintio A., Brook C. B., Macciò A., Dutton A., Domínguez-Tenreiro R., 2018, MNRAS, 473, 4392
- Schaye et al. (2015) Schaye J., et al., 2015, MNRAS, 446, 521
- Schramm & Silverman (2013) Schramm M., Silverman J. D., 2013, ApJ, 767, 13
- Sérsic (1963) Sérsic J. L., 1963, Boletin de la Asociacion Argentina de Astronomia La Plata Argentina, 6, 41
- Sharma et al. (2019) Sharma R., Brooks A., Somerville R. S., Tremmel M., Bellovary J., Wright A., Quinn T., 2019, arXiv e-prints, p. arXiv:1912.06646
- Shen et al. (2010) Shen S., Wadsley J., Stinson G., 2010, MNRAS, 407, 1581
- Shen et al. (2012) Shen S., Madau P., Aguirre A., Guedes J., Mayer L., Wadsley J., 2012, ApJ, 760, 50
- Sokołowska et al. (2016) Sokołowska A., Mayer L., Babul A., Madau P., Shen S., 2016, ApJ, 819, 21
- Sokołowska et al. (2018) Sokołowska A., Babul A., Mayer L., Shen S., Madau P., 2018, ApJ, 867, 73
- Steyrleithner et al. (2020) Steyrleithner P., Hensler G., Boselli A. r., 2020, arXiv e-prints, p. arXiv:2003.09591
- Stinson et al. (2006) Stinson G., Seth A., Katz N., Wadsley J., Governato F., Quinn T., 2006, MNRAS, 373, 1074
- Tadaki et al. (2019) Tadaki K.-i., et al., 2019, PASJ, 71, 40
- Teklu et al. (2015) Teklu A. F., Remus R.-S., Dolag K., Beck A. M., Burkert A., Schmidt A. S., Schulze F., Steinborn L. K., 2015, ApJ, 812, 29
- Tremmel et al. (2015) Tremmel M., Governato F., Volonteri M., Quinn T. R., 2015, MNRAS, 451, 1868
- Tremmel et al. (2017) Tremmel M., Karcher M., Governato F., Volonteri M., Quinn T. R., Pontzen A., Anderson L., Bellovary J., 2017, MNRAS, 470, 1121
- Tremmel et al. (2018a) Tremmel M., Governato F., Volonteri M., Quinn T. R., Pontzen A., 2018a, MNRAS, 475, 4967
- Tremmel et al. (2018b) Tremmel M., Governato F., Volonteri M., Pontzen A., Quinn T. R., 2018b, The Astrophysical Journal Letters, 857, L22
- Tremmel et al. (2019) Tremmel M., et al., 2019, MNRAS, 483, 3336
- Venhola et al. (2017) Venhola A., et al., 2017, A&A, 608, A142
- Venhola et al. (2019a) Venhola A., et al., 2019a, A&A, 625, A143
- Venhola et al. (2019b) Venhola A., et al., 2019b, A&A, 625, A143
- Wadsley et al. (2004) Wadsley J. W., Stadel J., Quinn T., 2004, New Astronomy, 9, 137
- Wadsley et al. (2008) Wadsley J. W., Veeravalli G., Couchman H. M. P., 2008, MNRAS, 387, 427
- Wadsley et al. (2017) Wadsley J. W., Keller B. W., Quinn T. R., 2017, MNRAS, 471, 2357
- Wang et al. (2020) Wang K., Mao Y.-Y., Zentner A. R., Lange J. U., van den Bosch F. C., Wechsler R. H., 2020, arXiv e-prints, p. arXiv:2004.13732
- Wasserman et al. (2019) Wasserman A., et al., 2019, arXiv e-prints, p. arXiv:1905.10373
- Wittmann et al. (2017) Wittmann C., et al., 2017, MNRAS, 470, 1512
- Wright et al. (2020) Wright A. C., Tremmel M., Brooks A. M., Munshi F., Nagai D., Sharma R. S., Quinn T. R., 2020, arXiv e-prints, p. arXiv:2005.07634
- Yozin & Bekki (2015) Yozin C., Bekki K., 2015, MNRAS, 452, 937
- Zinger et al. (2018) Zinger E., Dekel A., Kravtsov A. V., Nagai D., 2018, MNRAS, 475, 3654
- Zolotov et al. (2012) Zolotov A., et al., 2012, ApJ, 761, 71
- van Dokkum et al. (2014) van Dokkum P. G., Abraham R., Merritt A., 2014, ApJ, 782, L24
- van Dokkum et al. (2015) van Dokkum P. G., Abraham R., Merritt A., Zhang J., Geha M., Conroy C., 2015, ApJ, 798, L45
- van Dokkum et al. (2016) van Dokkum P., et al., 2016, ApJ, 828, L6
- van Dokkum et al. (2017) van Dokkum P., et al., 2017, ApJ, 844, L11
- van Dokkum et al. (2018a) van Dokkum P., et al., 2018a, Nature, 555, 629
- van Dokkum et al. (2018b) van Dokkum P., et al., 2018b, ApJ, 856, L30
- van Dokkum et al. (2019a) van Dokkum P., Danieli S., Abraham R., Conroy C., Romanowsky A. J., 2019a, ApJ, 874, L5
- van Dokkum et al. (2019b) van Dokkum P., et al., 2019b, ApJ, 880, 91
- van Zee (2000) van Zee L., 2000, AJ, 119, 2757
- van den Bosch & Ogiya (2018) van den Bosch F. C., Ogiya G., 2018, MNRAS, 475, 4066
- van den Bosch et al. (2018) van den Bosch F. C., Ogiya G., Hahn O., Burkert A., 2018, MNRAS, 474, 3043
- van der Burg et al. (2016) van der Burg R. F. J., Muzzin A., Hoekstra H., 2016, A&A, 590, A20
- van der Burg et al. (2017) van der Burg R. F. J., et al., 2017, A&A, 607, A79