Optical characterization of WISE selected blazar candidates
Abstract
Context. Over the last decade more than five thousand -ray sources were detected by the Large Area Telescope (LAT) on board Fermi Gamma-ray Space Telescope. Given the positional uncertainty of the telescope, nearly of these sources remain without an obvious counterpart in lower energies. This motivated the release of new catalogs of -ray counterpart candidates and several follow up campaigns in the last decade.
Aims. Recently, two new catalogs of blazar candidates were released, they are the improved and expanded version of the WISE Blazar-Like Radio-Loud Sources (WIBRaLS2) catalog and the Kernel Density Estimation selected candidate BL Lacs (KDEBLLACS) catalog, both selecting blazar-like sources based on their infrared colors from the Wide-field Infrared Survey Explorer (WISE). In this work we characterized these two catalogs, clarifying the true nature of their sources based on their optical spectra from SDSS data release 15, thus testing how efficient they are in selecting true blazars.
Methods. We first selected all WIBRaLS2 and KDEBLLACS sources with available optical spectra in the footprint of Sloan Digital Sky Survey data release 15. Then we analyzed these spectra to verify the nature of each selected candidate and see which fraction of the catalogs is composed by spectroscopically confirmed blazars. Finally, we evaluated the impact of selection effects, specially those related to optical colors of WIBRaLS2/KDEBLLACS sources and their optical magnitude distributions.
Results. We found that at least of each catalog is composed by confirmed blazars, with quasars being the major contaminants in the case of WIBRaLS2 () and normal galaxies in the case of KDEBLLACS (). The spectral analysis also allowed us to identify the nature of 11 blazar candidates of uncertain type (BCUs) from the Fermi-LAT 4th Point Source Catalog (4FGL) and to find 25 new BL Lac objects.
Key Words.:
BL Lacertae objects: general – catalogs – galaxies: active – radiation mechanisms: non-thermal1 Introduction
One of the main challenges of modern -ray astronomy in the era of Fermi Large Area Telescope (LAT) is the association of -ray sources with their low-energy counterparts (Massaro et al., 2015b, 2016b). The main problem underlying it is the large positional uncertainty of -ray detected sources, typically in the Fermi-LAT 4th Point Source Catalog111https://fermi.gsfc.nasa.gov/ssc/data/access/lat/8yr_catalog/ (4FGL; Fermi-LAT Collaboration et al., 2019). Association task also affects source classification that covers up to of the 4FGL leaving 1521 unidentified/unassociated -ray sources (UGSs) to date.
UGSs are distributed throughout the whole sky uniformly – although showing some concentration towards the Galactic plane () – indicating that most of them could have extragalactic nature. The -ray sky is mainly populated by non-thermal sources and in particular of 4FGL associated sources are classified as blazars. These belong to one of the rarest class of active galactic nuclei (AGNs), whose emission arises from particles accelerated in a relativistic jet closely aligned with line of sight (Blandford et al., 1978). Thus it is expected that a significant fraction of UGSs is composed of blazars, at least at high Galactic latitudes.
Blazars are divided into BL Lacs (BZBs) and blazars of quasar type, labelled in the Roma-BZCAT as BZQs (Massaro et al., 2015a), and classified based on their optical spectra, where the former have featureless optical spectra, or only absorption lines of galactic origin and weak and narrow (Å; Stickel et al., 1991; Landoni et al., 2014, 2015a, 2015b) emission lines; and the latter have flat radio spectra, with optical spectra showing broad emission lines and a dominant intrinsically blue continuum. Blazars, emitting non-thermal radiation over the whole electromagnetic spectrum, also show large variability at all wavelengths, a flat or inverted radio spectrum, significant polarized emission and in some cases even apparent super-luminal motion (Urry & Padovani, 1995; Abdo et al., 2010).
Blazars occupy a specific region in the mid-infrared (IR) color space defined by the Wide-field Infrared Survey Explorer filters (WISE; Wright et al., 2010). This region is known as the WISE Blazar Strip (Massaro et al., 2011, 2012b; D’Abrusco et al., 2012) when it is described in a two-dimensional space, and locus when it is modeled in the full three-dimensional WISE color space (D’Abrusco et al., 2014). Such distinctive mid-IR colors are due to the non-thermal emission arising from their relativistic jets (Böttcher, 2007). This discovery led to search for blazar-like sources lying within the positional uncertainty ellipses of UGSs that could be their potential counterparts (D’Abrusco et al., 2014; Massaro et al., 2015b).
One of the catalogs that provides the largest number of associated blazar candidates for Fermi catalogs is the WISE Blazar-Like Radio-Loud Sources catalog (WIBRaLS; D’Abrusco et al., 2014, 2019). Selected sources in the WIBRaLS are detected in all four mid-IR WISE bands (nominally at 3.4, 4.6, 12 and 22 m) and show mid-IR colors similar to confirmed Fermi blazars. Sources in WIBRaLS are also required to have a radio-loud counterpart (see more details in Section 2.1). In the latest release of the WIBRaLS catalog (hereinafter WIBRaLS2), an additional list of candidate BZBs has been built based on a kernel density estimation (KDE) technique, namely KDEBLLACS (D’Abrusco et al., 2019). Sources in KDEBLLACS are also radio-loud. Sources in both catalogs are selected with Galactic latitude .
The main goal of the present analysis is to characterize sources listed in both WIBRaLS2 and KDEBLLACS, on the basis of the optical spectra available for those lying in the footprint of the Sloan Digital Sky Survey (SDSS; York et al., 2000) 15th data release (DR15; Aguado et al., 2019). We aim to classify them spectroscopically mainly to determine the source classes that contaminate the WIBRaLS2 selection criteria. SDSS is ideal to achieve our purposes since it is the survey with higher number of spectroscopic objects available in the literature.
The paper is organized as follows: in Section 2 we describe samples used to carry out our analysis, providing basic details of both WIBRaLS2 and KDEBLLACS, selecting those sources in the SDSS footprint. Sections 3 and 4 describe our spectral classification method and results, respectively. Finally, we summarize our results and conclusions in Section 5.
Throughout this work we use h = 0.70, = 0.30, and = 0.70, where the Hubble constant is h km s-1 Mpc-1 (Tegmark et al., 2004). Spectral indices are defined by flux density , indicating a flat spectrum when . The WISE magnitudes are in the Vega system and are not corrected for the Galactic extinction, since, as shown in D’Abrusco et al. (2014), such correction only affects the magnitude at 3.4 m for sources lying close to the Galactic plane and it ranges between 2% and 5% of the magnitude, thus not affecting significantly the results. WISE bands are indicated as W1, W1, W3 and W4, and correspond respectively to the nominal wavelengths at 3.4, 4.6, 12, and 22 m.
2 Sample selection
For this analysis we used observations available in the AllWISE catalog (Cutri et al., 2013, 2014), which contains astrometry and photometry in the IR for 3107 sources in W1, W2, W3 ad W4 bands, it includes data from the cryogenic and post-cryogenic survey phases (Mainzer et al., 2011), increasing to sources detected only on the first three bands W1, W2 and W3.
2.1 WIBRaLS2
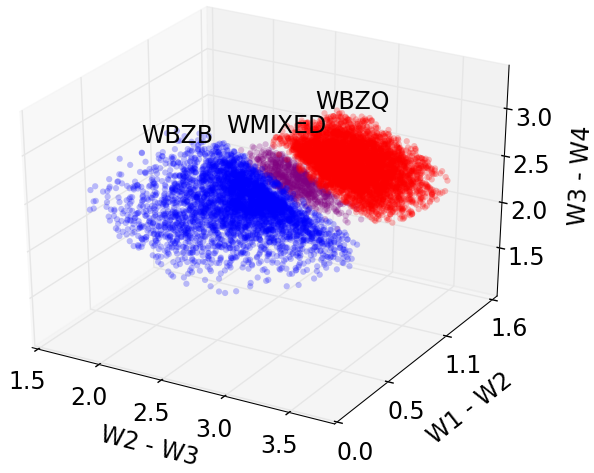
The WIBRaLS2 catalog was conceived to provide a good sample of potential -ray sources based on IR and radio data. It includes mid-IR sources detected in the four WISE filters, with colors similar to those of blazars listed in the Fermi-LAT 4-year Point Source Catalog (3FGL; Acero et al., 2015), spatially cross-matched with a radio counterpart found in one of the three major radio surveys: the National Radio Astronomy Observatories Very Large Array (VLA) Sky Survey (NVSS; Condon et al., 1998), the VLA Faint Images of the Radio Sky at Twenty-cm Survey (FIRST; White et al., 1997; Helfand et al., 2015) and the Sydney University Molonglo Sky Survey Source Catalog (SUMSS; Mauch et al., 2003); and selected to be radio-loud based on their spectral parameter, defined as , with and being the flux densities at and in radio respectively. The total number of blazar candidates in WIBRaLS2 is 9541 and they are classified (see Figure 1) as candidate BZBs, candidate BZQs or MIXEDs (hereinafter WBZBs, WBZQs and WMIXEDs, respectively), the latter defined as those with mid-IR colors which are intermediate between WBZBs and WBZQs (for more details, see D’Abrusco et al., 2019).
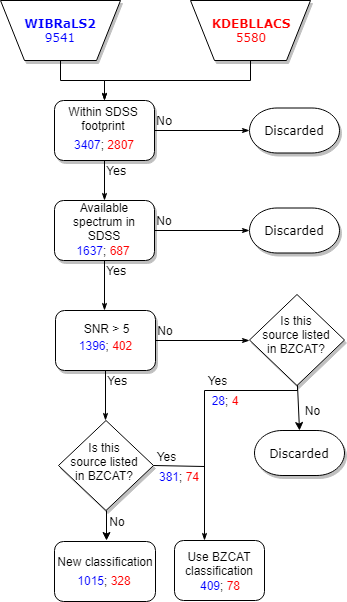
In this paper, we have cross-matched the WIBRaLS2 catalog with SDSS DR15 associating blazar candidates listed therein with their optical counterparts within an angular separation of (Massaro et al., 2014). We found a total number of 3407 unique associations and then used the SDSS Science Archive Server222https://dr15.sdss.org/optical/spectrum/search to select only those sources with an available optical spectrum. We then selected only those sources with a spectral signal to noise ratio (SNR) above 5 and sources with SNR ¡ 5 but listed in Roma-BZCAT. This led us to a final sample of 1424 WIBRaLS2 sources, which corresponds to of the whole WIBRaLS2. A flowchart describing the effects of our selection of the number of candidates in the WIBRaLS2 catalog is displayed in Figure 2.
2.2 KDEBLLACS
The KDEBLLACS catalog was built by first applying a kernel density estimation (KDE) to a two-dimensional distribution of training set sources of BZB type in the WISE W1-W2 W2-W3 color diagram to determine its probability distribution function (PDF). Then sources were selected when located within the 90% isodensity contour of the training set (D’Abrusco et al., 2019) built with the KDE. The color uncertainty ellipses of each source in KDEBLLACS must be fully contained in this 90% contour. Sources in KDEBLLACS are radio-loud according to the parameter, defined as , with and being the flux densities at and in radio respectively (D’Abrusco et al., 2019).
KDEBLLACS lists 5580 candidate BZBs (hereinafter labelled as KBZBs). This number decreases to 2807 sources lying in the SDSS footprint, however, only 402 of them have good (i.e., SNR ¿ 5) optical spectra. Our final sample consists of these 402 sources together with 4 sources listed in Roma-BZCAT which have low significance (SNR ¡ 5) SDSS spectra. This sample corresponds to 7% of the whole KDEBLLACS (see Figure 2 for details).
3 Spectral analysis and classification
To classify sources in WIBRaLS2 and KDEBLLACS according to their optical spectra, we started by cross-matching both samples, previously defined, with Roma-BZCAT (Massaro et al., 2015a), finding a total of 409 counterparts (out of 1424) for WIBRaLS2 and 78 (out of 404) for KDEBLLACS, respectively. These sources were already classified as blazars and we assumed their classification without further check.
We then adopted the following classification scheme, divided into sources listed in Roma-BZCAT and remaining sources:
-
•
Roma-BZCAT
-
–
BZB
-
–
BL Lac - galaxy-dominated (BZG)
-
–
Blazar uncertain type (BZU)
-
–
BZQ
-
–
-
•
Remaining sources
-
–
BZB
-
–
Quasi-stellar object (QSO), or BZQ in some cases
-
–
Low-luminosity active galactic nucleus (LLAGN)
-
–
Star-forming galaxy
-
–
BZG
-
–
Galaxy
-
–
Star
-
–
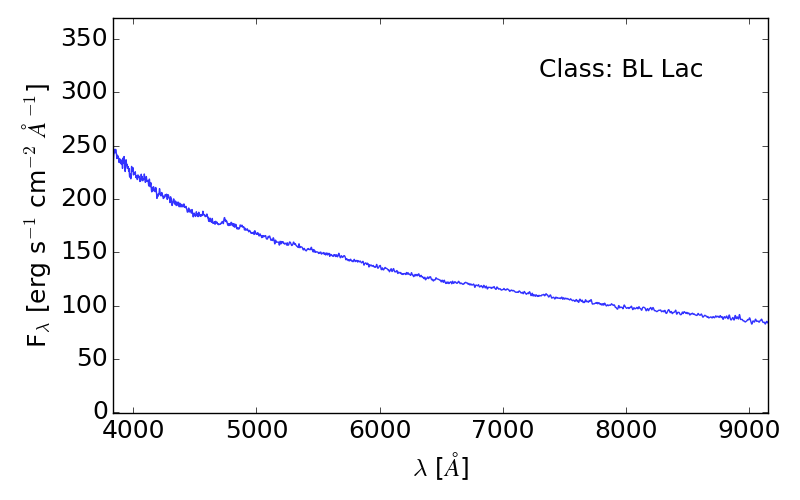
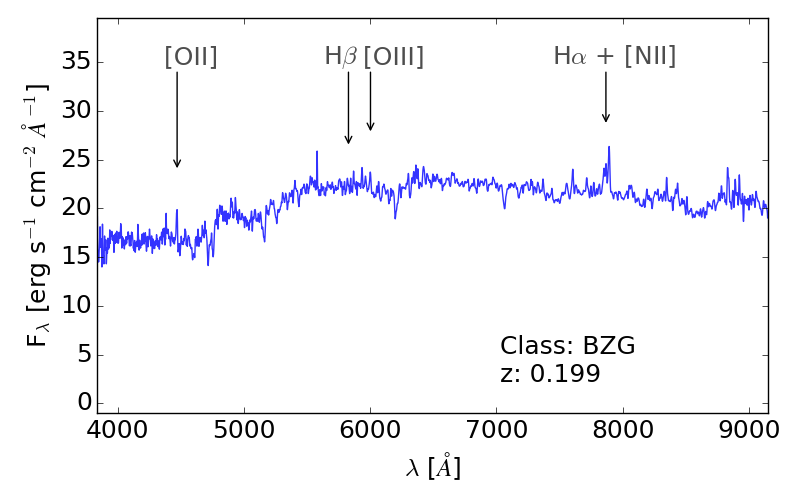
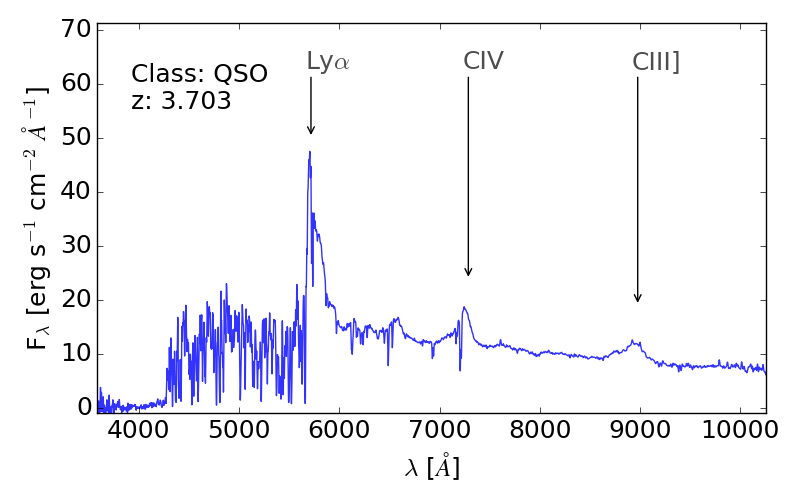
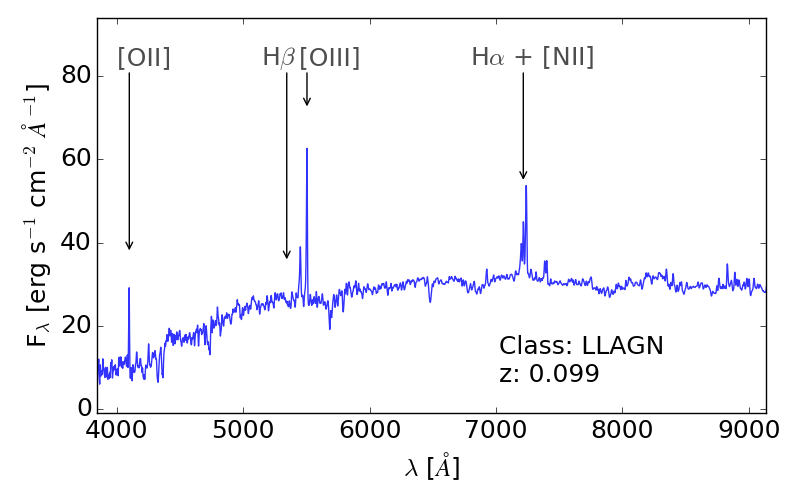
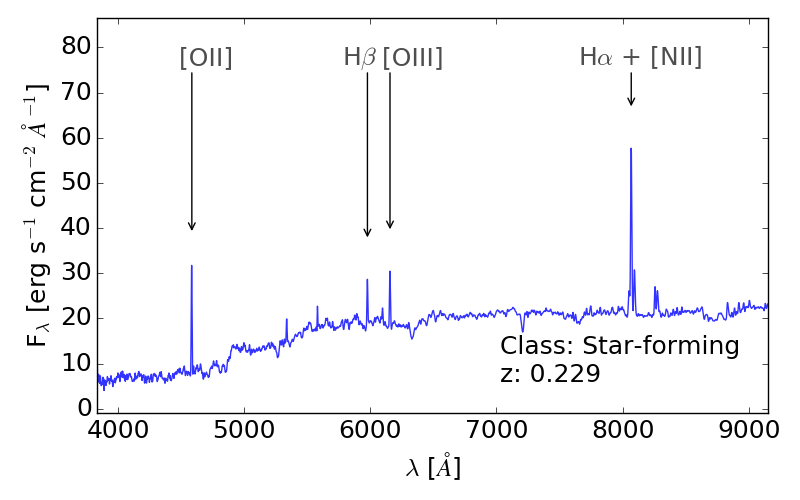
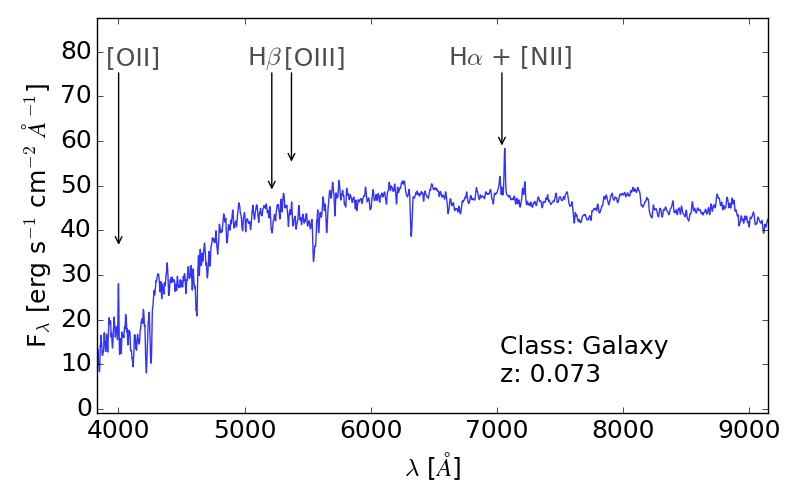
Figure 3 shows the typical smoothed spectra for all classes discussed above. The criteria adopted in the classification of the new analyzed sources is explained below.
Particularly for blazars, we classified sources as BZBs when they showed a featureless optical spectra with a dominant blue continuum, and as QSOs when presenting redshifted broad emission lines again above a dominant blue continuum coupled with a radio luminosity greater than 1038 erg s-1.
On the other hand, LLAGNs and star-forming galaxies were distinguished based on their line ratios [OIII]/Hβ and [NII]/Hα according to the BPT diagram (Baldwin et al., 1981; Kewley et al., 2006). A total of 4 star-forming galaxies were identified in WIBRaLS2 and only 2 in KDEBLLACS.
To distinguish between normal galaxies and BZGs, we measured their relative flux depression bluewards the Ca II break. This parameter was defined as , with and meaning the flux densities measured in ranges of 200 Å at wavelengths just above and below that of the Ca II H&K break (Dressler & Shectman, 1987; Massaro et al., 2012a). As in Stocke et al. (1991), we adopted a threshold value of 0.25 for CB to ensure the presence of a substantial non-thermal continuum (i.e., CB0.25) leading to a BZG classification; otherwise, it was classified as a normal galaxy.
Finally, a total of 3 and 2 stars were found contaminating WIBRaLS2 and KDEBLLACS respectively; four of them typical cold M- or G-type, and one white dwarf.
4 Results
The optical classification previously described enabled us to characterize WIBRaLS2 and KDEBLLACS subsamples. The results are presented here splitted in the following subsections.
4.1 WIBRALS2
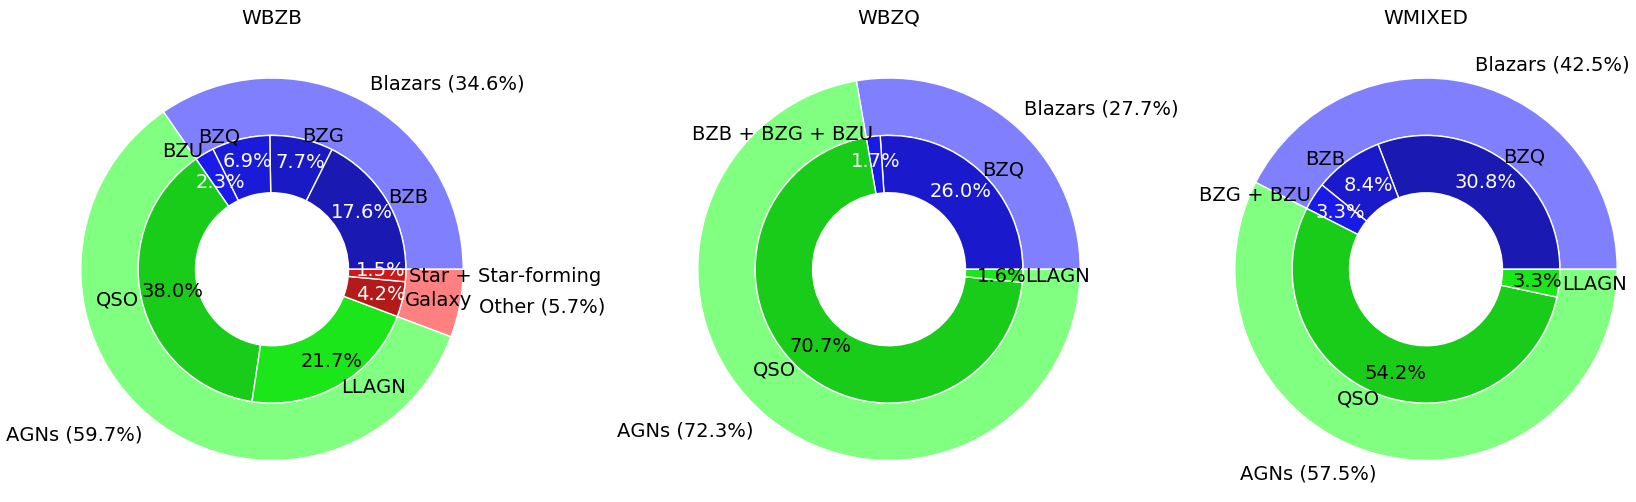
We analyzed a total of 1424 spectra (1396 with SNR ¿ 5 and 28 with SNR ¡ 5 but with a counterpart in Roma-BZCAT) among the 9541 sources available in WIBRaLS2 – but only 3407 in the SDSS footprint. According to their WIBRaLS2 classification, these sources were divided into 471 WBZBs, 833 WBZQs and 120 WMIXEDs. As can be seen in Figure 4, their main contaminant class are QSOs. A significant fraction of these QSOs, however, may have a radio flat spectrum, indicating that they could be indeed blazars of BZQ type. Then, we found that 17.6% of WBZBs show a featureless optical spectrum; 26.1% of WBZQs are confirmed BZQs (i.e., radio flat spectrum) and 30.8% of WMIXEDs sources are also BZQs.
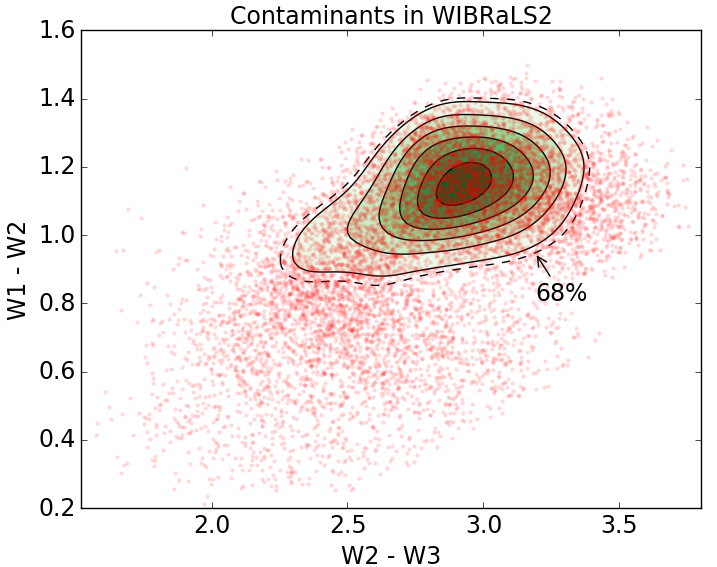
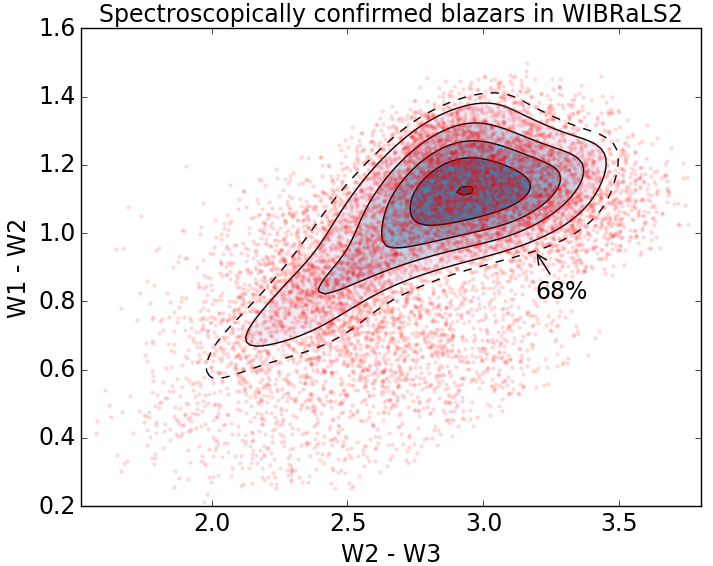
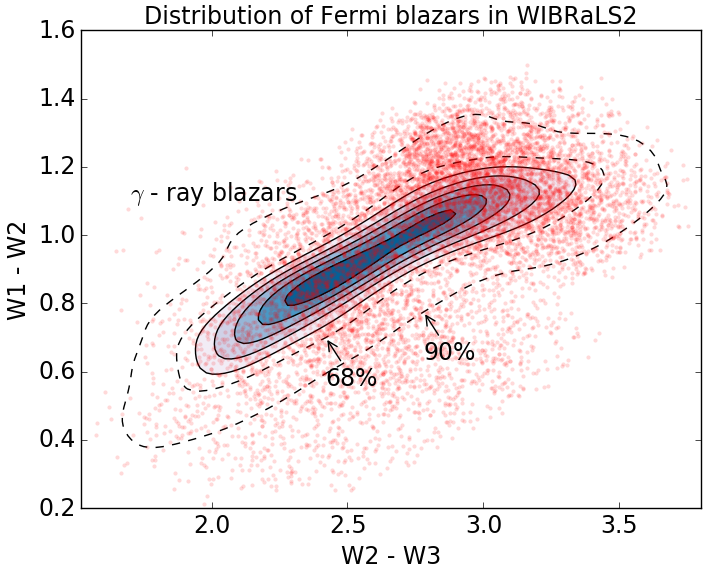
As can be seen in the left and middle panels of Figure 5, the majority of contaminants in WIBRaLS2 are concentrated in the WBZQ and WMIXED regions of the mid-IR color-color diagram. On the other hand, the WBZB sample is cleaner, and its purity can reach in the area bounded by the 68% isodensity contours of 4FGL -ray blazars (Figure 5, right panel).
4.2 KDEBLLACS
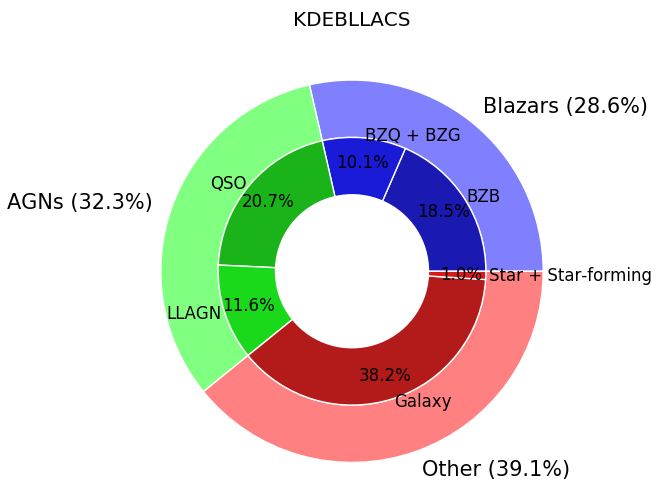
With a total of 406 spectra analyzed, KBZBs in KDEBLLACS were classified as follows: 75 BZBs (60 of them confirmed in Roma-BZCAT), 39 BZGs (17 confirmed in Roma-BZCAT), 155 normal galaxies, 47 LLAGNs (20 LINERs and 27 Seyferts), 84 QSOs, 2 confirmed BZQs (1 of them listed in Roma-BZCAT), 2 stars and 2 star-forming galaxies, all according to the criteria previously described. Figure 6 summarizes these results in a nested pie chart.
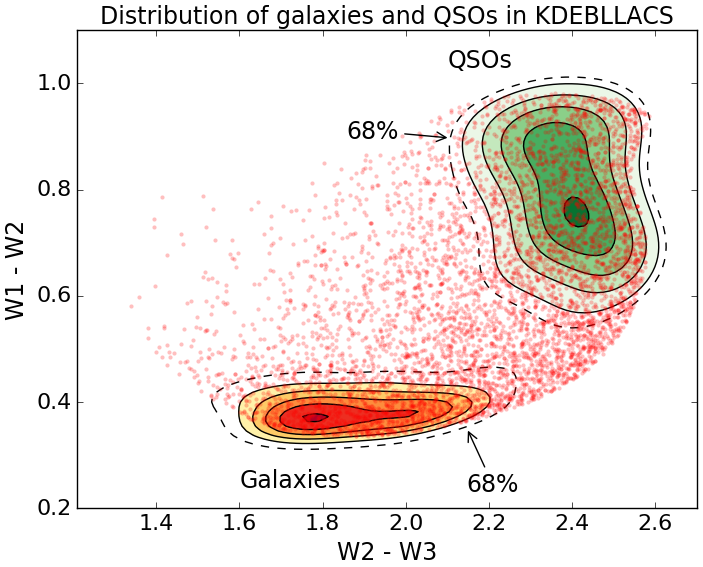
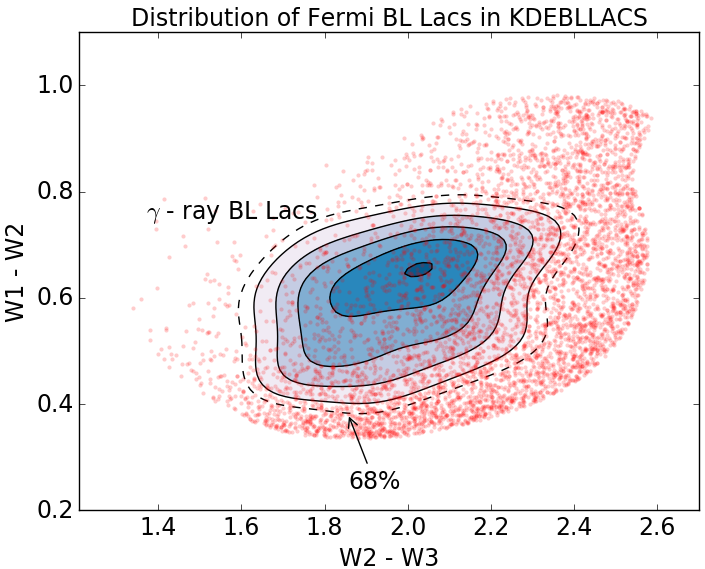
It is worth noting that normal galaxies and QSOs are the major contaminant classes of KDEBLLACS selection criteria. After applying two KDEs to this sample, one using spectroscopically confirmed QSOs and the other using spectroscopically confirmed galaxies as training sets, we observe (as expected) that these contaminants are concentrated towards the edges of the mid-IR color-color diagram (Figure 7, left panel), mainly in the bottom and upper-right corners. Indeed, most of the BZBs classified in 4FGL lie outside of these regions (Figure 7, right panel).
4.3 Selection effects
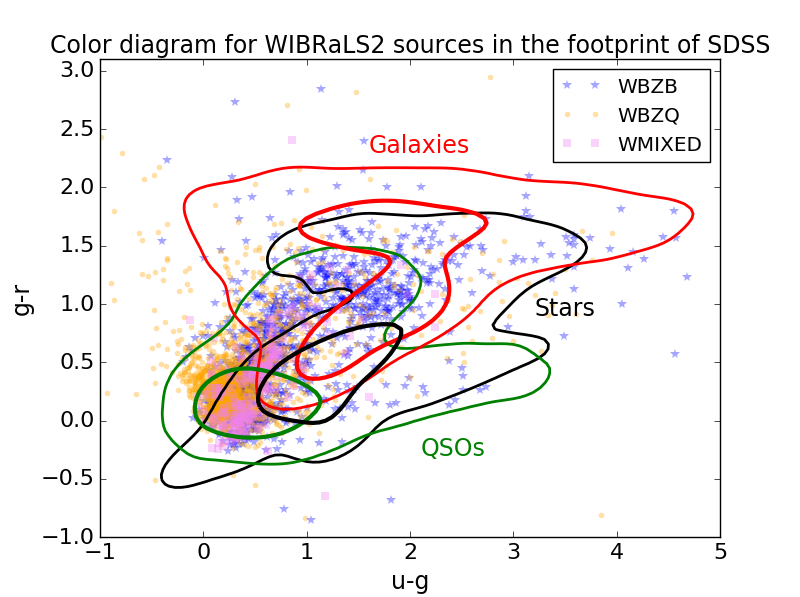

Since of WIBRaLS2 and of KDEBLLACS sources in the footprint of SDSS have no available spectrum, we investigated possible selection effects, starting by comparing the typical optical colors of sources in WIBRaLS2 and KDEBLLACS with the colors of sources spectroscopically observed by SDSS, split by their SDSS spectroscopic classification. The lines in Figure 8 show the 90% and 50% isodensity contours for 10 000 spectroscopically classified Galaxies (red), QSOs (green) and Stars (black), randomly selected from SDSS DR15. Overall, the candidates from WIBRaLS2 and KDEBLLACS catalog occupy very similar region of the - vs - optical diagram (Figure 8). Most of the WIBRaLS2 and KDEBLLACS candidates are located within the 90% isodensity contours defined by spectroscopic SDSS QSOs and Galaxies, which significantly overlap with the 90% contour for stars. In particular, in the case of WIBRaLS2 candidates (top panel), a large fraction (48%) of candidates lie within the 50% contour of sources classified as QSOs, although other sources are scattered in the Galaxies and Stars-dominated areas. WIBRaLS2 candidates classified as WBZQ unsurpisingly peak in the area occupied by spectroscopically confirmed SDSS QSOs, while intermediate (WMIXED) and WBZB sources spread a much larger area consistent with both SDSS spectroscopic Stars and Galaxies. KDEBLLACS candidates are more evenly scattered through the isodensity contours for all three spectroscopic classes, indicating a likely larger contamination from the host galaxies. Similar behaviors are visible in the other SDSS color-color diagrams, not reported in Figure 8. In general, we can rule out the existence of significant selection effects due to the colors of the optical counterparts of our candidates.
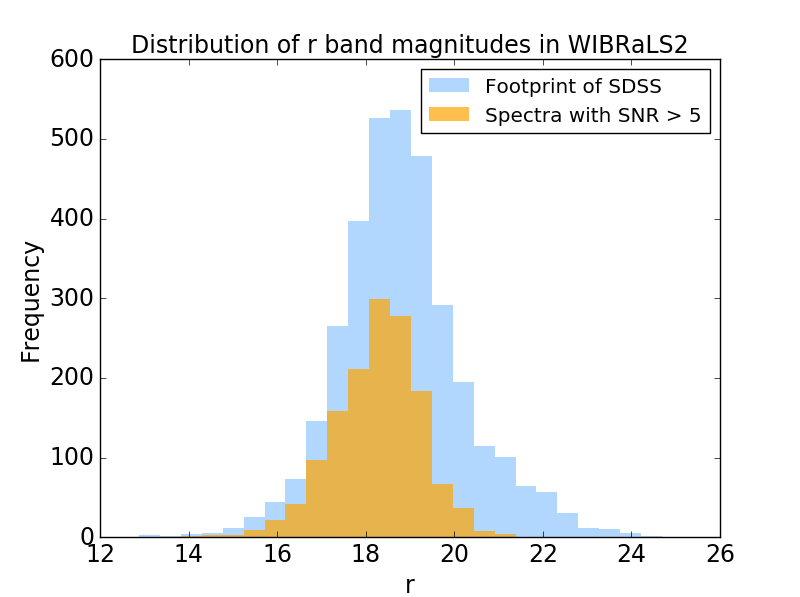
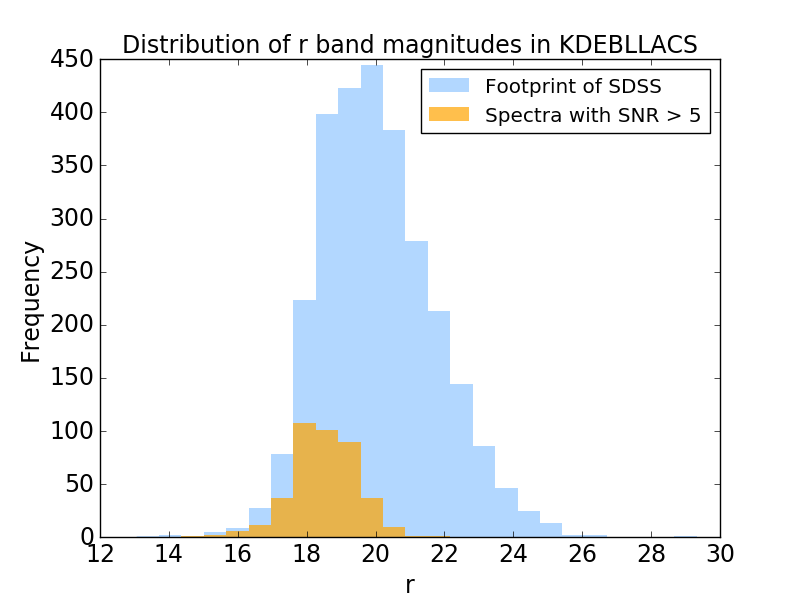
Selection effects caused by the magnitude distribution of our candidates, however, are of major importance. As shown in Figure 9, a large majority of the candidates missing optical spectra, especially for KDEBLLACS catalog, are fainter than the candidates that have been followed-up spectroscopically. In particular, the reason why KDEBLLACS is spectroscopically less complete than WIBRaLS2 is because this catalog has in general fainter sources. This effect is expected as KDEBLLACS candidates appear to be intrinsically fainter than WIBRaLS2 sources in all three WISE bands (W1, W2 and W3) where they are detected, as shown in Figure 7 from D’Abrusco et al. (2019). The magnitude distributions of WIBRaLS2 candidates with and without SDSS spectroscopic counterparts (upper panel in Figure 9), are very similar. This suggests that other selection effects, likely based on the colors, extension and morphology of the sources, increase the number of WIBRaLS2 sources lacking SDSS spectroscopic counterparts333For a general picture of the SDSS selection criteria for spectroscopic observations, see https://www.sdss.org/dr15/algorithms/legacy_target_selection/.
4.4 Blazar candidates of uncertain type
Some sources in the Fermi-LAT catalogs are considered blazar candidates of uncertain type (BCUs) because the adopted association methods select a counterpart that satisfies at least one of the following conditions (Ackermann et al., 2015; Fermi-LAT Collaboration et al., 2019): i) An object classified as blazar of uncertain or transitional type in Roma-BZCAT. ii) A source with multiwavelength data indicating a typical two-humped blazar-like spectral energy distribution (SED) and/or a flat radio spectrum. BCUs are divided into three sub-types (Ackermann et al., 2015):
-
•
BCU I: the counterpart has a published optical spectrum which is not sensitive enough for classifying it as BZQ or BZB.
-
•
BCU II: there is no available optical spectrum but an evaluation of the SED synchrotron peak position is possible.
-
•
BCU III: the counterpart shows typical blazar broadband emission and a flat radio spectrum, but lacks a optical spectrum and reliable measurement of the synchrotron peak position.
In 4FGL, 1155 sources are considered as BCUs. Our analysis based on the optical spectra available in SDSS DR15 (Section 3) allowed us to give a conclusive classification for 11 of them, as shown in Table 1.
The 4FGL catalog associated the source 4FGL J0038.7-0204 with the broad line radio galaxy (RDG) 3C 17 at redshift 0.22 as previously determined by Schmidt (1965) in agreement with the SDSS spectrum we analyzed. The kiloparsec-scale radio morphology of 3C 17 is dominated by a single-sided, curved jet (Morganti et al., 1993) also shining in the X-rays (Massaro et al., 2009, 2010). Recent optical spectroscopic observations also revealed that 3C 17 is the brightest cluster galaxy in its large scale environment (Madrid et al., 2018).
| WISE name | 4FGL name | Class | z |
| J003719.15+261312.6 | J0037.9+2612 | BZG | 0.1477 |
| J003820.53-020740.5 | J0038.7-0204 | RDG | 0.2204 |
| J013859.14+260015.7 | J0139.0+2601 | BZB | – |
| J020239.94-030207.9 | J0202.6-0258 | BZQ | 1.3444 |
| J084734.29+460928.0 | J0846.9+4608 | BZQ | 1.2165 |
| J094452.09+520233.4 | J0945.2+5200 | BZQ | 0.5630 |
| J095608.57+393515.8 | J0956.0+3936 | BZQ | 1.1730 |
| J130407.31+370908.1 | J1304.0+3704 | BZB | – |
| J134243.61+050432.1 | J1342.7+0505 | BZG | 0.1365 |
| J123124.08+371102.2 | J1230.9+3711 | BZG | 0.2180 |
| J154150.09+141437.6 | J1541.7+1413 | BZG | 0.2230 |
4.5 New BZBs
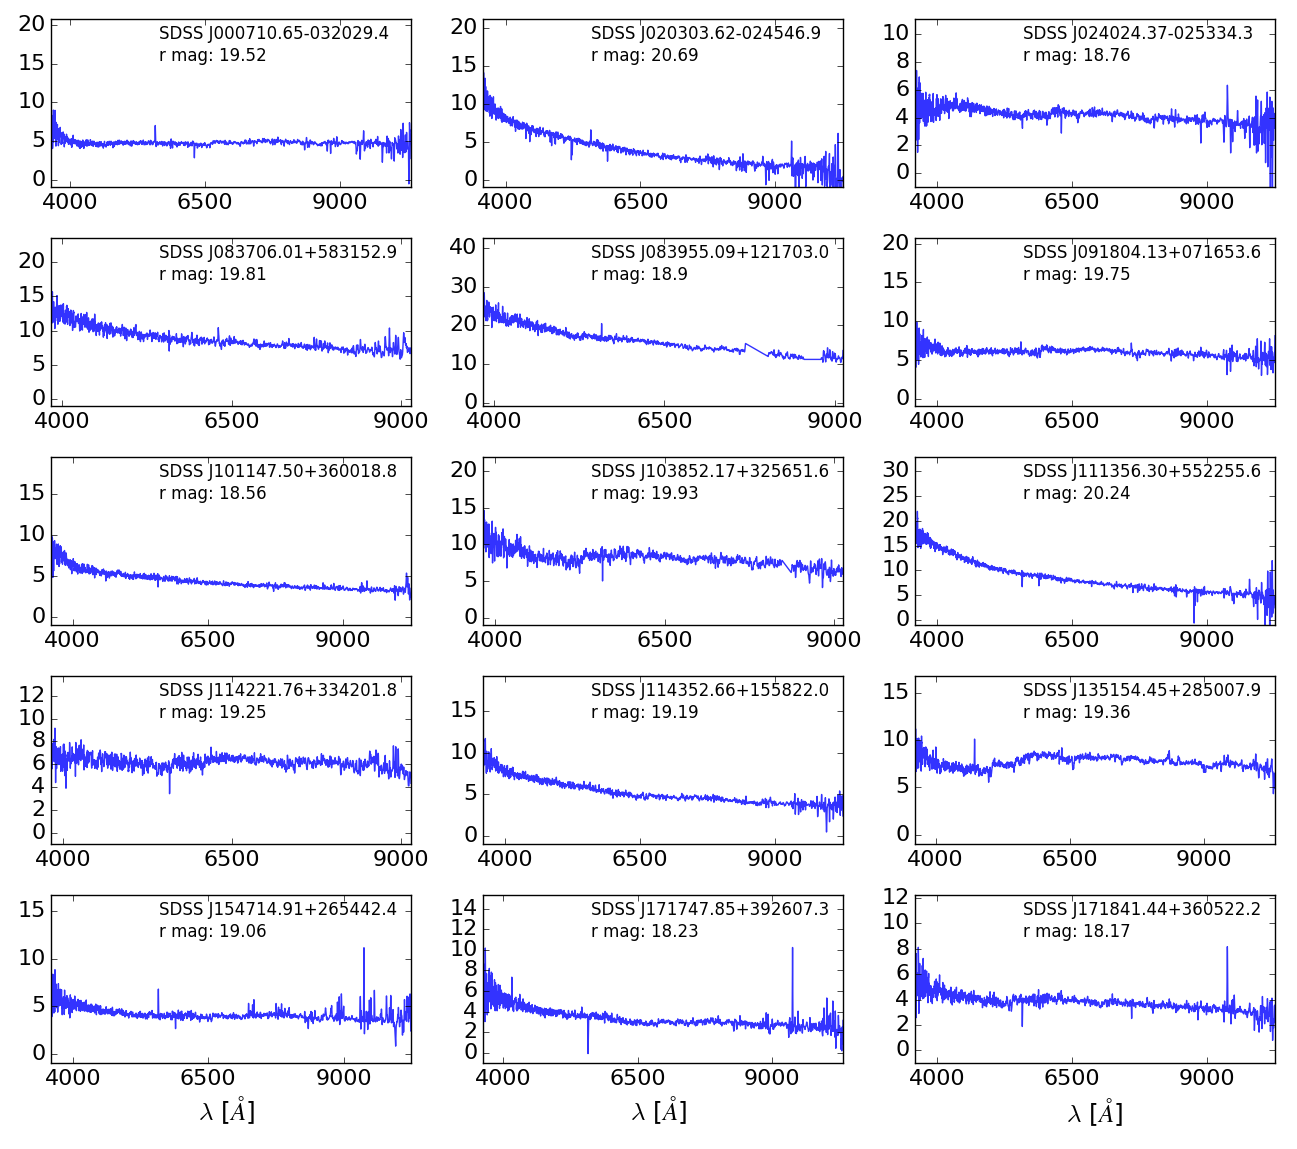
During the spectroscopic classification (Section 3), we found a total of 25 (10 in WIBRaLS2 and 15 in KDEBLLACS) sources with featureless optical spectra and a relatively strong blue continuum – typical characteristics of BZB non-thermal emission – which are not available in Roma-BZCAT. Their smoothed spectra, names/positions and r band magnitudes can be found in the Appendix A.
To check these new BZBs, we considered the color index of the SDSS photometric system (AB magnitudes), which is an efficient discriminator between BZBs and nuclei with weak or even absent activity (Massaro et al., 2012a). When computing these indexes, we considered the extinction-corrected SDSS model magnitudes accordingly to the following formula:
| (1) |
where is the extinction in the r band, given in the SDSS database. Typically, BZBs present a color index (Massaro et al., 2012a), however, this criterium is not suited for sources at high redshifts (z ¿ 0.5). Table 2 summarizes our findings.
| WISE name | SDSS name | |
|---|---|---|
| J013859.14+260015.7 | J013859.14+260015.7 | 1.09 |
| J085446.24-003348.1 | J085446.22-003349.5 | 0.82 |
| J093522.08+502932.2 | J093522.08+502932.2 | 0.88 |
| J115406.13+185723.6 | J115406.11+185723.6 | 1.16 |
| J130407.31+370908.1 | J130407.32+370908.1 | 1.11 |
| J144906.05+071701.2 | J144906.04+071701.3 | 0.86 |
| J165558.59+391218.1 | J165558.61+391218.2 | 0.91 |
| J215601.64+181837.1 | J215601.64+181837.0 | 0.45 |
| J220812.70+035304.5 | J220812.70+035304.6 | 0.85 |
| J235915.62+221450.0 | J235915.62+221450.1 | 1.38 |
| J000710.65-032029.4 | J000710.65-032029.4 | 0.74 |
| J020303.61-024547.3 | J020303.62-024546.9 | 0.82 |
| J024024.36-025334.3 | J024024.37-025334.3 | 0.70 |
| J083706.00+583152.9 | J083706.01+583152.9 | 0.60 |
| J083955.10+121702.9 | J083955.09+121703.0 | 0.71 |
| J091804.13+071653.6 | J091804.13+071653.6 | 1.22 |
| J101147.54+360018.7 | J101147.50+360018.8 | 0.68 |
| J103852.20+325651.7 | J103852.17+325651.6 | 1.22 |
| J111356.24+552255.3 | J111356.30+552255.6 | 0.60 |
| J114221.77+334201.8 | J114221.76+334201.8 | 0.85 |
| J114352.67+155821.9 | J114352.66+155822.0 | 0.51 |
| J135154.45+285008.0 | J135154.45+285007.9 | 1.26 |
| J154714.91+265442.2 | J154714.91+265442.4 | 0.77 |
| J171747.84+392607.3 | J171747.85+392607.3 | 0.99 |
| J171841.42+360522.6 | J171841.44+360522.2 | 1.32 |
5 Summary and conclusions
In this work we characterized the two newly released catalogs of blazar candidates WIBRaLS2 and KDEBLLACS based on 1830 optical spectra – 1798 spectra with SNR ¿ 5 and 32 with SNR ¡ 5 but with a counterpart in Roma-BZCAT – available in SDSS DR15 data. Both catalogs indeed presented a high number of spectroscopic confirmed blazars, although the contamination level of WIBRaLS2 was , mainly due to QSOs, and the contamination of KDEBLLACS was , mainly due to QSOs and normal galaxies. We stress that these estimates of the contamination represent upper limits, due to the selection effects affecting the SDSS spectroscopic sample used in this paper, as described in Section 4.3. Main results can be summarized as follows:
-
•
Including the objects in Roma-BZCAT, 34.6%, 27.7% and 42.5% of the sources respectively in WBZB, WBZQ and WMIXED are blazars, which gives an overall weighted lower limit to the efficiency of WIBRaLS2 blazar selection of , with the major contaminants being, as expected, QSOs.
-
•
The lower limits to the efficiency of KDEBLLACS in identifying blazars is , and its contaminants – mainly galaxies and QSOs – are concentrated on the edges of the mid-IR color-color diagram (Figure 7).
-
•
The spectral analysis carried on in Section 3 led us to the discovery of 25 new BZBs not available anywhere else in literature and to the classification of 11 BCUs listed in 4FGL.
This work contributes to a better understanding of the -ray sky in the Fermi-LAT era. In particular, the community will benefit from the characterization of WIBRaLS2 and KDEBLLACS in population studies of blazars and in subsequent programs of spectroscopic follow-up needed to confirm the nature of the UGSs.
Acknowledgements.
We thank the anonymous referee for constructive comments which helped to improve the manuscript. The accomplishment of this project was only possible due to the ongoing support from the São Paulo Research Foundation (FAPESP), grants 2016/25484-9, 2018/24801-6 and 2017/01461-2. PH acknowledges support from the CONACyT program for Ph.D. studies. FR acknowledges support from FONDECYT Postdoctorado 3180506 and CONICYT Chile grant Basal-CATA PFB-06/2007. R.D’A. is supported by NASA contract NAS8-03060 (Chandra X-ray Center). This work is supported by the “Departments of Excellence 2018 - 2022” Grant awarded by the Italian Ministry of Education, University and Research (MIUR) (L. 232/2016). This research has made use of resources provided by the Compagnia di San Paolo for the grant awarded on the BLENV project (S1618_L1_MASF_01) and by the Ministry of Education, Universities and Research for the grant MASF_FFABR_17_01. F.M. acknowledges financial contribution from the agreement ASI-INAF n.2017-14-H.0. A.P. acknowledges financial support from the Consorzio Interuniversitario per la fisica Spaziale (CIFS) under the agreement related to the grant MASF_CONTR_FIN_18_02. TOPCAT8 (Taylor, 2005) was extensively used in this work for the preparation and manipulation of the tabular data. This publication makes use of data products from the Wide-field Infrared Survey Explorer, which is a joint project of the University of California, Los Angeles, and the Jet Propulsion Laboratory/California Institute of Technology, funded by the National Aeronautics and Space Administration. Funding for the Sloan Digital Sky Survey IV has been provided by the Alfred P. Sloan Foundation, the U.S. Department of Energy Office of Science, and the Participating Institutions. SDSS-IV acknowledges support and resources from the Center for High-Performance Computing at the University of Utah. The SDSS web site is www.sdss.org. SDSS-IV is managed by the Astrophysical Research Consortium for the Participating Institutions of the SDSS Collaboration including the Brazilian Participation Group, the Carnegie Institution for Science, Carnegie Mellon University, the Chilean Participation Group, the French Participation Group, Harvard-Smithsonian Center for Astrophysics, Instituto de Astrofísica de Canarias, The Johns Hopkins University, Kavli Institute for the Physics and Mathematics of the Universe (IPMU) / University of Tokyo, the Korean Participation Group, Lawrence Berkeley National Laboratory, Leibniz Institut für Astrophysik Potsdam (AIP), Max-Planck-Institut für Astronomie (MPIA Heidelberg), Max-Planck-Institut für Astrophysik (MPA Garching), Max-Planck-Institut für Extraterrestrische Physik (MPE), National Astronomical Observatories of China, New Mexico State University, New York University, University of Notre Dame, Observatário Nacional / MCTI, The Ohio State University, Pennsylvania State University, Shanghai Astronomical Observatory, United Kingdom Participation Group, Universidad Nacional Autónoma de México, University of Arizona, University of Colorado Boulder, University of Oxford, University of Portsmouth, University of Utah, University of Virginia, University of Washington, University of Wisconsin, Vanderbilt University, and Yale University. The Fermi LAT Collaboration acknowledges generous ongoing support from a number of agencies and institutes that have supported both the development and the operation of the LAT as well as scientific data analysis. These include the National Aeronautics and Space Administration and the Department of Energy in the United States, the Commissariat à l’Energie Atomique and the Centre National de la Recherche Scientifique / Institut National de Physique Nucléaire et de Physique des Particules in France, the Agenzia Spaziale Italiana and the Istituto Nazionale di Fisica Nucleare in Italy, the Ministry of Education, Culture, Sports, Science and Technology (MEXT), High Energy Accelerator Research Organization (KEK) and Japan Aerospace Exploration Agency (JAXA) in Japan, and the K. A. Wallenberg Foundation, the Swedish Research Council and the Swedish National Space Board in Sweden. Additional support for science analysis during the operations phase is gratefully acknowledged from the Istituto Nazionale di Astrofisica in Italy and the Centre National d’Études Spatiales in France. This work performed in part under DOE Contract DE-AC02-76SF00515. This work is part of a project that has received funding from the European Union’s Horizon 2020 Research and Innovation Programme under the Marie Skłodowska-Curie grant agreement NO 664931.References
- Abdo et al. (2010) Abdo, A., Ackermann, M., Agudo, I., et al. 2010, The Astrophysical Journal, 716, 30
- Acero et al. (2015) Acero, F., Ackermann, M., Ajello, M., et al. 2015, The Astrophysical Journal Supplement Series, 218, 23
- Ackermann et al. (2015) Ackermann, M., Ajello, M., Atwood, W., et al. 2015, The Astrophysical Journal, 810, 14
- Aguado et al. (2019) Aguado, D., Ahumada, R., Almeida, A., et al. 2019, The Astrophysical Journal Supplement Series, 240, 23
- Baldwin et al. (1981) Baldwin, J. A., Phillips, M. M., & Terlevich, R. 1981, Publications of the Astronomical Society of the Pacific, 93, 5
- Blandford et al. (1978) Blandford, R., Rees, M., & Wolfe, A. 1978, AM Wolfe, Ed, 328
- Böttcher (2007) Böttcher, M. 2007, in The Multi-Messenger Approach to High-Energy Gamma-Ray Sources (Springer), 95–104
- Condon et al. (1998) Condon, J. J., Cotton, W., Greisen, E., et al. 1998, The Astronomical Journal, 115, 1693
- Crespo et al. (2016a) Crespo, N. Á., Masetti, N., Ricci, F., et al. 2016a, The Astronomical Journal, 151, 32
- Crespo et al. (2016b) Crespo, N. Á., Massaro, F., Milisavljevic, D., et al. 2016b, The Astronomical Journal, 151, 95
- Cutri et al. (2013) Cutri, R., Wright, E., Conrow, T., et al. 2013, Explanatory Supplement to the AllWISE Data Release Products, by RM Cutri et al.
- Cutri et al. (2014) Cutri, R. e. et al. 2014, VizieR Online Data Catalog, 2328
- D’Abrusco et al. (2019) D’Abrusco, R., Crespo, N. Á., Massaro, F., et al. 2019, The Astrophysical Journal Supplement Series, 242, 4
- D’Abrusco et al. (2012) D’Abrusco, R., Massaro, F., Ajello, M., et al. 2012, The Astrophysical Journal, 748, 68
- D’Abrusco et al. (2014) D’Abrusco, R., Massaro, F., Paggi, A., et al. 2014, The Astrophysical Journal Supplement Series, 215, 14
- Dressler & Shectman (1987) Dressler, A. & Shectman, S. A. 1987, The Astronomical Journal, 94, 899
- Fermi-LAT Collaboration et al. (2019) Fermi-LAT Collaboration, T. et al. 2019, arXiv preprint arXiv:1902.10045
- Helfand et al. (2015) Helfand, D. J., White, R. L., & Becker, R. H. 2015, The Astrophysical Journal, 801, 26
- Kewley et al. (2006) Kewley, L. J., Groves, B., Kauffmann, G., & Heckman, T. 2006, Monthly Notices of the Royal Astronomical Society, 372, 961
- Landoni et al. (2014) Landoni, M., Falomo, R., Treves, A., & Sbarufatti, B. 2014, Astronomy & Astrophysics, 570, A126
- Landoni et al. (2015a) Landoni, M., Falomo, R., Treves, A., Scarpa, R., & Payá, D. R. 2015a, The Astronomical Journal, 150, 181
- Landoni et al. (2015b) Landoni, M., Massaro, F., Paggi, A., et al. 2015b, The Astronomical Journal, 149, 163
- Madrid et al. (2018) Madrid, J. P., Donzelli, C. J., Rodríguez-Ardila, A., et al. 2018, The Astrophysical Journal Supplement Series, 238, 31
- Mainzer et al. (2011) Mainzer, A., Grav, T., Bauer, J., et al. 2011, The Astrophysical Journal, 743, 156
- Marchesini et al. (2019) Marchesini, E., Peña-Herazo, H., Crespo, N. Á., et al. 2019, Astrophysics and Space Science, 364, 5
- Massaro et al. (2015a) Massaro, E., Maselli, A., Leto, C., et al. 2015a, Astrophysics and Space Science, 357, 75
- Massaro et al. (2012a) Massaro, E., Nesci, R., & Piranomonte, S. 2012a, Monthly Notices of the Royal Astronomical Society, 422, 2322
- Massaro et al. (2016a) Massaro, F., Crespo, N. Á., D’Abrusco, R., et al. 2016a, Astrophysics and Space Science, 361, 337
- Massaro et al. (2011) Massaro, F., D’Abrusco, R., Ajello, M., Grindlay, J., & Smith, H. A. 2011, The Astrophysical Journal Letters, 740, L48
- Massaro et al. (2012b) Massaro, F., D’Abrusco, R., Tosti, G., et al. 2012b, The Astrophysical Journal, 750, 138
- Massaro et al. (2015b) Massaro, F., D’Abrusco, R., Landoni, M., et al. 2015b, The Astrophysical Journal Supplement Series, 217, 2
- Massaro et al. (2009) Massaro, F., Harris, D., Chiaberge, M., et al. 2009, The Astrophysical Journal, 696, 980
- Massaro et al. (2010) Massaro, F., Harris, D., Tremblay, G., et al. 2010, The Astrophysical Journal, 714, 589
- Massaro et al. (2014) Massaro, F., Masetti, N., D’Abrusco, R., Paggi, A., & Funk, S. 2014, The Astronomical Journal, 148, 66
- Massaro et al. (2016b) Massaro, F., Thompson, D. J., & Ferrara, E. C. 2016b, The Astronomy and Astrophysics Review, 24, 2
- Mauch et al. (2003) Mauch, T., Murphy, T., Buttery, H., et al. 2003, Monthly Notices of the Royal Astronomical Society, 342, 1117
- Morganti et al. (1993) Morganti, R., Killeen, N., & Tadhunter, C. 1993, Monthly Notices of the Royal Astronomical Society, 263, 1023
- Paggi et al. (2014) Paggi, A., Milisavljevic, D., Masetti, N., et al. 2014, The Astronomical Journal, 147, 112
- Peña-Herazo et al. (2019) Peña-Herazo, H., Massaro, F., Chavushyan, V., et al. 2019, Astrophysics and Space Science, 364, 85
- Peña-Herazo et al. (2017) Peña-Herazo, H. A., Marchesini, E. J., Crespo, N. Á., et al. 2017, Astrophysics and Space Science, 362, 228
- Ricci et al. (2015) Ricci, F., Massaro, F., Landoni, M., et al. 2015, The Astronomical Journal, 149, 160
- Schmidt (1965) Schmidt, M. 1965, The Astrophysical Journal, 141, 1
- Stickel et al. (1991) Stickel, M., Padovani, P., Urry, C., Fried, J., & Kühr, H. 1991, The Astrophysical Journal, 374, 431
- Stocke et al. (1991) Stocke, J. T., Morris, S. L., Gioia, I., et al. 1991, The Astrophysical Journal Supplement Series, 76, 813
- Taylor (2005) Taylor, M. B. 2005, in Astronomical Data Analysis Software and Systems XIV, Vol. 347, 29
- Tegmark et al. (2004) Tegmark, M., Strauss, M. A., Blanton, M. R., et al. 2004, Physical Review D, 69, 103501
- Urry & Padovani (1995) Urry, C. M. & Padovani, P. 1995, Publications of the Astronomical Society of the Pacific, 107, 803
- White et al. (1997) White, R. L., Becker, R. H., Helfand, D. J., & Gregg, M. D. 1997, The Astrophysical Journal, 475, 479
- Wright et al. (2010) Wright, E. L., Eisenhardt, P. R., Mainzer, A. K., et al. 2010, The Astronomical Journal, 140, 1868
- York et al. (2000) York, D. G., Adelman, J., Anderson Jr, J. E., et al. 2000, The Astronomical Journal, 120, 1579
Appendix A New BZB candidates
During the spectral classification process described in Section 3, we found 25 new BZBs not available in Roma-BZCAT or during our follow up spectroscopic campaign (see e.g. Paggi et al. 2014; Landoni et al. 2015b; Ricci et al. 2015; Crespo et al. 2016a, b; Massaro et al. 2016a; Peña-Herazo et al. 2017; Marchesini et al. 2019; Peña-Herazo et al. 2019). Their smoothed optical SDSS DR15 spectra (SNR ¿ 5) are available in Figures 10 and 11 as well as their r band magnitudes.