AGN and starburst coexistence in the short GRB100628A host galaxy.
Abstract
We have modelled the line ratios and the continuum spectral energy distribution (SED) of the short gamma-ray burst GRB100628A host galaxy complex. The results suggest that an active galactic nucleus (AGN) and a star-burst (SB) coexist in Nicuesa Guelbenzu et al.’s ’galaxy C’. The AGN spectrum is explained by a relatively strong flux. Two of the observed regions (blobs) are located in the ISM, outside the AGN photoionization cones. The strongest H line flux calculated by a SB dominated model was found in the tidal tail of galaxy C, while the strongest H line flux calculated by an AGN dominated model was found in the galaxy C bulk. O/H element abundances are near solar everywhere, while N/H spans a factor of 10. The radio data have different origins, thermal bremsstrahlung and reprocessed radiation by dust. The infrared-optical photometric data measured from Nicuesa Guelbenzu et al.’s ’galaxy D’, located outside the X-ray telescope (XRT) error circle, are reproduced by a black-body flux at 3000 K. This flux may represent the radiation of the underlying old star population observed throughout the SED in the infrared. AGNs in other SGRB hosts are investigated.
keywords:
radiation mechanisms: general — shock waves — ISM: abundances — galaxies: GRB — galaxies: high redshift1 Introduction
The observations show that short duration GRB (SGRB) last less than 2s, while long GRB (LGRB) have longer periods (Kouvelioutou et al 1993). New evidence in support of the compact binary merger hypothesis was provided in particular by the observation of a kilonova/macronova accompanying SGRB130603B, and subsequently the observed gamma-ray flash accompanying GW170817 (e.g. Levan et al 2017, Villar et al 2017). At present, some other characteristics of SGRB are not definitive. For instance, short GRB host galaxy types - on the basis of the finding of an elliptical host galaxy (Berger et al. 2005)- indicate that some SGRBs arise from an old stellar population (Bloom et al. 2005, Gehrels et al. 2005) consistent with the hypothesis that compact object binaries are their progenitors. Fong & Berger (2013) by HST observations and a detailed analysis of 22 short GRB host galaxies combined with the results from Fong et al. (2010) concluded that 1/4 of SGRB host galaxies are elliptical with median effective sizes of 3.6 kpc and that 30 - 45 percent are located on the faintest optical regions of their host galaxies, while 55 percent occur in the faintest UV regions. Fong & Berger (2010) claim that short GRB do not occur in regions of star formation or stellar mass but the SGRB progenitor systems should ”migrate from their birth site to the eventual explosion sites, implying kicks in compact binary systems (NS (neutron star)-NS, NS-BH (black hole)) with velocities of 20-140 ”. ”Kicks” were invoked already in the early ’70ies to explain supernova (SN) remnants hosting an associated pulsar displaced from the centre or even missing (e.g. Vela SNR, van den Bergh et al 1973). Progenitor migration throughout the SGRB system host galaxies led Nicuesa Guelbenzu et al (2015) to search for the SGRB100628A host within a mixed complex of galaxies spiral and elliptical at different redshifts, stars, AGN, starbursts , etc. which are all close to the GRB location based on its X-ray detection.
SGRB host galaxies were investigated by different methods (see, e.g. Berger 2014), in particular by photometry in the infrared (IR) - radio range. When spectroscopic data in the optical-near IR range were available, the modelling of the line ratios yielded valuable information about the progenitors, in particular by the host metallicity trend throughout the redshift (e.g. de Ugarte Postigo et al 2014, Cucchiara et al 2013, Soderberg et al 2006, Contini 2016a, 2018a and references therein). Moreover, when the observations covered different positions within a single host galaxy, the results of modelling led to more knowledge, in particular, regarding the photoionizing source of the gas and the hydrodynamical field. In previous papers we have modelled in detail the line and continuum spectra of GRB host galaxies and compared the results with those of supernovae (SN), active galactic nuclei (AGN), starburst (SB), etc at different redshifts (Contini 2018b and references therein) in order to obtain the characteristic host features, such as the gas physical conditions and the O/H and N/H relative abundances. For instance, the results clearly indicated that N/O abundance ratios for LGRB decreases with the redshift decreasing trend. However, the data in particular at z1 for SGRB were too few to allow any conclusion. For NGC4993, the host galaxy of the GW170817 SGRB at z=0.009873, observed by LIGO/Virgo system through gravitational waves, the location within the AGN-LINER domain in the N/O distribution diagram was clearly found (Contini, 2018a). The observations of SGRB at present do not supply enough data in order to decide for sure why and when an AGN may appear throughout the hosts.
In this paper we would like to investigate the SGRB100628A host galaxy by the detailed modelling of the spectra presented by Nicuesa Guelbenzu et al (2015, hereafter NG15) and, eventually, of other SGRB hosts on the basis of spectroscopic and photometric data. It is generally believed that a star burst (SB) is the photoionizing source of the SGRB host gas, therefore the spectra observed from the Berger (2009) SGRB host galaxy sample, from the different positions in the SGRB100206A (Perley et al. 2012) host, from the various locations in the SGRB130603B host (de Ugarte Postigo et al. 2014) and from the SGRB051221a host (Soderberg et al 2006) were analysed by a SB dominated model. Shocks were also accounted for (Contini 2018a) considering that SGRB galaxies derive from merging. In Sect. 2 we explain calculations and modelling of the spectra. In Sect. 3 we compare the calculated line ratios to those observed by NG15 from galaxy C and the calculated continuum SED to the data observed from the SGRB100628A complex. The SGRB150101B host and NGC4993 SEDs are discussed. We will show that the interpretation of the spectra may suggest the presence of an AGN in the SGRB100628A host galaxy. Therefore, in this paper we present new results for the SGRB hosts. In particular, N/O relative abundances calculated on the basis of new AGN dominated models for some SGRB hosts are reported in Sect. 4. Concluding remarks follow in Sect. 5.
2 About the calculations
2.1 Description of the code
We use composite models which account consistently for photoionization and shocks. The code suma (see also Ferland et al 2016) is adopted. The main input parameters are those which are used for the calculations of the line and continuum fluxes. They account for photoionization and heating by primary and secondary radiation and collisional process due to shocks. The input parameters such as the shock velocity , the atomic preshock density and the preshock magnetic field (for all models =10-4Gauss is adopted) define the hydrodynamical field. They are used in the calculations of the Rankine-Hugoniot equations at the shock front and downstream. They are combined in the compression equation which is resolved throughout each slab of the gas in order to obtain the density profile downstream. Primary radiation for SB in the GRB host galaxies is approximated by a black-body (bb). The input parameters that represent the primary radiation from the SB are the effective temperature and the ionization parameter . A pure blackbody radiation referring to is a poor approximation for a star burst, even adopting a dominant spectral type (see Rigby & Rieke 2004). However, it is the most suitable because the line ratios that are used to indicate also depend on metallicity, electron temperature, density, ionization parameter, morphology of the ionized clouds and, in particular, the hydrodynamical picture. For an AGN, the primary radiation is the power-law radiation flux from the active centre in number of photons cm-2 s-1 eV-1 at the Lyman limit and spectral indices =-1.5 and =-0.7. The primary radiation source does not depend on the host physical condition but it affects the surrounding gas. This region is not considered as a unique cloud, but as a sequence of slabs with different thickness calculated automatically following the temperature gradient. The secondary diffuse radiation is emitted from the slabs of gas heated by the radiation flux reaching the gas and by the shock. Primary and secondary radiation are calculated by radiation transfer.
In our model the line and continuum emitting regions throughout the galaxy cover an ensemble of fragmented clouds. The geometrical thickness of the clouds is an input parameter of the code () which is calculated consistently with the physical conditions and element abundances of the emitting gas. The fractional abundances of the ions are calculated resolving the ionization equations for each element (H, He, C, N, O, Ne, Mg, Si, S, Ar, Cl, Fe) in each ionization level. Then, the calculated line ratios, integrated throughout the cloud thickness, are compared with the observed ones. The calculation process is repeated changing the input parameters until the observed data are reproduced by the model results, at least within 10 percent for the strongest line ratios and within 50 percent for the weakest ones.
However, some parameters regarding the continuum SED, such as the dust-to-gas ratio and the dust grain radius agr are not directly constrained by fitting the line ratios. Dust grains are heated by the primary radiation and by mutual collision with atoms. The intensity of dust reprocessed radiation in the infrared (IR) depends on and agr. In this work we use =10-14 by number for all the models which corresponds to 4.1 10-4 by mass for silicates (Draine & Lee 1994). The distribution of the grain size along the cloud starting from an initial radius is automatically derived by suma, which calculates sputtering of the grains in the different zones downstream of the shock. The sputtering rate depends on the gas temperature, which is V in the immediate post-shock region. In the high-velocity case ( 500 ) the sputtering rate is so high that the grains with agr0.1 m are rapidly destroyed downstream. So, only grains with large radius (agr0.1 m ) will survive. On the other hand, the grains survive downstream of low-velocity shocks (200). Graphite grains are more sputtered than silicate grains for T= 106 K (Draine & Salpeter 1979). Small grains (e.g. PAH) survive in the extended galactic regions on scales of hundred parsecs and lead to the characteristic features that appear in the SED. In conclusion, cold dust or cirrus emission results from heating by the interstellar radiation field, warm dust is associated with star formation regions and hot dust appears around AGN (Helou 1986) and in high velocity shock regimes. Therefore, we will consider relatively large grains, e.g. silicate grains with an initial radius of 0.1 -1.0 m .
In the radio range the power-law spectrum of synchrotron radiation created by the Fermi mechanism at the shock front is seen in most galaxies. It is calculated by suma adopting a spectral index of -0.75 (Bell 1977).
2.2 Calculation details
The calculations initiate at the shock front where the gas is compressed and adiabatically thermalised, reaching a maximum temperature in the immediate post-shock region T 1.5 ( /100 )2. T decreases downstream following recombination. The cooling rate is calculated in each slab. The downstream region is cut into a maximum of 300 plane-parallel slabs with different geometrical widths calculated automatically, to account for the temperature gradient. In each slab, compression is calculated by the Rankine-Hugoniot equations for the conservation of mass, momentum and energy throughout the shock front. Compression (n/) downstream ranges between 4 (the adiabatic jump) and 10, depending on and . The stronger the magnetic field, the lower the compression downstream, while a higher shock velocity corresponds to a higher compression. The ionizing radiation from an external source is characterised by its spectrum and by the flux intensity. The flux is calculated at 440 energies from a few eV to keV. Owing to radiative transfer, the spectrum changes throughout the downstream slabs, each of them contributing to the optical depth. In addition to the radiation from the primary source, the effect of the diffuse radiation created by the gas line and continuum emission is also taken into account, using 240 energies to calculate the spectrum. For each slab of gas, the fractional abundance of the ions of each chemical element is obtained by solving the ionization equations. These equations account for the ionization mechanisms (photoionization by the primary and diffuse radiation, and collisional ionization) and recombination mechanisms (radiative, dielectronic recombinations), as well as charge transfer effects. The ionization equations are coupled to the energy equation if collision processes dominate, and to the thermal balance if radiative processes dominate. The latter balances the heating of the gas due to the primary and diffuse radiations reaching the slab with the cooling due to recombinations and collisional excitation of the ions followed by line emission, dust collisional ionization and thermal bremsstrahlung. The coupled equations are solved for each slab, providing the physical conditions necessary for calculating the slab optical depth, as well as its line and continuum emissions. The slab contributions are integrated throughout the cloud. In particular, the absolute line fluxes corresponding to the ionization level i of element K are calculated by the term nK(i), which represents the density of the ion i. We consider that nK(i) = X(i) [K/H] nH, where X(i) is the fractional abundance of the ion i calculated by the ionization equations, [K/H] is the relative abundance of the element K to H and nH is the density of H (in number cm-3). In models including shock, nH is calculated by the compression equation (Cox 1978) in each slab downstream. Accordingly, the abundances of the elements are given relative to H as input parameters.
The N+ and O+ ions are linked by charge exchange reactions with H+, so they follow the same profile throughout the clouds. However, the [NII]/H line ratios are observed for blobs 1, 3, 4 and 98, indicating that the N/H relative abundance varies sensibly from blob to blob. Changing the element abundances (e.g. the N/H ratio) by a large factor () in a model will affect the cooling rate in the downstream recombination region throughout a cloud of gas. Consequently the calculated line ratios will change and the modelling process will be restarted with different input parameters in order to recover a good fit to all the observed line ratios.
Dust grains are coupled to the gas across the shock front by the magnetic field (Viegas & Contini 1994). They are heated by radiation from the AGN and collisionally by the gas to a maximum temperature, which is a function of the shock velocity, of the chemical composition and of the radius of the grains, up to the evaporation temperature (T(dust) 1500 K). The grain radius distribution downstream is determined by sputtering, which depends on the shock velocity and on the density. Throughout shock fronts and downstream, the grains might be destroyed by sputtering.
Summarizing, the code starts by adopting an initial (104 K) and the input parameters for the first slab. It then calculates the density from the compression equation, the fractional abundances of the ions from each level for each element, line emission, free-free emission and free-bound emission. It re-calculates by thermal balancing or the enthalpy equation, and calculates the optical depth of the slab and the primary and secondary fluxes. Finally, it adopts the parameters found in slab i as initial conditions for slab i + 1. Line and continuum intensities are integrated accounting for all the slabs. The number of lines calculated by suma is 200 for each model. They are calculated at the gaseous nebula that emits the spectrum, while the data are observed at Earth. Therefore they diverge by a factor (r2/d2) that depends on the distance of the nebula from the radiation centre (r), and on the distance (d) of the galaxy to Earth. We then calculate the line ratios to a specific line (in the present case H , which is a strong line), and compare them with the observed line ratios.
On this basis we calculate a grid of models. The set of models (e.g. Table 1) which best reproduce the line ratios is selected. We obtain the final model by cross-checking the fit of the calculated continuum SED to the observed one.
2.3 Modelling the continuum SED
The models constrained by the line spectra give a hint about the relative importance of the different ionization and heating mechanisms which are recognised throughout the continuum SED in each of the objects.
The gas ionized by the SB (or AGN) radiation flux emits continuum radiation (as well as the line fluxes) from radio to X-ray. The continuum accounts for free-free and free-bound radiation (hereafter addressed to as bremsstrahlung). The bremsstrahlung at 1014 Hz has a similar slope in all the diagrams. In fact, the bremsstrahlung continuum, emitted by free electrons accelerated in Coulomb collisions with positive ions (mostly H+, He+ and He++) in nebulae of charge Z has an emission coefficient (Osterbrock 1974):
Jν N+Z2(/3kT)1/2 e-(hν/kT) (1)
The photoionization radiation flux can heat the gas to T 2-4 104 K, while the gas is heated collisionally by the shock to a maximum of T ( )2, where is the shock velocity. The cooling rate downstream depends on N+ (N+ is the proton density). The trend of the bremsstrahlung as function of follows the interplay between T and . High temperatures of the emitting gas determine the maximum bremsstrahlung at high . At T1-4104 K the exponential term is significant at frequencies between 1014 and 1015 Hz. The temperatures are calculated by thermal balancing between the heating rates which depend on the photoionizing flux and the cooling rates by free-free, free-bound and line emission. Therefore, the radiation effect is seen mainly in this frequency range. In the radio range, the exponent in eq (1) tends to 0 and the continuum is . So the SEDs in all the diagrams of all galaxy types have similar trends at relatively low frequencies and the dust reprocessed radiation bump in the IR is clearly recognizable.
In conclusions, i) the black body radiation corresponding directly to the temperature dominating in the starburst is seldom observed in the UV, because absorption is very strong in this frequency range due to strong line formation. ii) The shock effect throughout the SED can be recognized from the maximum frequency and intensity of the dust reprocessed radiation peak in the infrared and of the bremsstrahlung at high frequencies. iii) The gas ionized by the SB (or AGN) radiation flux emits bremsstrahlung from radio to X-ray. The black body emission from the background old star population with Tbb 3000-8000 K generally emerges over the bremsstrahlung throughout the SED in the near-IR(NIR) - optical range. iv) In the radio range synchrotron radiation created by the Fermi mechanism is recognized by its spectral index. Thermal bremsstrahlung in the radio range has a steeper trend which becomes even steeper by self-absorption at low . In the far-IR only comparison with the observation data indicates the source of the continuum radiation flux, because thermal bremsstrahlung, synchrotron radio and cold dust reradiation may be blended.
3 Analysis of SGRB100628A spectra
The GRB100628A burst triggered the Swift/Burst Alert Telescope (BAT)(Barthelmy et al 2005). In the BAT energy window (15-350 keV) the burst had a duration of T90 (0.0360.009s, Immler et al 2010). NG15 used the multi-colour imager Gamma-Ray Burst Optical/Near-Infrared Detector (GROND) that is an imaging instrument at the European Southern Observatory (ESO) in La Silla MPG 2.2 m telescope, ESO/Very Large telescope (VLT) spectroscopy, and deep Australia Telescope Compact Array (ATCA) radio-continuum observations together with publicly available Gemini imaging data to investigate the suitable host and the galaxies in the field of GRB100628A.
NG15 searched for the SGRB100628A host among galaxies within and outside the XRT circle. They reported that the burst was followed by a faint X-ray afterglow but no optical counterpart was discovered. However, inside the XRT circle ”a potential host galaxy at a redshift of z = 0.102 was soon observed” as a morphologically disturbed, interacting galaxy system C at z = 0.102. NG15 claim that the objects within the XRT circle are connected by tidal streams reaching several kpc distances. We suggest that the host morphological structure is most likely shaped by merging of the progenitors. Strong emission lines of [OII], [OIII], H and H were revealed by VLT/FOcal Reducer and low dispersion Spectrograph (FORS2) spectroscopy indicating star formation activity and suggesting that the progenitors belonged to a young stellar population. Another galaxy (galaxy D), a radio-bright, luminous elliptical galaxy at a redshift z = 0.311 was observed outside the XRT. NG15 claim that the ”higher redshift solution for galaxy D fits slightly better into the ensemble properties of short GRBs known so far.” The redshift (z=0.311) of galaxy D is close to those found for other SGRB (z 0.4). This argument may however change by future observations.
3.1 Galaxy C. Line ratios
| line | [NeIII] | [OII] | H | H | [OIII] | H | [NII] | H | H |
|---|---|---|---|---|---|---|---|---|---|
| 3967 | 3727+ | 4340 | 4861 | 5007+ | 6563 | 6583 | 4861 | 4861 | |
| OBS1 | - | 7.15 | 0.36 | 1 | 4.13 | 3 | 0.96 | 1.9 | - |
| mod1 | - | 7.2 | 0.45 | 1 | 4.1 | 3 | 1. | - | 0.002 |
| mod | - | 6.9 | 0.45 | 1 | 4.17 | 3 | 1.1 | - | 6.6e-4 |
| OBS2 | 0.7 | 3.95 | 0.8 | 1 | 4.98 | 3 | - | 2.8 | - |
| mod2 | 0.54 | 3.8 | 0.46 | 1 | 4.94 | 2.95 | - | - | 0.0022 |
| mod | 0.6 | 3.98 | 0.45 | 1 | 4.99 | 3.07 | - | - | 5.5e-4 |
| OBS3 | - | - | 0.38 | 1 | 5.14 | 3 | 0.31 | 6.2 | - |
| mod3 | - | 0.73 | 0.46 | 1 | 5.2 | 2.95 | 0.36 | - | 0.084 |
| mod | - | 0.88 | 0.46 | 1 | 5.05 | 3.08 | 0.5 | - | 8.87 |
| OBS4 | - | - | - | 1 | 6.6 | 3 | 1.4 | 1.4 | - |
| mod4 | - | 0.77 | 0.46 | 1 | 6.65 | 2.95 | 1.2 | - | 0.08 |
| mod | - | 1.4 | 0.46 | 1 | 6.7 | 3. | 1.2 | - | 0.69 |
| OBS98 | 0.15 | - | - | 1 | 4.09 | 3 | 0.07 | 1.2 | - |
| mod98 | 0.3 | 0.2 | 0.46 | 1 | 4.04 | 3 | 0.07 | - | 25.14 |
| mod | 0.4 | 0.8 | 0.46 | 1 | 3.9 | 3 | 0.1 | - | 11.74 |
| OBS113 | - | - | - | 1 | 5.88 | 3 | - | 2.5 | - |
| mod113 | - | 0.7 | 0.46 | 1 | 5.86 | 3 | 0.4 | - | 0.092 |
| mod | - | 0.9 | 0.46 | 1 | 5.89 | 3 | 0.5 | - | 6.9 |
| OBS117 | - | - | - | 1 | 4.72 | 3 | - | 0.43 | - |
| mod117 | - | 0.7 | 0.46 | 1 | 4.75 | 3 | 0.064 | - | 0.1 |
| mod | - | 0.7 | 0.46 | 1 | 4.75 | 3 | 0.8 | - | 13.3 |
∗ AGN dominated models; 1 line flux in 10-17observed at Earth; 2 line flux in calculated at the nebula.
| log(O/H)+12 | log(N/H)+12 | |||||||
|---|---|---|---|---|---|---|---|---|
| 1018cm | 104K | - | 1 | - | - | |||
| mod1 | 120 | 70 | 0.08 | 8.8 | 0.0033 | - | 8.82 | 7.6 |
| mod | 120 | 70 | 0.025 | - | - | 0.037 | 8.82 | 7.7 |
| mod2 | 90 | 70 | 0.014 | 7.2 | 0.0043 | - | 8.82 | 7.7 |
| mod | 110 | 60 | 0.035 | - | - | 0.042 | 8.83 | 7.7 |
| mod3 | 100 | 100 | 15 | 6.0 | 0.1 | - | 8.82 | 8.0 |
| mod | 300 | 300 | 2.9 | - | - | 100 | 8.82 | 7.7 |
| mod4 | 100 | 100 | 9 | 6.9 | 0.1 | - | 8.82 | 8.3 |
| mod | 200 | 400 | 5.0 | - | - | 10 | 8.82 | 7.9 |
| mod98 | 300 | 500 | 1.3 | 10. | 10. | - | 8.82 | 7.3 |
| mod | 300 | 300 | 4.2 | - | - | 96 | 8.82 | 7.0 |
| mod113 | 100 | 100 | 15 | 6.8 | 0.1 | - | 8.82 | 7.78 |
| mod | 300 | 300 | 2.2 | - | - | 100 | 8.82 | 7.48 |
| mod117 | 100 | 100 | 15 | 6.4 | 0.1 | - | 8.82 | 7.0 |
| mod | 300 | 300 | 5.0 | - | - | 100 | 8.82 | 7.7 |
1 in 1010 photons cm-2 s-1 eV-1 at the Lyman limit;
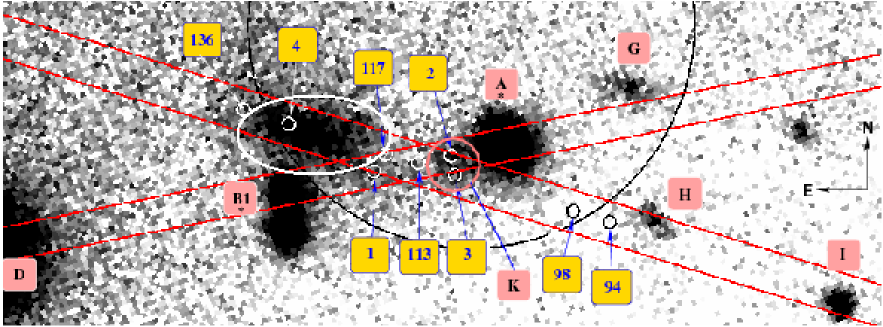
In Fig. 1 we report VLT/FORS2 long-slit spectroscopy presented by NG15 (in their fig. 2) of the GRB100628A field obtained by two slit positions covering the nine blobs (defined as positions detected with strong emission lines in the 2D spectra) 1, 2, 3, 4, 94, 98, 113, 117, 136. Numbers larger than 4 refer to the pixel coordinate along the corresponding slit.
All the observed lines are at the common redshift z0.1020.001. We have corrected the data presented by NG15 (in their table 3) following Osterbrock (1974) equations for the Milky Way. Cross-checking the dust-to-gas (d/g) ratio which derives from reproducing the observed IR data by dust reprocessed radiation flux from the GRB100628A host (Sect. 3.2), we have found that the WISE satellite data (which are all upper limits) constrain d/g to 0.0004 by mass. This value has been adopted by the models (Sect. 2.1). The average d/g in the Milky Way is 0.007 (Dwek & Cherchneff 2011). Therefore the reddening correction for dust obscuration is mainly Galactic. We adopted H /H =3 at the nebula because in the presence of shocks the H /H ratios range between 3.05 and 2.87 considering an emitting gas with T from 5000 K to 10000 K. H /H 4 can be found for high optical depths (Osterbrock 1974, fig 4.3).
We analysed the observed spectra by comparing calculated line ratios to the observed ones in Table 1 (in order to avoid the effect of distances). The spectra indicated as OBS1 - OBS117 correspond to the observed line ratios to H for blobs 1 to 117 (columns 2-8), respectively. The last two columns show the H line flux observed at Earth (in units of 10-17 ) and the H line fluxes calculated at the nebula (in ), respectively, for each model. We define a model as the set of the input parameters which yields the best fit to the data. In composite models the number of the significant input parameters is relatively high (see Sect. 2) because it accounts for both the photoionization and the shock (see Sect. 2) but it does not depend on the number of the observed lines. For each model the code calculates the flux of the most significant lines (more than 200) from the far- UV to the far -IR. The strong lines of a relatively abundant element (e.g. [OIII]5007+ and [OII] 3727+) from at least two ionization levels and the H and H lines constrain the model. Table 1 shows that although the [OIII] lines were observed in all the reported blobs, the [OII] lines were observed only in blobs 1 and 2. NG15 report three runs of VLT/FORS2 observations. In the third run (on 2013 April 03) they used the GG 435 order separation filter which does not cover the [OII]3727+ line wavelengths. because it cuts off the lines at 4400Å. Then, the observed [OII] lines are not shown in blobs 3, 4, 98, 113 and 117 spectra, while they are relatively strong in those corresponding to blobs 1 and 2. The [OII] lines together with the [OIII]5007+ lines are basic to constrain the models. We wonder why they were avoided in the observations of the blobs which are located not far from blobs 1 and 2. We consider two cases. First, the [OII] line fluxes were of the same order as those observed in blobs 1 and 2. Then we can predict, qualitatively, that the physical conditions throughout galaxy C are almost homogeneous. As a second choice we assume that the [OII] line fluxes were very low and the lines were blended with the noise (see NG15, their fig. 4). The [OII] line weakness is used to constrain the models and we can proceed to model the line ratios. We report in Table 1 the calculated [OII]/H line ratios even if the [OII] lines were not observed. This procedure is valid only if the [OII] lines were missing in the spectra because very weak.
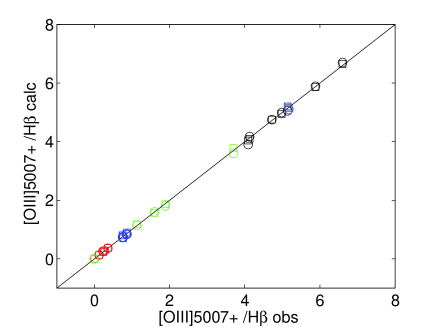
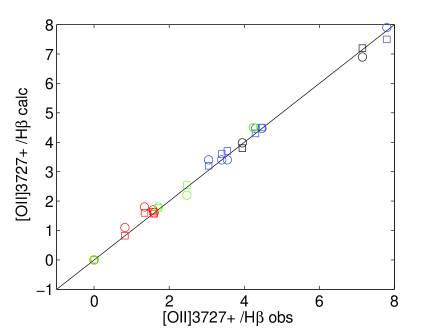
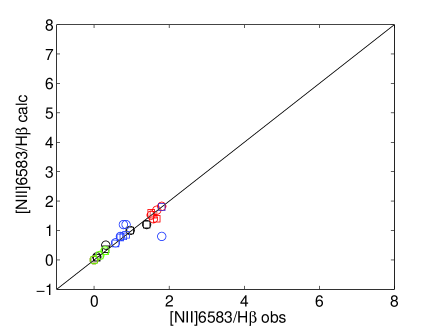
A SB is generally adopted to explain the photoionizing flux in GRB hosts by the observer community. To have a first hint about the initial parameters to be used in modelling, we have used the grids calculated by the code suma for models which account for both photoionization and shock in SB and AGN cases (Contini & Viegas 2001a,b). Then, refined models more suitable to each spectrum were calculated. Modelling results in terms of the selected physical parameters and the relative abundances (SB models mod1 to mod117) are shown in Tables 1 and 2. The line observed fluxes by NG15 do not include the errors, therefore we tried to reproduce them as close as possible. Table 1 and Figs. 2 show that the errors are 4 percent. In Table 2 columns 2-4 the shock velocity, the preshock density and the cloud geometrical thickness describe the shock. Columns 5 and 6 show the parameters for the SB (the effective temperature and the ionization parameter, respectively). In columns 8 and 9, O/H and N/H relative abundances calculated by the detailed modelling of the line ratios are reported.
Table 1 shows that the [OIII]/H line ratios range between a maximum of 6.6 in blob 4 and a minimum of 4.72 in blob 117. [OII]/H line ratios in blobs 1 and 2 have relatively high values of 7.15 and 3.95, respectively. This indicates that blob 2 and blob 3 spectra, although showing similar [OIII]/H (5), are emitted from gas in different physical conditions. The same is valid for blobs 1 and 117.
The best results calculated adopting SB models show that in blobs 1, 2, 3, 4, 113 and 117, the shock velocities are relatively low ( 120 ) typical of clumps in SGRB host galaxies (Contini 2018a). Preshock densities ( 70-100 ) are lower by a factor of 2 than in other SGRB hosts. In blob 98, and are relatively high (300 and 500, respectively). The geometrical thickness of blobs 1 and 2 clouds (Table 2) are smaller by factors of 100-1000 than for all the other blobs. ranges between a minimum of0.0046 pc for blob 2 to a maximum of 5 pc for blob 117. Cloud fragmentation () is very high in blob 2, lower by a factor of 6 in blob 1 and very low in blobs 3, 4, 98 and 113. Moreover, for all the models the calculated are lower by a large factor than the slit widths adopted by NG15 observations (1”.0 - 1”.3 which correspond at the GRB100628A distance of 465 Mpc to 2 kpc.) This suggests that a relatively large number of clouds may contribute to each of the observed spectra. To model the spectra of blobs leaking the [OII] lines, SB temperatures 7104 K (except for blob 98) were adopted and higher by factors of 25-30 than for blobs 1 and 2. Low [OIII]/[OII] line ratios could not be fitted by 7104K and a high (see Contini 2016a, fig. 1).
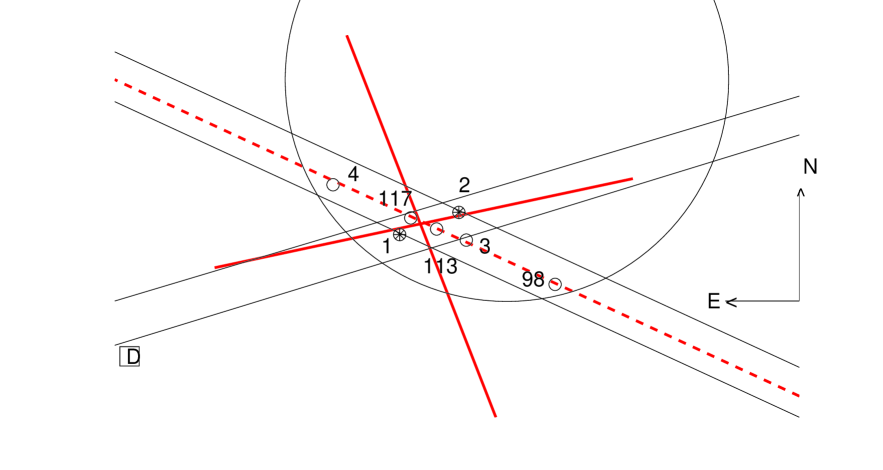
So far we have been dealing with the SB throughout galaxy C. The physical conditions calculated by SB models for the nine blobs aligned within the slit may show the trace of merging. It was suggested that the zones of higher pre-shock densities in merger galaxies (e.g. NGC 3393 Contini 2012) show the collision regions. Blobs 1 and 2 with lower densities and a lower ionization parameter are more adapted to represent the ISM. Concerning the radiation source, and show jumps which are unusual from different blobs at small distances. Therefore, we have tried to reproduce the spectra by a different radiation type: a power-law flux. We have found a suitable fit to the observed line ratios also for the power-law dominated models mod to mod. Table 1 shows that the data are well reproduced adopting both black-body and power-law dominated models. Power-law photoionization fluxes are used to reproduce the line ratios emitted from AGN galaxies. The results of AGN models (Table 2) show 200 and 300 for the clouds in all the blobs, except for blobs 1 and 2. Moreover, log()11 in all the blobs, except for 1 and 2, where is lower by a factor 200. The flux from the AGN is given in Table 2, column 7. The precision of model calculations is cross-checked with the observations in Fig. 2. A more suitable explanation of the parameter distribution throughout the GRB100628 host galaxy is suggested by the power-law model results. It allows to draw the ionization cones of an AGN (Fig. 1) which is not seen but emerges from the interpretation of the spectra. Blobs 1 and 2 are located in the ISM regions external to the AGN cones. Two or more photoionization sources can coexist in GRB hosts and in merger systems (Contini 2012 and references therein). It was found e.g. for a sample of AGN galaxies at z0.8 (Contini 2016b) that half of them show multiple radiation sources, a SB and an accreting AGN.
Moreover, AGN in SGRB are not unusual. An AGN dominates in NGC4993, the host galaxy of GW170817 (Levan et al. 2017, Contini 2018a). In particular, it was found that the bremsstrahlung emitted by the AGN clouds can be seen throughout the SED in the radio and in the UV - X-ray frequency domain. NG15 and Berger (2010) reported that the first revised error circle (Starling et al 2010) of SGRB100628A enclosed an AGN and Xie et al. (2016) found an AGN in the host galaxy of GRB150101B. In conclusion, to model SGRB100628A spectra, we adopt two model types, one dominated by a black body radiation flux for the SB and the other dominated by a power-law flux for the AGN. Both models account also for the shocks.
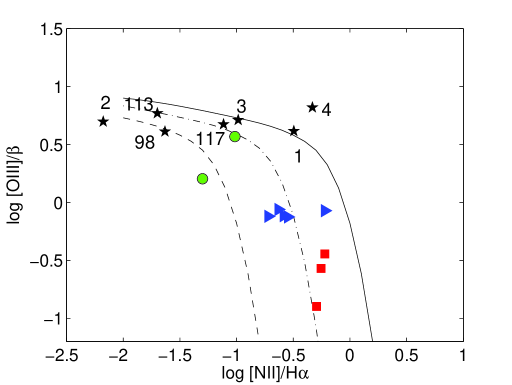
The results may be further checked by the other methods described in the following. It was suggested by Contini (2016b and references therein) that the [OIII]5007+/[OIII]4363 line ratios could be used to distinguish AGN from SB dominated spectra. However, the [OIII] 4363 line is not measurable in the NG15 spectra. Alternatively, (Baldwin, Phillips & Terlevich 1981) BPT diagrams are generally used to separate SB from AGN by cross-checking the line ratios. We can only make use of the diagram corresponding to [OIII]/H versus [NII]/H , because the [SII] and the [OI] lines are not reported by NG15. The spectra which show both [OIII]/H and [NII]/H line ratios are few because [NII] line fluxes are given only for blobs 1, 3, 4 and 98. They are reported in Fig. 3. For blobs 2 , 113 and 117 we have used as an upper limit the minimum [NII] line flux observed from the blob ensemble. The [NII]/H line ratios have been reddening corrected for each blob. N/H relative abundances in GRB hosts are often lower than solar, therefore the data can be misinterpreted through the original BPT diagram (cf Kewley et al 2001). Therefore we have roughly corrected the BPT diagrams by reducing the [NII]/H line ratios. Fig. 3 shows that blob 4 is in the AGN domain above and at the right of the separation lines in the diagram. Blobs 1 and 3 are on the border-line, blobs 2 and 98 are in the SB domain close to the border-lines for depleted N/H, while blobs 113 and 117 are located close to the AGN region with slightly depleted N. The interpretation of the 113 and 117 spectra is very uncertain because the [OII] and [NII] lines were not observed. The information obtained from the BPT diagram is, however, uncertain because the error bars are missing.
In order to determine whether the SB or the AGN dominates in each blob, we suggest a different criterion. We have selected the dominant photoionization source (a SB or an AGN) in each blob by comparing the H flux calculated by a SB dominated model to H calculated by an AGN (Table 1). We have found by the detailed modelling method that the AGN prevails in blobs 3, 4, 113 and 117 with a maximum H flux in blob 117. The relatively high H flux, which is appropriate to an AGN, decreases by a factor 2 in blobs 3 and 113 and by a factor 20 in blob 4. The H calculated flux for the AGN is high in blob 98 but lower than H calculated by the SB model. The AGN dominated blobs are aligned throughout the North-East/South-West slit direction (Fig. 1). We suggest that the alignment of blobs 4, 117, 113, 3 and 98 indicates the axis of the photoionization cones in the AGN with apex most likely situated between blobs 117 and 3 (where is maximum). The cone maximum opening angle is constrained by the location of blobs 1 and 2. The angle is close to those predicted by Wilson (1996) and Keel et al (2018), who claim that ionization cones have projected opening angles of typically 70o. Shock velocities of 200-300 and preshock densities of 300-400 which are characteristic of the AGN narrow line region (NLR), confirm this hypothesis. On the other hand, shock velocities and preshock densities of the gas inside blobs 1 and 2 are suitable to the ISM, outside the cones. In blobs 1 and 2, H calculated fluxes for SB models are higher than for AGN models. Moreover, the physical conditions are similar to those found in SB dominated host galaxies. In blobs 1 and 2, is lower. A low power-law flux (log10) cannot be neglected because it is similar to the flux generally calculated in the outer NLR of AGN (e.g. Contini et al 2002). A low , adapted to a low luminosity AGN (LLAGN) or to a low ionization narrow emission region (LINER), was found in NGC4993, the host galaxy of GW170817 (Contini 2018a). Moreover, the observed [OII]/H and [OIII]/H line ratios in blobs 1 and 2 are similar to those presented by Ho et al (1993) in their sample of LINERs for galaxies NGC1167 and NGC1275. (However, the [NII]/H ratios are higher by a factor 5 for the two LINERs than for galaxy C.) These objects were classified as a LINER and a shock dominated galaxy, respectively, by Contini (1997).
Blob 98 which is located in the tidal tail of galaxy C at a distance of 7” (which is translated to 13 kpc at z=0.102) deserves particular attention. This distance is roughly reached by the photoionization cone in the AGN extended NLR. AGN characterised by conical or biconical structures were observed up to kpc distances and the extended NLR even to 12-20 kpc (Mulchaey et al 1996, Schmitt et al 2003). We have found that the H flux emitted by the clouds photoionised by the SB overcomes by only a factor of 2 the AGN H flux. Moreover, the emitting gas shows in blob 98 and higher than those characteristic of GRB hosts (Contini 2016a). The high in blob 98 indicates that the emitting clouds are close to the black-body radiation source. Therefore, we suggest that the SB bulk is located in the tail of galaxy C which is also reached by the AGN flux. In conclusion, the clouds in blob 98 show the signature of both the SB and the AGN. Blob 3, 4, 113 and 117 spectra throughout SGRB100628A are more properly reproduced by AGN models.
For all the gaseous clouds within the blobs, O/H relative abundances are solar ((O/H)⊙=6.6 10-4, (N/H)⊙= 10-4, (S/H)⊙= 1.6 10-5 and (Ne/H)⊙= 10-4, Grevesse & Sauval 1998). Ne/H are lower than solar in blob 98. 12+log(N/H) spans between a maximum of 8.3 and a minimum of 7 and S/H changes from blob to blob depending, in particular, on the S atomic fraction trapped into dust grains.
3.2 Fitting the observed continuum SED
| Inside the XRT | ||
|---|---|---|
| W1(3.4m )1 | 20.0 AB mag. | black triangle |
| W2(4.6m )1 | 20.2 AB mag. | black triangle |
| W3(12m )1 | 17.8 AB mag. | black triangle |
| W4(22m )1 | 15.4 AB mag. | black triangle |
| 5.5 GHz2 | Fν=4616Jy | black asterisk |
| 9.0 GHz2 | Fν18Jy | black triangle |
| 5.5 GHz2 | Fν16Jy | black triangle |
| 9.0 GHz2 | Fν18Jy | black triangle |
| Outside the XRT | ||
| Galaxy D | ||
| g’ 2 | 22.460.07 AB mag. | red circle |
| r’ 2 | 20.720.02 AB mag. | red circle |
| i’ 2 | 20.170.02 AB mag. | red circle |
| z’ 2 | 19.840.02 AB mag. | red circle |
| J 2 | 18.690.02 AB mag. | red circle |
| H 2 | 18.350.03 AB mag. | red circle |
| Ks 2 | 18.060.05 AB mag. | red circle |
| 5.5 GHz2 | Fν=15123Jy | red square |
| 9.0 GHz2 | Fν=8328Jy | red square |
| W1(3.4m )1 | 18.650.08 AB mag. | red star |
| W2(4.6m )1 | 18.870.18 AB mag. | red star |
| W3(12m )1 | 17.8 AB mag. | red triangle |
| W4(22m )1 | 15.4 AB mag. | red triangle |
1 WISE satellite; 2 ATCA
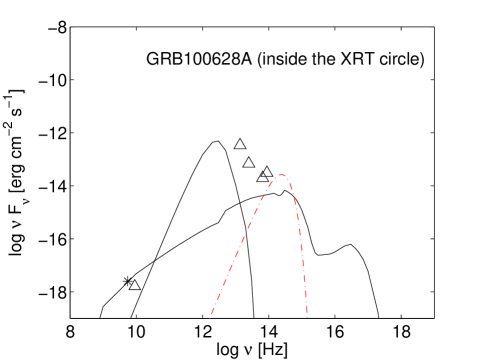
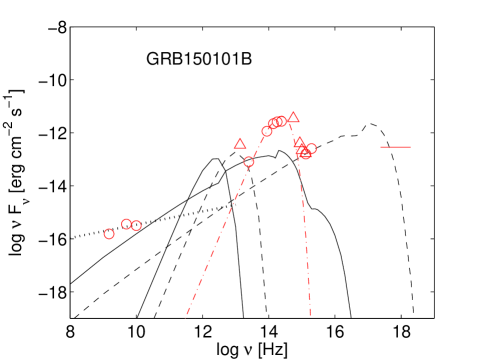
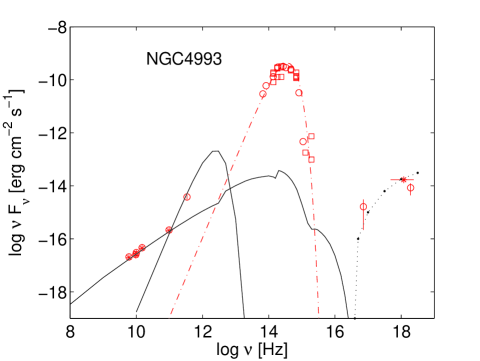
In Fig. 4 we present the modelling of SGRB100628A continuum SED outside and inside the XRT circle and we compare them with the SED of SGRB150101B host and NGC4993 galaxies. Each model is represented in the diagrams by two lines, one representing the bremsstrahlung emitted from the nebula and the other the dust reprocessed radiation consistently calculated (Sect. 2.3). The lines are represented by the same symbol. More clouds may contribute to the observed SED, therefore different models can appear in each galaxy diagram. In all the diagrams the black body radiation from the underlying old stellar population dominates the optical-IR range.
3.2.1 Radio SED inside the XRT error circle
A single relatively bright radio source inside the XRT error circle was detected slightly west of object A (NG15 their fig. 2) with an integrated density flux at 5.5 GHz of =46 16 Jy. This source lies 2” north-east of blob 98, which shows an emission-line spectrum. The radio emission is not detected at 9.0 GHz ( 18 Jy). NG15 did not detect galaxy C as shown in their fig. 3 in the radio, only upper limits at 5.5 GHz and 9.0 GHz. With regards to the possible identity of the radio source inside the XRT circle, we agree with NG15 who claim that the radio emission is situated in the star forming region of galaxy C tidal tail. We consider blob 98 presented by NG15 in their fig. 3 (that is located in the tidal tail of galaxy C) because it was found that is particularly high suggesting that blob 98 could be close to the SB bulk. The clouds throughout the host galaxy blobs emit line as well as continuum radiation fluxes. The continuum is represented by the bremsstrahlung (Sect. 2.3) which appears throughout the SED from radio to the soft X-ray frequencies, reradiation by dust in the IR, and the underlying old star radiation which dominates in the IR-optical range. Therefore, the continuum emitted from blob 98 - calculated by the same model (mod98) that was found by fitting the line ratios (Table 2) appears in Fig. 4 (top-left) diagram. In the radio range, the datum observed at 5.5 GHz and the upper limit at 9.0 GHz are used to constrain the continuum calculated within the XRT circle. We explain the trend of the observed radio flux by noticing that the two datapoints (one observed and one upper limit) belong to two different sources. The upper limit refers to dust reradiation in the far IR domain, while the observed datum at a lower frequency is fitted by the thermal bremsstrahlung emitted from the gas. The data in the IR observed by the WISE satellite are all upper limits. They suggest that the underlying stellar population flux calculated by a temperature of 3000K is low but it is still emerging over the bremsstrahlung.
3.2.2 Galaxy D. Underlying old star population flux outside the XRT
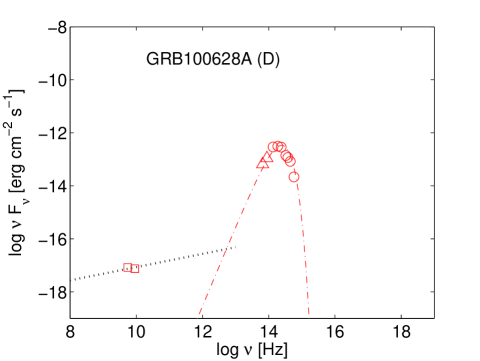
In previous works (e.g. Contini 2018b) we have shown that the continuum SED is composed by different contributions: the bremsstrahlung from the gas emitting the lines, reradiation from dust, the underlying stellar background, radio synchrotron radiation, and eventually X-ray from the AGN. We suggest that galaxy D which does not contribute to the observed optical lines, shows the underlying old stellar population flux observed throughout the continuum SED in the IR. In Fig. 4 (top right diagram), we show the optical-IR continuum observed from galaxy D at z 0.3 (NG15, their fig. 7) outside the XRT error circle. The optical and NIR JHK bands observed from galaxy D are well fitted by a black body flux at 3000 K, confirming that in the elliptical galaxy D the stellar population is old. The galaxy is also detected at other frequencies. The radio data observed from galaxy D follow the trend of the synchrotron radiation created by the Fermi mechanism at the shock front.
3.2.3 SEDs of SGRB150101B and NGC4993 hosts
We compare the continuum SED of GRB100628A (inside and outside the XRT error circle) with the SEDs presented for other SGRB hosts enclosing an AGN. Levan et al. (2015), Fong et al. (2015) and Troja et al. (2015) suggested that GRB150101B contains a central AGN. It was confirmed by Xie et al (2016) multiwavelength analysis on the basis of Chandra observations. Xie et al adopted z=0.1345 as the redshift of the host galaxy. There are no line fluxes reported for SGRB150101B host galaxy. Modelling directly the continuum SED in Fig. 4 (bottom left diagram) we reproduce the observed X-ray band and the optical-UV data by the bremsstrahlung calculated adopting a shock dominated model (=0, =0) with =700 and =300 . This model also constrains the dust reradiation peak. High velocities are confirmed by collisionally heated grains to relatively high temperatures. In fact, the dust reradiation peak is shifted towards relatively high frequencies. Radio emission is reproduced by synchrotron radiation created by the Fermi mechanism at the shock front. Besides the shock dominated model, we check whether the bremsstrahlung calculated by an AGN dominated model (+shock) may contribute to the continuum SED. An AGN model has been selected among those fitting SGRB100628A host spectra (mod, Table 2). Its contribution to the SED of SGRB150101B is shown at 2.51013 Hz in the IR and to the flux at 10 GHz in the radio range. The underlying stellar radiation flux in the IR is reproduced by a black-body at 3000K.
With regards to NGC4993 which is reported in Fig. 4 bottom right diagram, radio emission is thermal bremsstrahlung, while both the soft- and the hard- X-ray fluxes come from the AGN. Comparison with the two SGRB host (100628A and 150101B) SEDs confirms that radiation from the underlying stellar population - which is reproduced by a black-body at 4500K - is outstanding because exceeding the underlying fluxes in the other hosts by a factor of 100. (Contini 2018a).
4 N/O abundance ratios
| [OII] | [OIII] | H | [NII] | [SII] | [SII] | N/H | O/H | S/H | |||||
|---|---|---|---|---|---|---|---|---|---|---|---|---|---|
| 3727 | 5007+ | 6563 | 6548+ | 6716 | 6731 | 1 | 2 | 3 | 4 | 5 | 6 | 7 | |
| subtr | 1.34 | 0.23 | 3. | 1.58 | 0.53 | 0.35 | - | - | - | - | - | - | |
| modp1* | 1.8 | 0.26 | 3. | 1.4 | 0.53 | 0.4 | 100 | 100 | 60 | 7.9 | 8.78 | 6.3 | 3 |
| North | 0.9 | 0.127 | 3 | 1.52 | 0.39 | 0.36 | - | - | - | - | - | - | - |
| modp2* | 1.1 | 0.13 | 3.47 | 1.52 | 0.39 | 0.53 | 200 | 240 | 6 | 8 | 8.78 | 7.9 | 1.6 |
| Center | 1.57 | 0.27 | 3. | 1.67 | 0.15 | 0.149 | - | - | - | - | - | - | - |
| modp3* | 1.7 | 0.27 | 3 | 1.69 | 0.12 | 0.17 | 200 | 240 | 2.6 | 7.92 | 8.78 | 6.3 | 2 |
| South | 1.6 | 0.36 | 3. | 1.8 | 0.5 | 0.81 | - | - | - | - | - | - | - |
| modp4* | 1.6 | 0.36 | 3.5 | 1.82 | 0.54 | 0.75 | 200 | 240 | 2. | 8 | 8.78 | 7 | 2.4 |
1:; 2:; 3:1018cm; 4:12+log(N/H); 5:12+log(O/H); 6:12+log(S/H); 7: 108 photon cm-2 s-1 eV-1 at the Lyman limit
| [OII] | H | [OIII] | H | [NII] | [SII] | [SII] | N/H | O/H | S/H | |||||
|---|---|---|---|---|---|---|---|---|---|---|---|---|---|---|
| 3727+ | 5007+ | 6585 | 6717 | 6731 | 5 | 6 | 7 | 8 | 9 | 10 | 11 | |||
| OT site1 | 4.47 | - | 0.87 | 3 | 0.7 | 0.66 | 0.33 | - | - | - | - | - | - | - |
| mS1* | 4.47 | 0.46 | 0.84 | 2.98 | 0.8 | 0.56 | 0.46 | 115 | 220 | 5 | 7.3 | 8.83 | 6.15 | 11 |
| OT site2 | 3.4 | 0.89 | 0.76 | 3 | 0.57 | 1.19 | 0.59 | - | - | - | - | - | - | - |
| mS2* | 3.4 | 0.457 | 0.74 | 3 | 0.58 | 0.85 | 0.7 | 120 | 220 | 5.6 | 7.47 | 8.83 | 6.4 | 8 |
| core2 | 3.55 | 0.49 | 0.75 | 2.96 | 0.85 | 0.63 | 0.5 | - | - | - | - | - | - | - |
| mS3* | 3.4 | 0.46 | 0.74 | 3 | 1.2 | 0.85 | 0.7 | 120 | 220 | 5.6 | 7.6 | 8.83 | 6.4 | 8 |
| arm2 | 4.3 | [0.5] | 0.85 | 3 | 1.8 | 0.27 | 0.5 | - | - | - | - | - | - | - |
| mS4* | 4.47 | 0.46 | 0.84 | 2.98 | 0.8 | 0.56 | 0.46 | 120 | 220 | 5.0 | 7.3 | 8.83 | 6.15 | 11 |
| obs3 | 3.05 | - | 0.77 | 3 | 0.78 | - | - | - | - | - | - | - | - | - |
| mS5* | 3.4 | 0.46 | 0.74 | 3 | 1.2 | 0.85 | 0.7 | 120 | 220 | 5.6 | 7.6 | 8.83 | 6.4 | 8 |
| 051221a4 | 7.8 | 0.46 | 5.17 | 3 | - | - | - | - | - | - | - | - | - | - |
| mS6* | 7.9 | 0.46 | 5.1 | 2.96 | 0.54 | 0.27 | 0.28 | 170 | 100 | 1 | 7. | 8.81 | 6.15 | 24.5 |
1de Ugarte Postigo et al. (2014)(X-shooter); 2de Ugarte Postigo et al. (2014)(FORS);3 Cucchiara et al. (2013)(DEIMOS); 4 Soderberg et al. (2006)(Gemini-N GMOS); 5:; 6:; 7:1018cm; 8:12+log(N/H); 9:12+log(O/H); 10:12+log(S/H); 11:108 photon cm-2 s-1 eV-1 at the Lyman limit
| GRB | z | [OII] | [OIII] | H | [NII] | N/H | O/H | ||||
|---|---|---|---|---|---|---|---|---|---|---|---|
| 3727 | 5007+ | 6563 | 6548+ | 1 | 2 | 3 | 4 | 5 | 6 | ||
| 061006 | 0.4377 | 4.24 | 1.89 | - | - | - | - | - | - | - | - |
| modb1* | 4.5 | 1.8 | 3. | - | 100 | 100 | 0.8 | - | 8.82 | 0.2 | |
| 061210 | 0.4095 | 1.71 | 1.6 | 3 | 0.15 | - | - | - | - | - | - |
| modb2* | 1.8 | 1.6 | 3. | 0.15 | 180 | 350 | 0.16 | 6.9 | 8.8 | 0.06 | |
| 070724 | 0.4571 | 2.47 | 1.13 | 3. | - | - | - | - | - | - | - |
| modb3* | 2.20 | 1.14 | 3 | - | 130 | 350 | 0.34 | - | 8.81 | 0.8 | |
| 050709 | 0.1606 | - | 3.7 | 3. | 0.29 | - | - | - | - | - | - |
| modb4* | (1.9) | 3.6 | 3. | 0.32 | 80 | 200 | 80 | 7.25 | 8.6 | 40 |
1:; 2:; 3:1018cm; 4:12+log(N/H); 5:12+log(O/H); 6: 108 photon cm-2 s-1 eV-1 at the Lyman limit
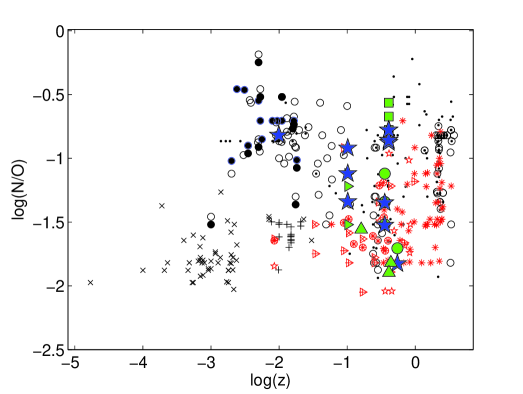
Fig. 5 shows the distribution of N/O relative abundances calculated for different types of galaxies as a function of the redshift. The results obtained for the SGRB100628A blobs are compared with those of other SGRB host galaxies, LGRB hosts, AGN, LINER, and HII regions at z0.4. In a previous paper (Contini 2018a) we have calculated N/O for NGC4993 by an AGN dominated model which was constrained by reproducing the observed continuum SED. For the other SGRB host galaxies we have used SB models because well fitting the line ratios. Moreover, a SB regime is generally recommended in GRB hosts. Fig. 5 shows that although the N/O ratios calculated for SGRB100628A are in agreement with those calculated for AGNs and other objects at the same z, N/O ratios calculated from the Perley et al. (2012) spectra of the SGRB100206A host complex at z=0.4068 (Fig. 5, large squares) exceed the solar values in all the observed positions (Contini 2018a, fig. 6). We would like to investigate whether the modelling of the line ratios adopting a power-law flux could lead to different results, in particular for N/O. The AGN hypothesis was discarded by Perley et al. on the basis of the H and [OIII] line strengths, however, by qualitative analysis. We checked the AGN model also for the SGRB100206A host complex (Perley et al (2012), the Berger (2009) host sample at z=0.16-0.45, for the host galaxies of SGRB130603B (de Ugarte Postigo et al. 2014) at z=0.356 and for the SGRB051221a host (Soderberg et al. 2006) at z=0.546. The corrected observed line ratios are reproduced by AGN dominated models (modp1*-modp4*, mS1*-mS4*, modb1*-modb4*) (Tables 4-6). The AGN models are described in the last seven columns of the tables. Tables 4 - 6 show that the O/H values calculated by the AGN models are close to the solar ones and the N/H are nearly solar for SGRB100206A, 0.3 solar for SGRB130603B and SGRB051221a and 0.1 solar for Berger (2008) sample. Therefore, they are dislocated throughout the BPT diagram (Fig. 3). Only SGRB100206A and SGRB061210 seem to be SB dominated. The H fluxes calculated at the nebula by AGN models are compared in Table 8 with H fluxes calculated by SB models by Contini (2018a). Table 8 shows that the H absolute fluxes calculated by an AGN model exceed those calculated by a SB for Perley et al., de Ugarte Postigo et al. and Soderberg et al. objects, but are lower for the Berger sample, except for SGRB050709 which, however, is less reliable because the spectra lack the observed [OII]/H line ratio. We conclude that both an AGN and a SB can photoionize and heat the SGRB host gas.
| symbol | object | Ref. |
|---|---|---|
| red asterisks | GRB hosts | (1) |
| red triangle+cross | LGRB hosts | (2) |
| red pentagrams | LGRB different hosts | (3) |
| red triangle +plus | LGRB hosts with WR stars | (4) |
| red encircled asterisks | LGRB at low z | (5) |
| black dots | starburst galaxies | (6,7) |
| black open circles | AGN | (7,8,9) |
| black filled circles | LINER | (10) |
| black plus | low-luminosity nearby galaxies | (11) |
| black cross | HII regions in local galaxies | (12) |
(1) (Krühler et al.); (2) (Savaglio et al.); (3) (Contini 2016a, table 8); (4) (Han et al.); (5) (Niino et al.); (6), (7) (reported by Contini 2014 and references therein); (8) (Contini 2016a); (9) (Koski 1978, Cohen 1983, Kraemer et al. 1994, Dopita et al. 2015); (10) (Contini 1997); (11) (Marino et al. 2013); (12) (Berg et al. 2012);
In Fig. 5, N/O results of AGN models for the SGRB100206A spectra, for SGRB130603B and for SGRB051221a are superimposed on previous results obtained by SB models. The N/O ratios calculated by the AGN models roughly follow and complete the AGN trend. The lowest N/O ratios calculated by SB models for the Berger (2009) SGRB host sample appear in the N/O domain of LGRB hosts at z0.4.
5 Concluding remarks
NG15 presented observations of line and continuum fluxes from the galaxy complex inside and outside the XRT error circle of SGRB100628A, in order to reveal the host galaxy. They indicated after a detailed discussion galaxies C and D as the most appropriate ones. They add that the ”higher redshift solution (for galaxy D) fits slightly better into the ensemble properties of short GRBs known so far.” This claim will perhaps change by future observations.
In particular, the [OII] lines were provided by the observations only for blobs 1 and 2. For the other blobs the [OII] lines were excluded from the spectra by the use of the GG 435 filter which cuts off the lines at 4400Å. The [OII] lines together with the [OIII]5007+ lines are basic to constrain the models. We consider two extreme cases. Assuming that the [OII] line fluxes are of the same order as those observed in blobs 1 and 2 we can predict, qualitatively, that the physical conditions throughout galaxy C are nearly homogeneous. As a second choice we assume that the [OII] line fluxes are very low, therefore we can proceed by the detailed modelling of the spectra. We consider in the first instance that the stars are the dominant illumination source, therefore we have used in our model a black-body photoionizing radiation. In a turbulent regime such as that acting within the GRB dominated hosts radiation is coupled to the collisional effects due to shocks which most likely derive from the progenitor merging. We have found that for blobs 1 and 2 which show low [OIII]/[OII] line ratios, and are much lower than for blobs 3, 4, 113, 117, which are aligned with the NE/SW slit. Blob 98 which is located in the tidal tail of the galaxy has the maximum =105K and =10. However, the inhomogeneous distribution of throughout galaxy C is not explained by the SB dominated models. This suggests that a different photoionizing source should contribute to the calculations of the line intensities. Therefore, we have modelled the line ratios observed from the blobs by an AGN dominated model. The AGN flux which yields the best fit is similar to that found in the NLR of Seyfert 2 galaxies (log11-12). Shock velocities and pre-shock densities are suitable to those found in the AGN NLR. An AGN and a SB can coexist in galaxy C as was suggested e.g. by Contini (2016b) for galaxies at z0.8. The merger-AGN connection in galaxies at z=0 was recently discussed by Ellison et al (2019). On the basis of the calculated H line flux at the nebula, the AGN dominates the spectra from blobs 3, 4 , 113, 117, which are displaced throughout galaxy C along the axis of the bicone AGN structure in the North-East/South-West slit direction (Fig. 1), while the SB bulk is close to blob 98 in the tidal tail of the galaxy, in agreement with NG15. Blob 98 is also reached by the AGN flux. Blobs 1 and 2 are located in the ISM outside the AGN photoionization cones. They roughly indicate that the apex of the AGN bicone should be near blobs 117 and 3. Fragmentation is maximum near blobs 1 and 2. O/H are nearly solar for all the gaseous clouds in the blobs, while N/H ratios span a factor of 10.
Radio observations reported a point source at =5.5GHz and an upper limit at 9 GHz inside the XRT error circle, close to blob 98. They are explained by the SB model calculated for blob 98. In fact we calculated the continuum SED by the same model which reproduces the line ratios observed from the starburst in galaxy C tidal tail. The results show that the two frequency emissions have different origins. One is bremsstrahlung from the gas, whereas the other (the upper limit) is explained by dust reprocessed radiation which decreases rapidly at low frequencies in the far IR. Galaxy D outside the XRT error circle shows the flux from the underlying old star population at T=3000 K. The radio data in galaxy D follow the synchrotron radiation trend. We compare the SGRB100628A host SED with that of SGRB150101B host and of NGC4993 which encloses an AGN. The continuum SED of SGRB150101B host is reproduced by a shock dominated model calculated by =700 and =300 (Fig. 4) which explains the X-ray band, the optical-UV data, relatively hot dust reradiation and radio synchrotron radiation created by the Fermi mechanism. Contini (2018a) confirmed that the line ratios observed from NGC4993 the host galaxy of GW170817 can be explained by an AGN (Fig. 4). Comparison with the SGRB100628A and SGRB150101B SEDs strengthens the evidence that the underlying stellar radiation throughout the NGC4993 host SED is outstanding because it exceeds the IR flux in other objects by at least a factor of 100.
New calculations by AGN dominated models of a sample of SGRB host galaxy spectra, that were previously modelled adopting a SB photoionizing source, are presented. The line ratios calculated by the AGN source nicely fit the observed ones, as well as those calculated by SB dominated models (Contini 2018a). The precision of model calculations is cross-checked with the observations. More spectroscopic data would better constrain the models. The BPT diagram (Fig. 3) shows ambiguous results because the N/H ratios span a large range of values (Kewley et al 2001). Therefore, we have selected SB from AGN dominated hosts comparing the calculated H line flux intensity (Table 8). Summarizing, model results suggest that an AGN and a SB may coexist in SGRB100628A. Updating the diagram that shows N/O versus the redshift in the light of the new results (Fig. 5), we obtain that N/O relative abundances in SGRB host galaxies follow the AGN distribution, while NGC4993 at z=0.009873 is seen at the edge of the AGN-LINER domain of local galaxies. A SB dominates the hosts of the Berger (2009) SGRB galaxy sample. A more significant N/O trend distribution as a function of z on a large scale will appear when spectral data for SGRB hosts at z1 will be available.
| SGRB | H (AGN) | H (SB) |
|---|---|---|
| 130603B OT site1 1 | 0.0243 | 0.014 |
| 130603B OT site2 1 | 0.022 | 0.016 |
| 051211a 2 | 0.01 | 0.007 |
| 100206A subtr 3 | 0.052 | 0.003 |
| 100206A North 3 | 0.054 | 0.025 |
| 100206A Center 3 | 0.024 | 0.01 |
| 100206A South 3 | 0.018 | 0.009 |
| 061006 4 | 0.0015 | 0.006 |
| 061210 4 | 0.006 | 0.167 |
| 070724 4 | 0.0065 | 0.072 |
| 050709 4 | 0.42 | 0.19 |
1 de Ugarte Postigo et al. (2014); 2 Soderberg et al. (2006); 3 Perley et al. (2012); 4 Berger (2009).
Acknowledgements
I am grateful to Prof Forveille, the Editor-in-Chief of A&A for permitting to reproduce Nicuesa Guelbenzu et al. (2015, fig. 2).
References
Baldwin, J., Phillips, M., Terlevich, R. 1981, PASP, 93, 5
Barthelmy, S.D. et al 2005, Space Sci. Rev., 120, 143
Berg, D.A. et al 2012, ApJ, 754, 98
Berger, E. 2014, ARA&A, 52, 43
Berger, E. 2013, ApJ, 765, 121
Berger, E. 2010, ApJ, 722, 1946
Berger, E. 2009, ApJ, 690, 231
Berger, E. et al. 2005, Nature, 438, 988
Bloom, J.S. et al. 2006 ApJ,638, 354
Cohen, R.D. 1983, ApJ, 273, 489
Contini, M. 2018b, arXiv180103312
Contini, M. 2018a, A&A, 620, 37
Contini, M. 2016a, MNRAS, 460, 3232
Contini, M. 2016b, MNRAS, 461, 2374
Contini, M. 2014, A&A, 564, 19
Contini, M. 2012, MNRAS, 425, 1205
Contini, M. 1997, A&A, 323, 71
Contini, M. & Viegas, S.M. 2001a ApJS, 137, 75
Contini, M. & Viegas, S.M. 2001b ApJS, 132, 211
Contini, M., Radovich, M., Rafanelli, P., Richter, G.M. 2002, ApJ, 572, 124
Cox, D..P. 1972, ApJ, 178, 159
Cucchiara, A. et al 2013, ApJ, 777, 94
de Ugarte Postigo, A. et al. 2014, A&A, 563, 62
Dopita, M.M. et al. 2015, ApJS, 217, 12
Draine, B.T. & Lee, M.M. 1994, ApJ, 285, 89
Draine, B.T. & Salpeter, E.E. 1979, ApJ, 231, 438
Dwek, E. & Cherchneff, I. 2011 ApJ, 727, 63
Ellison, S.L. et al ArXiv:1905.08830
Ferland, G. 2016 arXiv160308902, The Lexington Benchmarks for Numerical Simulations of Nebulae
Fong, W. et al. 2013, ApJ 769, 56
Fong, W. , Berger, E. 2013, ApJ, 776, 18
Fong, W., Berger, E., Fox, D.B. 2010, 708, 9
Gehrels, N., White, N., Barthelmy, S. et al. 2005, Nature, 437, 851
Grevesse, N., Sauval, A.J. 1998 SSRv, 85, 161
Han, X. H., Hammer, F., Liang, Y. C., Flores, H., Rodrigues, M., Hou, J. L., Wei, J. Y. 2010, A&A, 514, 24
Helou, G. 1986, ApJ, 311, L33
Ho, L., Filippenko, A. V., Sargent, W.L.W. 1993, ApJ, 417, 63
Kewley, L.J., Dopita, M.A., Sutherland, R.S., Heisler, C.A., Trevena, J. 2001, ApJ, 556, 121
Koski, A. 1978, ApJ, 223, 56
Kouvelioutou, C et al. 1993, ApJL, 413, L101
Kraemer, S.B., Wu, C.-C., Crenshaw, D.M.,Harrington, J.P. 1994, ApJ, 435, 171
Krühler, T. et al. 2015 A&A, 581, 125
Immler, S., Starling, R.L.C., Evans, P.A., Barthelmy, S.D., Sakamoto, T. 2010, GCN Rep. 290, 1
Levan, A.J. et al. 2017 ApJL, 848, L31
Marino, R.A. et al. 2013, A&A, 559, 114
Mulchaey, J.S., Wilson, A.S., Tsvetanov, Z. 1996, ApJ, 467, 197
Nicuesa Guelbenzu A. et al 2015, A&A, 583, A88, NG15
Niino, Y. et al. 2016 Publ. Astron. Soc. Japan, 69, 27
Osterbrock, D.E. 1974, in Astrophysics of Gaseous Nebulae, W.H Freeman and Co., San Francisco
Pan, Y.-C. et al. 2017, ApJ, 848, L30
Perley, D.A. et al. 2012, ApJ, 758, 122
Rigby, J.R. & Rieke, G.H. 2004, ApJ, 606, 237
Savaglio, S., Glazerbrook, K., Le Borgne, D. 2009, ApJ, 691, 182
Schmitt, H. R., Donley, J.L., Antonucci, R.R.J., Hutchings, J.B., Kinney, A.L., Pringle, J.E., 2003, ApJ, 597, 768
Selsing, J. et al. 2018, A&A, 616, 48
Soderberg, A.M. et al. 2006, ApJ, 650, 261
Starling, R.L.C., Beardmore, A.P., Immler, S. 2010, GRB coordinates Network, 10907,1
Troja, E., Sakamoto, T., Lien, A., Cenko, S.B., Gehrels, N. 2015, GCN, 18289, Q 2015
van den Bergh, S., Marshner, A.P., Terzian, Y 1973 ApJS, 26, 19
Villar, V.A. et al 2017, ApJ,851, L21
Wu, Q., Feng, J., Fan, X. 2018, ApJ, 855, 46
Xie, C., Fang, T., Wang, J., Liu, T., Jiang, X. 2016, ApJL, 824, L17