Cardiac Mechano-Electrical Dynamical Instability
Abstract
In a computational study we reveal a novel dynamical instability of excitation waves in the heart muscle. The instability manifests itself as gradual local increase in the duration of the action potential which causes formation and hypermeandering of spiral waves. The mechanism is caused by stretch-activated currents that cause wave front-tail collisions and beat to beat elongation of the action potential duration due to biexcitability. We discuss the importance of the instability for the onset and dynamics of cardiac arrhythmias.
Spiral waves of excitation have been found in many biological, physical, and chemical systems Alles:76 ; gerisch_stadienspezifische_1965 ; agladze_waves_2000 . Spiral waves emerge in excitable media after wave break, a temporary, local block of wave propagation, after which the wave curls around it’s back forming a spiral Belousov ; ZaZh70 . The emergence of spiral waves in the heart muscle causes life-threatening cardiac arrhythmias WinfStr:84 . Therefore it is of great interest to understand mechanisms that cause wave break in the heart. Break formation can be a result of anatomical heterogeneity zipes_sudden_1998 or dynamical instability. The most studied dynamical instability in cardiac tissue is “alternans” which can occur via various mechanisms garfinkel_eight_2007 . Alternans manifests in as a beat-to-beat alternation in the duration of action potentials (short-long-short), which grows in time and may result in wave break formation.
The heart’s contractions are governed by electrical waves of excitation. Conversely, its deformation affects the excitation processes of the cardiomyocytes, which is called “mechano-electrical feedback” (MEF). MEF has been shown to be able to cause, but also to abolish dangerous cardiac arrhythmias Kohl:99 . However, so far no dynamical instability which is caused by MEF has been identified yet. In this letter we report the finding of such a mechano-electrical dynamical instability (MEDI) in a model for human cardiac tissue.
Our method couples an ionic model for human epicardial myocytes TenTusscher:06 , with a discrete mechanical model for cardiac tissue Weise:11 , and a model for excitation-contraction coupling Niederer.bj06 ; Niederer.pbmb08 adjusted to human cardiac tissue keldermann_electromechanical_2010 . The propagation of nonlinear waves of electrical excitation in cardiac tissue is modeled via a reaction-diffusion equation for the transmembrane potential
| (1) |
with membrane capacitance density and diffusivity . At boundaries of the medium no-flux boundary conditions are used (). The transmembrane ion current is modeled by various time- and voltage-dependent ion channels HH4:52 . The finite difference mesh for the explicit Euler integration (space step and time step ) of Eq.(1) is coupled to a square lattice of mass points connected with springs (see Figure in weise_discrete_2013 ). Excitation waves trigger a contraction of the tissue weise_discrete_2013 . To solve the mechanical model we assumed elastostatics, and used Verlet integration Verlet:67 . To model MEF we use a linear, time-independent model for stretch-activated currents
| (2) |
where is a measure for local dilatation: strain in one-dimensional (1D) simulations, and square root of the relative area change of a quadrilateral formed by direct neighboring mass points (see Figure in weise_discrete_2013 ) in two-dimensional (2D) simulations. Parameter is maximal normalized sarcomere length which we chose as as in keldermann_electromechanical_2010 . is the maximal conductance, the reversal potential of the stretch activated channels. was measured in a range from to kohl_stretch-induced_1999 ; Skouibine.mb00 . We set . We vary in the reported range from to Kohl:99 ; Kohl.cjc98 . Following similar studies PhysRevLett.108.228104 ; PanfKeldNash:05 ; Panfilov.pnas07 we fixed the boundaries of the model to mimic isovolumic phases of the cardiac cycle. Our 2D model relates to a thin slice of cardiac tissue with fixed boundaries. For 1D simulations we assumed a constantly stretched cable () and vary in Eq.(2).
Figure 1 and supplemental movie 111LINK TO SUPPLEMENTAL MOVIE shows development of MEDI under periodic stimulation of cardiac tissue.
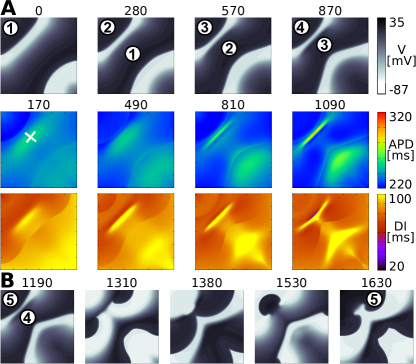
First, we stimulate the tissue with a constant period of and observe stable wave propagation. However, when we decrease the stimulation period to , we see development of MEDI. In Figure 1A, top we show wave front-back collisions before wave break happens (compare supplemental movies 222LINK TO SUPPLEMENTAL MOVIE and figure 333LINK TO SUPPLEMENTAL FIGURE). We see next, that at this location APD 444APD and DI are recorded at gradually increases, while DI decreases (Figure 1A), until wave break occurs evolving to two counter-rotating spiral waves (Figure 1B). Note also, that in contrast to alternans instability MEDI occurs for longer stimulation periods than classical APD alternans TenTusscher:06 , and does not involve alternations between long and short action potentials.
How robust is MEDI against the change of model parameters? To answer this question we used the setup shown in Figure 1; however, slowly decreased the period of stimulation for different . We show the results in Figure 2.
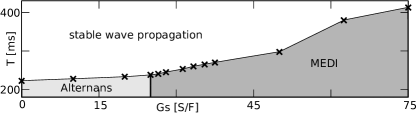
We see from Figure 2 that MEDI occurs in a large parametric space of and period of stimulation .
We will now explain the mechanism of MEDI. First, we need to explain what causes wave front-back collisions. We reported in PhysRevLett.119.108101 that external dynamic stretching of cardiac tissue causes acceleration of a wave front and promotes wave front-back collision. Here we have a similar situation; however, the stretch is not caused by an external mechanical load, but the contraction is caused by the excitation wave itself. The mechanism is the same: stretch causes which accelerates the wave front causing wave front-back collision.
However, why does the APD at the collision position grow from wave to wave (see Figure 1A)? This is counter-intuitive, because classical restitution theory predicts that collision (short DI) should produce shorter APD. However, classical restitution theory cannot be applied here as the collision is a non-stationary spatio-temporal process which cannot be reproduced by a periodic stimulation of cardiac cell. Here one needs to consider the interaction of the wavefront with the waveback of the preceeding wave 555compare APD vs. DI plot for dynamic restitution protocol and collisions LINK TO SI.
To systematically study wave front-back collisions we developed a special electrophysiological setup. In this setup we use a moving obstacle in a cable to control the velocity of a first wave (S1) (see also Figure 3 in PhysRevLett.119.108101 ), and initiate a wave train (see Figure 3). To study the effect of MEF we assume the fiber to be constantly stretched to , thus . By changing the velocity of the moving obstacle we can systematically vary the degree of wave front-back interaction during collision.
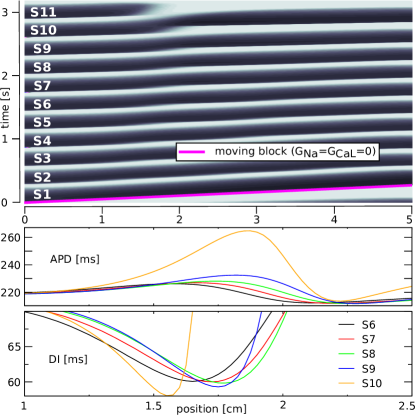
We can see that we can reproduce the observed MEDI in this setup by choosing a corresponding value of the forced velocity (Figure 3). In particular, for forced velocity of we see collisions of successive waves, gradual increase in APD (Figure 3B) and gradual decrease of the DI at the collision position (Figure 3C). This process closely resembles the instability in the 2D system (compare Figure 3 and Figure 1).
We performed additional simulations to systematically study front-tail interactions by letting two waves (S1 and S2) collide for different velocities of the moving obstacle. Figure 4 shows wave characteristics at the collision point, i.e. when SI between S1 and S2 is minimal. Note, that this point has a different location for different forced CV. We see from Figure 4A that, as expected, lower forced CV results in closer front-tail interaction (DI decreases). However, we also see that such decrease in DI results in unexpected increase in APD which is counter to normal APD restitution, where shorter DI results in shorter APD. Such abnormal dependency, can, in our view, explain the observed MEDI. Indeed, for periodic forcing with a period T, DI=T-APD, thus increase in APD will result in decrease in DI. However, if decrease in DI will produce longer APD, as in the case of Fig. 4A this longer APD will produce shorter DI and will further increase APD and thus result in its gradual growth, what we see in Figure 1 and Figure 3.
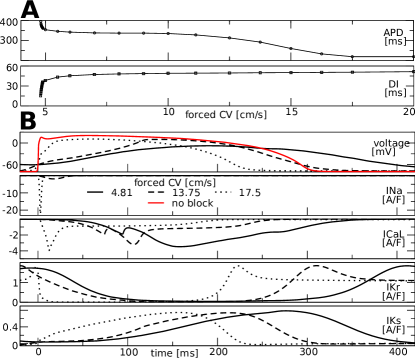
How does this “abnormal´´ APD(DI) dependency emerge? We find that it is related to the phenomenon “biexcitability”. Under special conditions vandersickel_study_2014 ; chang_bi-stable_2012 bistable wave propagation can occur in the same tissue. One type is fast propagation: characterized by a rapid sodium-driven upstroke (INa) happening from the repolarized transmembrane potential, and the other is a slow propagation where the upstroke is driven by L-type calcium current (ICaL) from a depolarized potential when sodium channels are mostly inactivated due to accommodation qu_mechanisms_2015 . We found earlier in the moving obstacle setup, that causes biexcitability of the S2 wave which manifests in its oscillation between sodium- (when S2 is distant from the S1 wave back) and calcium-driven upstroke (during wave front-back collision) PhysRevLett.119.108101 . Here we find that such a transition of wave front propagation substantially affects APD. We can see (Figure 4B) that for a forced CV of , where APD is the upstroke of the action potential is steep, and driven by sodium current (dotted lines). However, for slower forced CV (straight and dashed lines) we can see that the slope of the action potential becomes shallow, sodium current is absent, and L-calcium current is the main depolarizing current. The action potentials are also substantially longer, for forced CV of , and for forced CV of . We can explain the APD elongation by a combination of the longer transient of the calcium current, and a delay of the repolarizing currents IKs and IKr for slower forced CV happening as a consequence of the change of the propagation type (Figure 4B lower panels). We studied the importance of ICaL for the mechanism. In the setup of Figure 3 we found that wavebreaks due to MEDI occur for forced velocities . However, if we block ICaL we did not observe MEDI; we could either see stable wave propagation (forced CV ) or immediate block of S2 (forced CV ), and no MEDI. Thus we can conclude that ICaL and related to it biexcitability is a key part of MEDI.
Overall we can explain the mechanism of MEDI as follows: MEF due to stretch-activated currents increases the local velocity of the wavefront which causes wave front-back collisions. A wave front-back collision results in short DI, which however causes longer APDs at the collision regions due to biexcitability. Elongation of APD further decreases DI in the collision region which further increases APD. This positive feedback results in wave by wave increase of APD until the wave front dissipates.
How relevant is this mechanism for cardiac arrhythmias? We showed in Figures 1, 2 that MEDI can lead to wave break and creation of spiral waves in the heart. Therefore MEDI may be relevant for the onset of cardiac arrhythmia. Does MEDI also destabilize spiral waves? We also studied what effect MEDI has on spiral wave dynamics. We show the results in Figure 5.
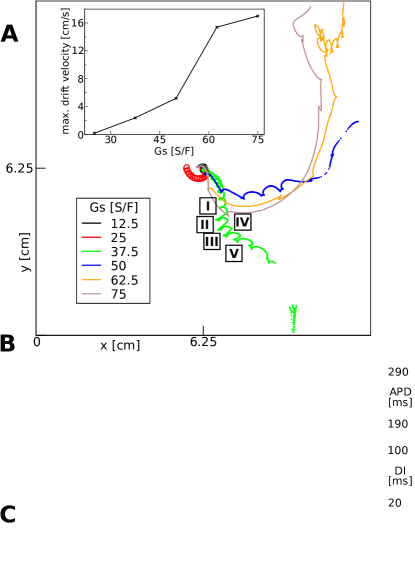
We see that for the spiral wave has a circular core which is the same as dynamics in absence of MEF. However, for MEF causes meandering of the spiral wave on a cycloidal trajectory. This onset of meander can be explained by the resonant drift theory Gril:95 which predicts meandering under a periodical variation of the excitability of the medium, which occurs here due to MEF Panfilov.pnas07 ; dierckx_theory_2015 . However, for larger values of we observe a hyper-meandering trajectory (see the orange line). Such hyper-meandering has substantial consequences for the type of arrhythmia, as it induces polymorphic ventricular tachycardia gray_nonstationary_1995 . We found that the maximal induced drift velocity is approximately one third of the wave velocity (see inset in subfigure 5A, wave velocity is ca. ) which is too slow to cause ECG patterns similar to ventricular fibrillation Gray:95b .
We found that the rapid spiral drift is caused by MEDI. We illustrate it in Figure 5 for the spiral core trajectory (green line), where we show collisions I–V. In subfigure 5B we show that MEDI occurs. Similar to Figure 1A we see that APD gradually increases (see collisions I–III in subfigure 5B). We also see that it causes wave block close to the spiral wave tip which does not result in full spiral breakup. We observe that the spiral core drifts along the “collision line” (region where DI is minimal and APD maximal). We indicate the “drift vector” in subfigure 5B,V as an arrow.
In this letter we reported on our finding of a novel dynamical instability “MEDI” for excitation waves in cardiac tissue. MEDI emerges as a consequence of MEF and causes the formation and hypermeandering of spiral waves. These phenomena are relevant for the onset of cardiac arrhythmias. MEDI causes wave break in a large range of conductivities of stretch-activated channels and stimulation periods. MEDI can occur for longer stimulation periods than the alternans instability.
It is difficult to formulate an analytical theory for MEDI. This is, because it emerges from the interplay of the complex phenomena CV and biexcitability that themself depend on the interplay of wave propagation and MEF. To explain the mechanism we studied the wave by wave increase of APD in a simplified 1D setup (Figure 4), in which we disabled the electromechanical coupling. However, in the full model it is more complex, as APD affects also the spatiotemporal strain distribution in the medium, and thus affects CV. We see no easy way to analytically reduce the complexity of this spatiotemporal problem.
We studied MEDI in a simplified 2D model for cardiac tissue. As a next step it may be interesting to investigate the novel mechanism in more detailed three-dimensional electromechanical models for the human heart trayanova_electromechanical_2011 ; keldermann_electromechanical_2010 . For example, it is important to test if the novel instability can cause a breakup of vortices, as this is a key mechanism for sudden cardiac death. It may be possible to experimentally study MEDI, for example by using ultrasound-based strain imaging christoph_electromechanical_2018 in animal models. It can also be interesting to design experiments similar to our forced CV setup (compare Figure 4) using the optogenetics approach magome_photo-control_2011 .
Acknowledgements: L.D.W. thanks the Deutsche Forschungsgemeinschaft for a research fellowship (Grant No. WE 5519/1-1). We thank Dr. Vadim Biktashev, Dr. Jan Kucera Dr. Hans Dierckx and Dr. Ivan Kazbanov for valuable discussions. We thank Dr. Paul Baron for critical comments on the manuscript.
References
- (1) M. A. Allessie, F. I. M. Bonke, and F. J. G. Schopman, Circ. Res. 39, 168 (1976).
- (2) G. Gerisch, Wilhelm Roux’ Archiv für Entwicklungsmechanik der Organismen 156, 127 (1965).
- (3) K. Agladze and O. Steinbock, The Journal of Physical Chemistry A 104, 9816 (2000).
- (4) B. P. Belousov, Collection of short papers on radiation medicine for 1958 (Med. Publ., Moscow, 1959), pp. 145–147, in Russian.
- (5) A. Zaikin and A. Zhabotinsky, Nature 225, 535 (1970).
- (6) A. Winfree and S. Strogatz, Nature 311, 611 (1984).
- (7) D. P. Zipes and H. J. J. Wellens, Circulation 98, 2334 (1998), 01659.
- (8) A. Garfinkel, Journal of electrocardiology 40, S70 (2007).
- (9) P. Kohl, P. Hunter, and D. Noble, Prog. Biophys. Molec. Biol. 71, 91 (1999).
- (10) K. Ten Tusscher and A. Panfilov, Am. J. Physiol. Heart Circ. Physiol. 291, H1088 (2006).
- (11) L. D. Weise, M. P. Nash, and A. V. Panfilov, PLoS ONE 6(7), e21934 (2011).
- (12) S. Niederer, P. Hunter, and N. Smith, Biophys. J. 90, 1697 (2006).
- (13) S. Niederer and N. Smith, Prog. Biophys. Mol. Biol. 96, 90 (2008).
- (14) R. H. Keldermann et al., Am J Physiol Heart Circ Physiol 299, H134 (2010).
- (15) A. Hodgkin and A. Huxley, J. Physiol. 117, 500 (1952).
- (16) L. D. Weise and A. V. Panfilov, PLoS ONE 8, e59317 (2013).
- (17) L. Verlet, Phys. Rev. 159, 98 (1967).
- (18) P. Kohl, P. Hunter, and D. Noble, Progress in Biophysics and Molecular Biology 71, 91 (1999).
- (19) K. Skouibine, N. Trayanova, and P. Moore, Math. Biosci. 166, 85 (2000).
- (20) P. Kohl, K. Day, and D. Noble, Can. J. Cardiol. 14, 111 (1998).
- (21) L. D. Weise and A. V. Panfilov, Phys. Rev. Lett. 108, 228104 (2012).
- (22) A. Panfilov, R. Keldermann, and M. Nash, Phys. Rev. Lett. 95, 258104 (2005).
- (23) A. Panfilov, R. Keldermann, and M. Nash, Proc. Natl. Acad. Sci. U.S.A. 104, 7922 (2007).
- (24) L. D. Weise and A. V. Panfilov, Phys. Rev. Lett. 119, 108101 (2017).
- (25) N. Vandersickel et al., PloS One 9, e84595 (2014).
- (26) M. G. Chang et al., Heart Rhythm: The Official Journal of the Heart Rhythm Society 9, 115 (2012).
- (27) Z. Qu and J. N. Weiss, Annual Review of Physiology 77, 29 (2015).
- (28) S. Grill, V. Zykov, and S. Müller, Phys. Rev. Lett. 75, 3368 (1995).
- (29) H. Dierckx et al., New Journal of Physics 17, 043055 (2015).
- (30) R. A. Gray et al., Circulation 91, 2454 (1995).
- (31) R. Gray et al., Science 270, 1222 (1995).
- (32) N. A. Trayanova, J. Constantino, and V. Gurev, American journal of physiology. Heart and circulatory physiology 301, H279 (2011).
- (33) J. Christoph et al., Nature 555, 667 (2018).
- (34) N. Magome et al., Tissue Engineering Part A 17, 2703 (2011).