Detachment of fluid membrane from substrate and vesiculations
Abstract
The detachment dynamics of a fluid membrane with an isotropic spontaneous curvature from a flat substrate are studied by using meshless membrane simulations. The membrane is detached from an open edge leading to vesicle formation. With strong adhesion, the competition between the bending and adhesion energies determines the minimum value of the spontaneous curvature for the detachment. In contrast, with weak adhesion, a detachment occurs at smaller spontaneous curvatures due to the membrane thermal undulation. When parts of the membrane are pinned on the substrate, the detachment becomes slower and a remained membrane patch forms straight or concave membrane edges. The edge undulation induces vesiculation of long strips and disk-shaped patches. Therefore, membrane rolling is obtained only for membrane strips shorter than the wavelength for deformation into unduloid. This suggests that the rolling observed for Ca2+-dependent membrane-binding proteins, annexins A3, A4, A5, and A13, results from by the anisotropic spontaneous curvature induced by the proteins.
I Introduction
Lipid membranes supported on a solid substrate are considered as a model system for biological membranes and are extensively used to study immune reaction and protein functions as well as membrane properties Tanaka and Sackmann (2005); Castellana and Cremer (2006); Achalkumar et al. (2010); Alessandrini and Facci (2014); van Weerd et al. (2015). Membranes are placed on a solid or polymer layer, and a wide range of the surface-specific analytical techniques can be applied.
The adhesion of vesicles onto a substrate is a typical method for producing supported membranes. For the establishment of this method, the adhesion process has been investigated intensively by experiments Johnson et al. (2002); Cha et al. (2006); Hain et al. (2003); Mapar et al. (2018) and coarse-grained molecular simulations Fuhrmans and Müller (2013); Kong et al. (2016); Wen et al. (2017). A vesicle adheres to the substrate, and the resultant high surface tension induces membrane rupture, leading to membrane spreading on the substrate. Moreover, the adhesion of bicelles can result in the formation of supported membranes Kolahdouzan et al. (2017); Yamada et al. (2018).
The opposite process, namely detachment, has been the subject of few studies. However, Boye et al. very recently reported that the annexin proteins can detach lipid membranes from a substrate Boye et al. (2017, 2018). Various types of detachment dynamics were observed. The annexins are Ca2+-dependent membrane-binding proteins and have functions in endo/exocytosis and membrane repair Gerke et al. (2005); Bouter et al. (2015); Blazek et al. (2015). The annexins A3, A4, A5, and A13 induce membrane rolling from open edges. In particular, thick rolls are grown with A4 and A5, while thin branched rolls are formed with A3 and A13. The annexins A1 and A2 induce membrane blebbing and folding. The bleb exhibits a spherical shape and remains still connected to the membrane patch. Moreover, the relation between the observed rolling and the membrane repair has been discussed in Ref. 15.
Herein, the detachment dynamics of membrane patches from a flat substrate is studied by using meshless membrane simulations. Since the annexins induce the rolling and blebbing, they almost certainly bends the bound membrane. The folding indicates that the annexins A1 and A2 also bind two membranes. Furthermore, the protein–protein interaction is also important. When the trimer formation of the annexins A4 is inhibited, the membrane rolling does not occur Boye et al. (2017). Annexins A5 forms a two-dimensional ordered array on the membrane Bouter et al. (2015, 2011), so that it may effectively solidify the membrane. Thus, the annexins definitely play various roles in the membrane detachment. However, in this study, the isotropic spontaneous curvature is considered as the minimum role, since the membrane bending is required for the detachment. Certain proteins, such as the Bin/Amphiphysin/Rvs (BAR) superfamily proteins, are known to bend along the domain; that is, induce anisotropic spontaneous curvature McMahon and Gallop (2005); Suetsugu et al. (2014); Simunovic et al. (2015); Johannes et al. (2015). However, to our knowledge, experimental evidence of the annexins bending the membrane anisotropically has not yet been reported. Herein, the different types of detachment dynamics occurring on a membrane with the isotropic spontaneous curvatures are studied by means of simulation. The isotropic spontaneous curvature can also be induced by the polymer anchoring and colloid adhesion Phillips et al. (2009); Lipowsky (2013); Dasgupta et al. (2017). Moreover, the pinning effects on the membrane detachment are investigated. In experiments, parts of the membrane patch are often pinned in the original position. Finally, the additional requirements for obtaining different types of dynamics are discussed.
The simulation model and method are described in Sec. II. Various types of membrane models have been developed for membrane simulations Müller et al. (2006); Venturoli et al. (2006); Noguchi (2009). In this study, a spin type of the meshless membrane models is used, in which membrane particles self-assemble into a membrane Shiba and Noguchi (2011). This model was previously applied to membranes with an isotropic spontaneous curvature Noguchi (2016a, 2019a) or anisotropic spontaneous curvature Noguchi (2014, 2016b); Noguchi and Fournier (2017); Noguchi (2019b), as well as their mixture Noguchi (2017). One can efficiently simulate membrane deformation with membrane fusion and fission in a wide range of membrane elastic parameters. The simulation results of the membrane detachment without and with pinning are described in Secs. III and IV, respectively. Finally, Sec. V presents a summary and discussion of this study.
II Simulation model and method
A fluid membrane is represented by a self-assembled one-layer sheet of particles. The position and orientational vectors of the -th particle are and , respectively. Since the details of the meshless membrane model are described at length in Ref. 31, it is only briefly presented here.
The membrane particles interact with each other via the potential . The potential is an excluded volume interaction with a diameter for all particle pairs. The solvent is implicitly accounted for by an effective attractive potential as follows:
| (1) |
where , is a constant, is the thermal energy, and is the characteristic density with . is a cutoff function and with :
| (2) |
where , , , and . For low densities, is a pairwise attractive potential, while the attraction is smoothly truncated at . The bending and tilt potentials are given by
| (3) | |||||
| (4) |
where and is a weight function.
The membrane elastic properties for a wide range of parameter sets are provided in Refs. 31 and 33. We employ typical values of membrane properties in lipid membranes in this study. The spontaneous curvature of the membrane is determined by in Eq. (3). To detach the membrane, negative values of the spontaneous curvature are used and the amplitude of the negative spontaneous curvature is given by . The bending rigidity is linearly dependent on and but independent of for . On the other hand, the line tension of the membrane edge is linearly dependent on but independent of and . Therefore, these two quantities are controlled individually. Here, we fix the ratio as : , , and for , , and at , respectively. The edge tension , , , and for , , , and at , respectively. Experimentally, the edge tension is estimated from the membrane pore formation: –pN. Zhelev and Needham (1993); Karatekin et al. (2003); Portet and Dimova (2010) When the particle diameter is considered as membrane thickness, nm, pN. Unless otherwise specified, is used in this study. The ratio of the Gaussian modulus to is constant Noguchi (2019a): . The area per particle in the tensionless membranes is slightly dependent on as follows: with , , and for , , and at , respectively.
The solid substrate is set to and interacts with the membrane particles via the Lennard-Jones potential:
| (5) |
which has an energy minimum at with a depth of . The membrane is initially equilibrated at . Further, is transformed to a target value at . Membrane disks are simulated for and with radii of and , respectively, at , , and . The limit of a large membrane disk, namely a membrane strip, is also simulated, in which the membrane is connected to itself by the periodic boundary condition on the axis. The strip length is with unless otherwise specified.
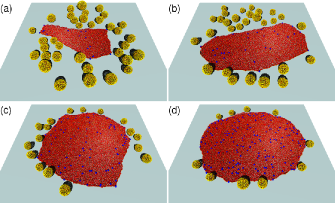
To study the pinning effects, membrane particles are fixed in the initial position at , , and . The detachment dynamics are simulated at , , , and , that is, the density of the pinned particle, , , , and . The pinned particles are randomly selected for each simulation run. Since the pinned particles are often separated from the membrane during the detachment at the smaller attraction of for , this attraction strength is selected.
Molecular dynamics with a Langevin thermostat is employed Shiba and Noguchi (2011); Noguchi (2011). The numerical errors of the phase boundaries and time evolution are estimated from and independent runs, respectively. In the following sections, the results are displayed with the diameter of membrane particles as the length unit and as the time unit, where is the diffusion coefficient of isolated membrane particles.
III Detachment of Fluid Membrane without Pinning
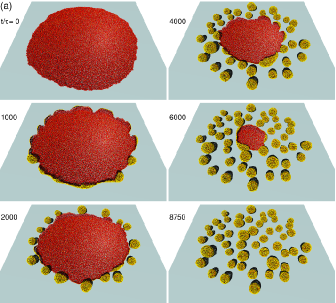
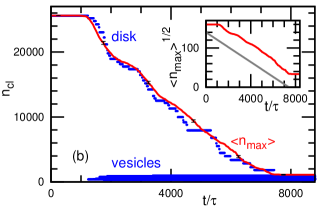
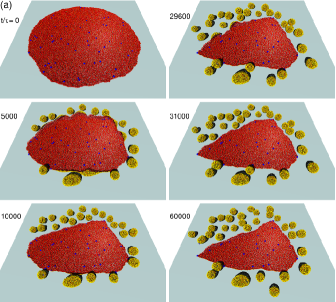
First, the detachment of a homogeneous fluid membrane with a spontaneous curvature is considered. The membrane has a constant isotropic spontaneous curvature, and all membrane particles are mobile. When a high curvature is imposed, a membrane disk is detached from the substrate, and vesicles are formed [see Fig. 1(a) and Movie S1 provided in ESI]. The membrane edge is rolled up, and the edge undulation expands leading to the vesicle formation. Under this condition, the average vesicle size is , which is several times larger than the minimum vesicle size formed by the membrane closure of a cup-shaped membrane patch. The membrane sizes of transition and spinodal decomposition are for the cup-to-vesicle transition Noguchi (2019a). During the division into small vesicles, the edge length increases temporally [see the middle-left snapshot in Fig. 1(a)]. This differs from the cup-to-vesicle transition, in which the edge length decreases monotonically.
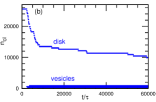
The time evolution of the clusters is shown in Fig. 1(b). When membrane particles are closer than , it is considered that they belong to the same cluster. Since several vesicles are simultaneously formed along the membrane edge [see the snapshot at in Fig. 1(a)], a stepwise decrease in the size of the maximum cluster (membrane disk) appears. On average, the maximum cluster size decreases as
| (6) |
as shown in the inset of Fig. 1(b). This is due to the edge length decrease as . The size approximately decreases as so that Eq. (6) is obtained. A similar decrease was obtained during membrane lysis, when the membrane dissolution occurs only from the membrane edge Noguchi and Gompper (2006).
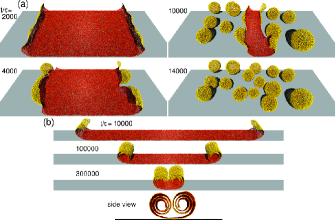
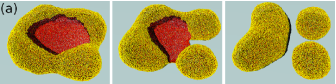
These vesiculation dynamics are not qualitatively modified for long membrane strips and small membrane disks of . The membrane strip is simulated to investigate the straight edge as the limit of the large membrane disk. At , the bent edges begin to undulate and vesicles are formed at [see Fig. 2(a) and Movie S2 provided in ESI]. However, a rolled membrane is formed on a short strip of [see Fig. 2(b) and Movie S3 provided in ESI]. At , the membrane edge undulates into two or three bumps [see the snapshot at in Fig. 2(a)], and typically each bump grows into one vesicle. This edge undulation is suppressed at . Although various conditions are examined, this rolling is obtained only for the short strips. Thus, the straight free edges are always unstabilized for the longer strips. This roll unstabilization is caused by the formation of an unduloid-shaped membrane, which periodically undulates along the rotational axis and exhibits a constant mean curvature Kenmotsu (2003); Naito et al. (1995). The cylinder with a radius of can be continuously transformed into unduloids by maintaining the mean curvature, and the transformation begins at a wavelength of . Hence, the unduloid formation is suppressed for strips that are sufficiently shorter than . This threshold length agrees with the simulation results, since at . A similar instability of a tubular lipid vesicle was observed in polymer anchoring Tsafrir et al. (2001).
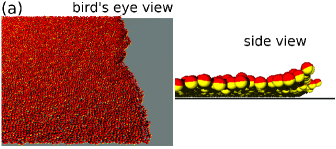
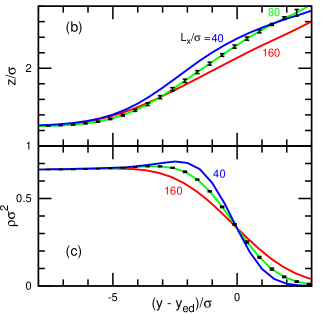
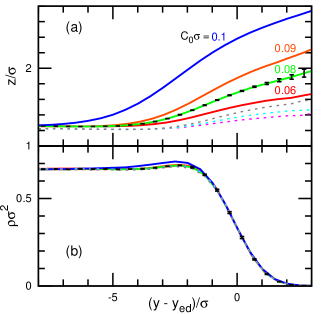
At a small , the membrane remains on the substrate. The edges are slightly separated from the substrate and fluctuate along the edge ( axis) as shown in Fig. 3(a). To quantitatively evaluate the edge shape, the membrane height profile perpendicular to the edge is calculated and presented in Figs. 3(b) and 4(a). The edge position is defined as at the position in which the density is half of that of the middle membrane region. Since the edge position fluctuates along the axis, the changes in the density and height become more gradual for longer strips [see Figs. 3(b) and (c)]. As increases or decreases, the edge exhibits greater bending [see Fig. 4(a)]. It is noted that the height profile at can be significantly modified by the selection of the averaging methods. At , the slopes of the height profiles decrease as indicated in Fig. 4(a), because the average is taken along the axis. When the average is taken for the axis as , the profile bends upwards. A similar axis dependence is obtained for the profile of cup-shaped membrane patches Noguchi (2019a).
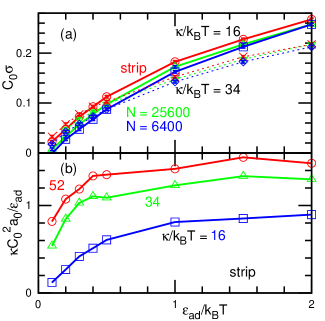
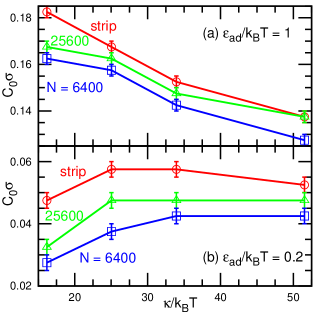
The boundary of the membrane detachment is shown in Figs. 5, 6, and 7. Above or below the boundary curves, the membranes are detached or remained on the substrate, respectively. As expected, a higher curvature is required for the detachment from a stronger adhesion (a greater ). As pointed out in Ref. 16, it is attributed to the competition between the bending energy and adhesion energy per unit membrane area. To examine this relation, the boundary is normalized as in Fig. 5(b). When the adhesion is stronger than the thermal fluctuations (), the plots exhibit approximately constant values, so that the detachment boundary can be determined by the ratio of the bending and adhesion energies. However, for weaker adhesions, the detachment occurs at a smaller , where the thermal fluctuations are not negligible. As the bending rigidity increases, the detachment curvature decreases at [see Fig. 6(a)]. However, interestingly, it increases for at [see Fig. 6(b)]. The thermal membrane undulation is suppressed by the high bending rigidity. Thus, under the weak-adhesion condition, the membrane is detached when the thermal undulation overcomes the adhesion.
The detachment curvature is independent of the edge tension, , for the membrane strips, because the edge length does not vary during the initial detachment process. For a small disk with , the detachment curvature increases slightly with increasing as shown as a solid line in Fig. 7(b), where the edge length decreases during the detachment. Due to this effect, smaller membrane patches exhibit lower detachment curvatures [see Figs. 5(a) and 6].
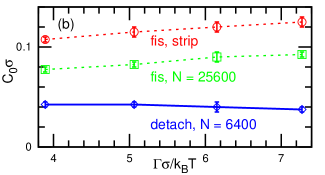
It should be noted that the membrane fission into vesicles is slightly suppressed by an increase in as indicated by dashed lines in Fig. 7(b). Above the boundary curves, the multiple vesicles are formed as shown in Fig. 7(a). Between the detachment and fission curves, the membrane patch closes into a single vesicle. The vesicle size resulted in the fission increases with increasing . The mean vesicle size is , , and for , , and , respectively, under the conditions of Fig. 1. The high edge tension accelerates the membrane closure and suppresses an increase in the edge line length for the fission. This is opposite to the case of a cup-to-vesicle transition, in which the high edge tension reduces the membrane sizes for the vesicle closure Noguchi (2019a).
In the case that the substrate is removed at , the formation of one and multiple vesicles similarly occurs at low and high spontaneous curvatures, respectively. Experimentally, vesicles can be produced by the hydration of dry lipid films Reeves and Dowben (1969); Yamada et al. (2007). If one side of the membrane is fabricated to induce a spontaneous curvature by mean of polymer anchoring and so on, the fission of a detached membrane patch can lead to the formation of small vesicles.
IV Detachment of Pinned Membrane
Next, we describe the pinning effects on the detachment. Figures 8 and 9 show the detachment dynamics of the pinned membrane patches at . When the membrane edge approaches a pinned particle, it locally suppresses the detachment [see Fig. 8 and Movie S4 provided in ESI]. As the membrane edges become trapped by the pinned particles, the patch adopts a polygonal shape and the pinned particles are located at the vertices. Occasionally, vesicles are still formed under fluctuations of the excess membrane area [see Fig. 8]. The mean vesicle size becomes slightly smaller than the unpinned membranes.
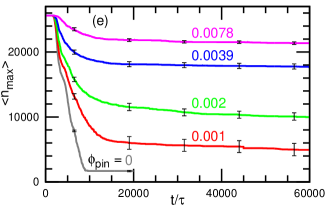
As the pin density, , increases, larger membrane patches remain on the substrate [see Fig. 9]. At the low densities of and , the remaining membrane area varies significantly: the entire membrane is detached in out of runs at . At , more than half of the membrane area still adheres to the substrate. Thus, a small amount (less than %) of pinning can significantly suppress the membrane detachment.
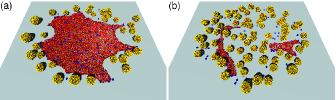
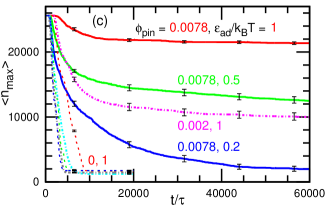
Next, the effects of the adhesion strength is investigated as shown in Fig. 10. As decreases, the detachment becomes faster and the whole membrane can be detached for the low density . Several pins are separated from the membrane, since stronger force can be exerted to a pinned particle for smaller . Interestingly, the membrane patch can form concave edges as well as straight edges [see Fig. 10(a) and (b)]. Similar concave edges were observed in the experiments Boye et al. (2017, 2018). The edges are bent and more membrane region is detached from the substrate. The detachment boundary is at . Hence, the simulation condition, , is close to the boundary and becomes more distant with decreasing . In such far-from-equilibrium conditions, the membrane can be detached further even from the concave edge.
V Summary and Discussion
The detachment dynamics of membrane patches from a flat substrate were simulated. As the spontaneous curvature increases, the membrane edge bends upwards more significantly. When is higher than the threshold value, the membrane is detached from the edge and forms vesicles. The threshold curvature is for the strong-adhesion conditions but decreases for the weak-adhesion conditions. For small membrane patches, this curvature slightly decreases with an increase in the edge line tension. The pinning of the membranes onto the substrate locally suppresses the membrane detachment and straight or concave membrane edges are formed between the pinned points.
Boyes’ experiments Boye et al. (2017, 2018) showed several types of detachment dynamics. The membrane blebbing induced by the annexins A1 and A2 is similar to the initial process of the vesicle formation. However, the membrane pinching-off into a vesicle is prevented. It is likely that the binding of two neighboring membranes stabilizes the neck of the bleb by means of the annexins. Thus, we consider that the annexins A1 and A2 engender isotropic spontaneous curvature of the membrane and also cause the binding of two membranes. They observed the membrane rolling for four types of the annexins (A3, A4, A5, and A13). We obtained the rolling only for strips shorter than the wavelength of the unduloid deformation, . Hence, we conclude that the isotropic spontaneous curvature cannot induce the membrane rolling, and these annexins presumably induce the anisotropic spontaneous curvature. Moreover, membrane solidification is also a possible cause of the rolling for the annexins A5, since these form an ordered assembly on the membrane. Solid membranes cannot form vesicles. It is noted that an ordered solid membrane can exhibit anisotropic spontaneous curvature but it is not orthogonal, e͡.g., , , can be preferred direction to bend for a hexagonal lattice. If these proteins have the binding ability of the neighboring membranes, the membrane binding reinforces the roll structure. In their experiments, the concave edges are often formed. In our simulations, concave membrane edges are obtained in the pinned membranes under the weak substrate adhesion. Therefore, the pinning plays an essential role to form concave edges.
In this study, the Langevin dynamics is employed so that the hydrodynamic interactions are neglected. The membrane detachment is a normal motion to the membrane while the vesiculation is also accompanied by the tangential motion. When the hydrodynamic interactions are taken into account, the tangential motion becomes relatively slower as the membrane viscosity increases compared to the solvent viscosity Nakagawa and Noguchi (2018). Thus, it is expected that the vesiculation occurs later for higher membrane viscosity.
Our study has demonstrated that the membrane detachment from the substrate can lead to the formation of numerous vesicles. The size of the obtained vesicles is several times greater than that of the vesicle formation via self-assembly of small membrane patches. Moreover, the dependence on the edge tension is the opposite: at a higher edge tension, larger and smaller vesicles are formed for the membrane detachment and assembly, respectively. Thus, the final vesicle size is controlled kinetically as well as thermostatically. The resultant membrane structure can be altered by the anisotropy of the spontaneous curvature and the binding of neighboring membranes. Our study provides basic knowledge for an improved understanding of the membrane detachment dynamics including such conditions.
Acknowledgements.
We thank Olivier Pierre-Louis (Univ. Lyon 1) for stimulating discussion and acknowledge the visiting professorship program of University of Lyon 1. This work was supported by JSPS KAKENHI Grant Number JP17K05607.References
- Tanaka and Sackmann (2005) M. Tanaka and E. Sackmann, Nature 437, 656 (2005).
- Castellana and Cremer (2006) E. T. Castellana and P. S. Cremer, Surf. Sci. Rep. 61, 429 (2006).
- Achalkumar et al. (2010) A. S. Achalkumar, R. J. Bushby, and S. D. Evans, Soft Matter 6, 6036 (2010).
- Alessandrini and Facci (2014) A. Alessandrini and P. Facci, Soft Matter 10, 7145 (2014).
- van Weerd et al. (2015) J. van Weerd, M. Karperien, and P. Jonkheijm, Adv. Healthcare Mater. 4, 2743 (2015).
- Johnson et al. (2002) J. M. Johnson, T. Ha, S. Chu, and S. G. Boxer, Biophys. J. 8, 3371 (2002).
- Cha et al. (2006) T. W. Cha, A. Guo, and X.-Y. Zhu, Biophys. J. 90, 1270 (2006).
- Hain et al. (2003) N. Hain, M. Gallego, and I. Reviakine, Langmuir 29, 2282 (2003).
- Mapar et al. (2018) M. Mapar, S. Jõemetsa, H. Pace, V. P. Zhdanov, B. Agnarsson, and F. Höök, J. Phys. Chem. Lett. 9, 5143 (2018).
- Fuhrmans and Müller (2013) M. Fuhrmans and M. Müller, Langmuir 29, 4335 (2013).
- Kong et al. (2016) X. Kong, D. Lu, J. Wu, and Z. Liu, Langmuir 32, 3785 (2016).
- Wen et al. (2017) C. Wen, M. Wan, X. Li, Q. He, L. Gao, and W. Fang, ACS Omega 2, 910 (2017).
- Kolahdouzan et al. (2017) K. Kolahdouzan, J. A. Jackman, B. K. Yoon, M. C. Kim, M. S. Johal, and N.-J. Cho, Langmuir 33, 5052 (2017).
- Yamada et al. (2018) N. L. Yamada, M. Sferrazza, and S. Fujinami, Physica B 551, 222 (2018).
- Boye et al. (2017) T. L. Boye, K. Maeda, W. Pezeshkian, S. L. Sønder, S. C. Haeger, V. Gerke, A. C. Simonsen, and J. Nylandsted, Nature Comm. 8, 1623 (2017).
- Boye et al. (2018) T. L. Boye, J. C. Jeppesen, K. Maeda, W. Pezeshkian, V. Solovyeva, J. Nylandsted, and A. C. Simonsen, Sci. Rep. 8, 10309 (2018).
- Gerke et al. (2005) V. Gerke, C. E. Creutz, and S. E. Moss, Nature Rev. Mol. Cell Biol. 6, 449 (2005).
- Bouter et al. (2015) A. Bouter, R. Carmeille, C. Gounou, F. Bouvet, S. A. D. amd D. Evain-Brion, and A. R. Brisson, Placenta 36, S43 (2015).
- Blazek et al. (2015) A. D. Blazek, B. J. Paleo, and N. Weisleder, Physiol. 30, 438 (2015).
- Bouter et al. (2011) A. Bouter, C. Gounou, R. Bérat, S. Tan, B. Gallois, T. Granier, B. L. d’Estaintot, E. Pöschl, B. Brachvogel, and A. R. Brisson, Nature Comm. 2, 270 (2011).
- McMahon and Gallop (2005) H. T. McMahon and J. L. Gallop, Nature 438, 590 (2005).
- Suetsugu et al. (2014) S. Suetsugu, S. Kurisu, and T. Takenawa, Physiol. Rev. 94, 1219 (2014).
- Simunovic et al. (2015) M. Simunovic, G. A. Voth, A. Callan-Jones, and P. Bassereau, Trends Cell Biol. 25, 780 (2015).
- Johannes et al. (2015) L. Johannes, R. G. Parton, P. Bassereau, and S. Mayor, Nat. Rev. Mol. Cell. Biol. 16, 311 (2015).
- Phillips et al. (2009) R. Phillips, T. Ursell, P. Wiggins, and P. Sens, Nature 459, 379 (2009).
- Lipowsky (2013) R. Lipowsky, Faraday Discuss. 161, 305 (2013).
- Dasgupta et al. (2017) S. Dasgupta, T. Auth, and G. Gompper, J. Phys.: Codens. Matter 29, 373003 (2017).
- Müller et al. (2006) M. Müller, K. Katsov, and M. Schick, Phys. Rep. 434, 113 (2006).
- Venturoli et al. (2006) M. Venturoli, M. M. Sperotto, M. Kranenburg, and B. Smit, Phys. Rep. 437, 1 (2006).
- Noguchi (2009) H. Noguchi, J. Phys. Soc. Jpn. 78, 041007 (2009).
- Shiba and Noguchi (2011) H. Shiba and H. Noguchi, Phys. Rev. E 84, 031926 (2011).
- Noguchi (2016a) H. Noguchi, Phys. Rev. E 93, 052404 (2016a).
- Noguchi (2019a) H. Noguchi, J. Chem. Phys. 151, 094903 (2019a).
- Noguchi (2014) H. Noguchi, EPL 108, 48001 (2014).
- Noguchi (2016b) H. Noguchi, Sci. Rep. 6, 20935 (2016b).
- Noguchi and Fournier (2017) H. Noguchi and J.-B. Fournier, Soft Matter 13, 4099 (2017).
- Noguchi (2019b) H. Noguchi, Sci. Rep. 9, 11721 (2019b).
- Noguchi (2017) H. Noguchi, Soft Matter 13, 7771 (2017).
- Zhelev and Needham (1993) D. V. Zhelev and D. Needham, Biochim. Biophys. Acta 1147, 89 (1993).
- Karatekin et al. (2003) E. Karatekin, O. Sandre, H. Guitouni, N. Borghi, P. H. Puech, and F. Brochard-Wyart, Biophys. J. 84, 1734 (2003).
- Portet and Dimova (2010) T. Portet and R. Dimova, Biophys. J. 99, 3264 (2010).
- Noguchi (2011) H. Noguchi, J. Chem. Phys. 134, 055101 (2011).
- Noguchi and Gompper (2006) H. Noguchi and G. Gompper, J. Chem. Phys. 125, 164908 (2006).
- Kenmotsu (2003) K. Kenmotsu, Surfaces with constant mean curvature (American Mathematical Society, Providence, R.I., 2003).
- Naito et al. (1995) H. Naito, M. Okuda, and O.-Y. Zhong-can, Phys. Rev. Lett. 74, 4345 (1995).
- Tsafrir et al. (2001) I. Tsafrir, D. Sagi, T. Arzi, M.-A. Guedeau-Boudeville, V. Frette, D. Kandel, and J. Stavans, Phys. Rev. Lett. 86, 1138 (2001).
- Reeves and Dowben (1969) J. P. Reeves and R. M. Dowben, J. Cell. Physiol. 73, 49 (1969).
- Yamada et al. (2007) N. L. Yamada, M. Hishida, H. Seto, K. Tsumoto, and T. Yoshimura, EPL 80, 48002 (2007).
- Nakagawa and Noguchi (2018) K. M. Nakagawa and H. Noguchi, Soft Matter 14, 1397 (2018).