NGC 1261: A time-series VI study of its variable stars
Abstract
Time-series VI CCD photometry of the globular cluster NGC 1261 is employed to study its variable star population. A membership analysis of most variables based on Gaia DR2 proper motions and colours, was performed prior to the estimation of the mean cluster distance and metallicity. For the member RR Lyrae, their light curves were Fourier decomposed to calculate their individual values of distance, [Fe/H], radius and mass. The -band P-L for RR Lyrae stars was also employed. Our best estimates of the metallicity and distance of this Oo I cluster are [Fe/H]ZW= dex and kpc. No mixture of fundamental and first overtone RR Lyrae stars in the either-or or bimodal region is seen in this cluster, as it seems to be the rule for Oo I clusters with a red horizontal branch. A multi-approach search in a region of about 1010 arcmin2 around the cluster revealed no new variable stars within the limitations of our CCD photometry.
Empleamos una serie temporal de imágenes CCD en las bandas VI del cúmulo globular NGC 1261, para estudiar su población de estrellas variables. Se realizó un análisis de la membresía de las estrellas variables basado en movimientos propios y colores dados en Gaia DR2. Por medio de la descomposición de Fourier de curvas de luz de estrellas RR Lyrae, se obtuvieron sus valores individuales de distancia, [Fe/H], radio y masa. También utilizamos la relación P-L en la banda I para las RR Lyrae. Nuestras estimaciónes de la metalicidad y la distancia medias de NGC 1261, un cúmulo de tipo Oo I, son [Fe/H] dex y kpc. No se observa mezcla de modos de pulsación fundamental y primer sobre tono de RR Lyrae en la región bi-modal, como parece ser la norma para cúmulos de tipo OoI con rama horizontal roja. Una búsqueda cuidadosa en la región de centrada en el cúmulo no reveló nuevas variables, dentro de las limitaciones de nuestra fotometría.
globular clusters: individual: NGC 1261 \addkeywordstars: variables: RR Lyrae \addkeywordstars: fundamental parameters
0.1 Introduction
The southern globular cluster NGC 1261 (C0310554), also known as Caldwell 87, is located in the constellation Horologium (, = 12’ 58.4”, J2000, Goldsbury et al. (2010)). It was discovered by James Dunlop in 1826, and remained little studied until the mid-XXth century. It is a cluster of intermediate brightness, located far from the bulge of the Galaxy ( = 270.54∘, = 55.12∘) and, consequently, has negligible or no reddening. The Catalog of Parameters for Milky Way Globular Clusters compiled by Harris (1996) (2010 edition), lists a metallicity [Fe/H]=, a distance to the Sun of 16.4 kpc, the level of the Horizontal Branch (HB) as mag, and a reddening . The Catalogue of Variable Stars in Globular Clusters (CVSGC), (Clement et al., 2001) (2017 edition), lists 31 stars, although only 29 have been confirmed as variables: RR Lyrae stars (23), SX Phe (3), variable red giants or SR (2) and eclipsing binaries EC? (1). The members of the RR Lyrae population were first reported from photographic studies by Laborde & Fourcade (1966) later on by Bartolini et al. (1971), Wehlau & Demers (1977a), Wehlau et al. (1977b) and, more recently, in the CCD studies of Salinas et al. (2007) and Salinas et al. (2016), who discovered five RR Lyrae stars, three SX Phoenicis, one long period variable and an eclipsing binary of the W UMa type.
So far, the variable star population of NGC 1261 has not been studied with the specific aim of estimating some of the physical properties of the cluster, such as the mean metallicity, distance and age, by performing a detailed analysis of the light curves. Likewise, the distribution of variables in the HB has not been discussed, along with an analysis of individual membership. Studies of the distribution of RR Lyrae pulsation modes in the instability strip around the first overtone red edge (FORE), have shown that the modes are neatly splitted in all Oo II clusters with blue HB’s; however, this happens only in some of the Oo I type clusters with redder HB’s (e. g. Arellano Ferro et al. (2018b)). It has been argued that this property is related to the distribution of stars in the Zero-Age Horizontal Branch (ZAHB) which, in turn, depends on the mass loss during the He-flashes at the Asymptotic Giant Branch (AGB) (Arellano Ferro et al. 2018a; Caputo et al. 1978). The fact that NGC 1261 is among the few Oo I clusters with extremely red HB, has intermediate metallicity and harbours numerous RR Lyrae stars of both modes, add a particular interest to its study.
In the present work we perform such analysis based on a new, extensive time-series of CCD images. The specific calibrations for diferent families of variable stars, concerning Fourier light curve decomposition, luminosity of the horizontal branch, and P-L relations are discussed. We also make use of the possibility of ensuring the membership of the variables to the cluster through the analysis of proper motions available in the Gaia DR2 catalogue. The paper is structured in the following way: In , we describe our observations, the data reduction process and the transformation to the standard photometric system. In , we report the periods, epochs and display the VI light curves of all variables detected in our photometry. We discuss the cluster membership and some cases of clear light contamination by extremely close neighbours, as well as the corresponding corrections in amplitude and position, in the color-magnitude diagram (CMD). Our failed efforts to find new variables are described. In , we present the log -amplitude diagram or Bailey’s diagram to confirm the Oo I type nature of NGC 1261. describes our estimation of the interstellar reddening. and contain the light curve Fourier decomposition and physical parameters estimations, and the comparison with previous determinations of [Fe/H] and distance. In we comment on the structure of the HB and the correlation with the distribution of RR Lyrae pulsation modes in the inestability strip. In we summarize our work.
0.2 Data, observations and reductions
The data used for the present work were obtained with the 1.54meter telescope at the Bosque Alegre Astrophysical Station of the Cordoba Observatory, (National University of Cordoba), Argentina, during seventeen nights between August 19th 2017 and November 30th 2018. A total 308 and 388 and CCD images were acquired. The detector used was a CCD Alta F16M of 40964096 square 9-micron pixels, binned , with a scale of 0.496 arcsec/pix (after binning). The images were trimmed to pixels, for a useful field of view (FoV) of approximately arcmin2
Table 1 summarizes the observation dates, exposure times and average seeing conditions.
| Date (y/m/d) | (s) | (s) | Avg. seeing (") | ||
|---|---|---|---|---|---|
| 2017/08/19 | 17 | 400 | 20 | 200 | 3.0 |
| 2017/08/20 | 19 | 400 | 25 | 200 | 2.9 |
| 2017/09/10 | 15 | 400 | 17 | 200 | 3.1 |
| 2017/09/15 | 15 | 400 | 15 | 200 | 3.0 |
| 2017/09/22 | 24 | 400 | 29 | 200 | 2.3 |
| 2017/10/06 | 15 | 400 | 19 | 200 | 3.0 |
| 2017/10/28 | 26 | 400 | 30 | 200 | 3.1 |
| 2017/12/07 | 13 | 400 | 14 | 200 | 2.4 |
| 2018/08/03 | 4 | 300 | 6 | 150-200 | 2.9 |
| 2018/08/04 | 27 | 300 | 33 | 150 | 3.4 |
| 2018/08/05 | 27 | 300 | 27 | 150 | 2.9 |
| 2018/08/11 | – | – | 23 | 150 | 3.0 |
| 2018/09/02 | 33 | 300 | 37 | 150 | 2.4 |
| 2018/09/14 | 28 | 300 | 38 | 150 | 2.3 |
| 2018/09/16 | 23 | 300 | 29 | 150 | 2.3 |
| 2018/11/16 | 18 | 300 | 21 | 150 | 2.9 |
| 2018/11/30 | 4 | 300 | 5 | 150 | 2.6 |
| 2018/12/16 | 22 | 300 | 24 | 150 | 2.5 |
| Total: | 330 | – | 412 | – | – |
Columns and give the number of images taken with the and filters respectively. Columns and provide the exposure time, or range of exposure times employed during each night for each filter. The average seeing is listed in the last column.
0.2.1 Difference Image Analysis
For the reduction of our data, we employed the software Difference Imaging Analysis (DIA) with its pipeline implementation DanDIA111DanDIA is built from the DanIDL library of IDL routines available at http://www.danidl.co.uk (Bramich 2008; Bramich et al. 2013). With this, we were able to obtain high-precision photometry for all the point sources in the FoV of our CCD images. First, a reference image is created by DanDIA by stacking the best images in each filter; then, the reference image is subtracted from the rest of the images. In each reference image, we measured the fluxes (referred to as reference fluxes) and positions of all PSF-like objects (stars) by extracting a spatially variable empirical PSF. This PSF is built from about 300-400 isolated stars, and a third degree polynomial is fitted to each detected object.
Differential fluxes are converted into total fluxes. The total flux in ADU/s at each epoch can be estimated as:
| (1) |
where is the reference flux (ADU/s), is the differential flux (ADU/s) and is the photometric scale factor (the integral of the kernel solution). Conversion to instrumental magnitudes was achieved using:
| (2) |
where is the instrumental magnitude of the star at time . The above procedure has been described in detail in Bramich et al. (2011).
0.2.2 Photometric Calibrations
Relative calibration
To correct for possible systematic errors, we applied the methodology developed in Bramich & Freudling (2012) to solve for the magnitude offsets that should be applied to each photometric measurement from the image . In terms of DIA, this translates into a correction for the systematic error introduced into the photometry due to a possible error in the flux-magnitude conversion factor (Bramich et al., 2015). In the present case the corrections were very small, 0.001 mag for stars brighter than .
Absolute calibration
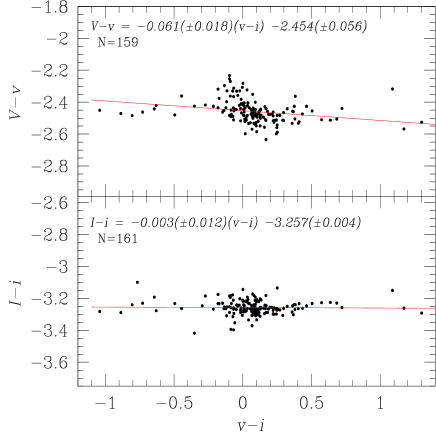
Standard stars in the field of NGC 1261 are included in the online collection of Stetson (2000)222http://www3.cadc-ccda.hia-iha.nrc-cnrc.gc.ca/community/STETSON/standards and we used them to transform instrumental vi magnitudes into the Johnson-Kron-Cousins standard VI system. These stars are distributed in the cluster periphery, they are generally isolated and can be accurately measured by DanDIA. The mild colour dependence of the standard minus instrumental magnitudes is shown in Fig. 1. The transformation equations are explicitly given in the figure itself.
Internal errors
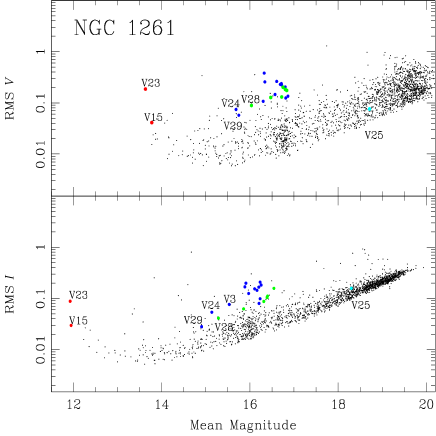
The internal errors of our CCD photometry can be evaluated via the rms diagram of Fig. 2.
0.3 Variable stars in NGC 1261
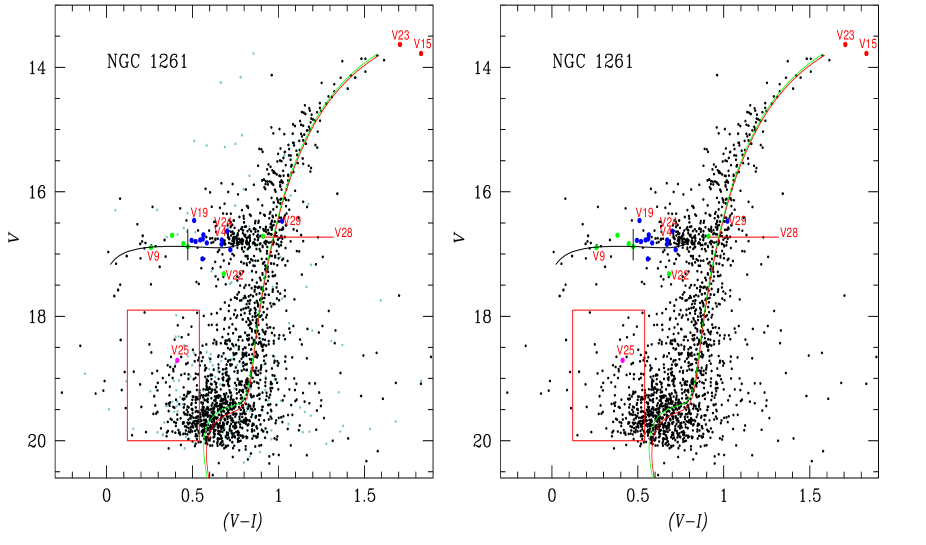
There are 29 variable stars listed in the Catalogue of Variable Stars in Globular Clusters (CVSGC) (Clement et al., 2001). The time-series VI photometry obtained in this work is reported in Table 2, of which only a small portion is included in the printed version of the paper. The full table shall be available in electronic form in the Centre de Donnés astronomiques de Strasbourg database (CDS). The RR Lyrae stars V20 and V27 are blended in our images and could not be resolved, therefore they are neither included in the Table 2 nor discussed in this paper. The light curves in our data for the RRab, RRc and the SX Phe V25 are displayed in Fig. 3. Our determination of their mean magnitudes, amplitudes and periods are given in Table 3. The rms diagrams in the and filters and the Color-Magnitude diagram (CMD) of the cluster are shown in Figs. 2 and 4 respectively. The positions of the known variable stars are shown.
| Variable | Filter | HJD | |||
|---|---|---|---|---|---|
| Star ID | (d) | (mag) | (mag) | (mag) | |
| V2 | 2457985.75380 | 16.864 | 19.293 | 0.010 | |
| V2 | 2457985.75851 | 16.830 | 19.259 | 0.010 | |
| ⋮ | ⋮ | ⋮ | ⋮ | ⋮ | ⋮ |
| V2 | 2457985.74544 | 16.417 | 19.673 | 0.019 | |
| V2 | 2457985.74783 | 16.367 | 19.622 | 0.018 | |
| ⋮ | ⋮ | ⋮ | ⋮ | ⋮ | ⋮ |
| V3 | 2457985.75380 | 16.304 | 18.752 | 0.006 | |
| V3 | 2457985.75851 | 16.294 | 18.741 | 0.006 | |
| ⋮ | ⋮ | ⋮ | ⋮ | ⋮ | ⋮ |
| V3 | 2457985.74544 | 15.535 | 18.791 | 0.009 | |
| V3 | 2457985.74783 | 15.537 | 18.794 | 0.009 | |
| ⋮ | ⋮ | ⋮ | ⋮ | ⋮ | ⋮ |
* The standard and instrumental magnitudes are listed in columns 4 and 5, respectively, corresponding to the variable stars in column 1. Filter and epoch of mid-exposure are listed in columns 2 and 3, respectively. The uncertainty on is listed in column 6, which also corresponds to the uncertainty on . A full version of this table is available at the CDS database.

.
It is rather clear that the scatter around the horizontal branch (HB) is large and that some RR Lyrae stars appear much too bright. It is common to use the star position on the CMD as an argument against membership in the cluster, e.g., RR Lyrae stars that appear much above or below the HB. The information now available in the Gaia DR2 data base (Gaia Collaboration et al., 2018), enables a deeper discussion on possible contaminations by neighbouring not-resolved stars and their proper motions. In the following section we shall refer to individual RR Lyrae stars with peculiar positions in the CMD.
Regarding the SX Phe stars, there are three of them reported in the CVSGC: V25, V26 and V30. Our light curve of V25 is shown in Fig. 3. However, we have been unable to detect the faint stars V26 and V30, near the cluster core, probably because of the seeing conditions during our observations. Nevertheless we want to point out that we see no stars, or that they are badly blended, in the positions marked in the identification chart of the discovery paper (Salinas et al., 2007).
0.3.1 On the cluster membership and light contamination of individual variables
With the aim of producing a Colour-Magnitude Diagram (CMD) free of field stars, we applied the method of Bustos Fierro & Calderón (2019) to identify probable members in the field of the cluster. The method uses the high quality astrometric data available in Gaia DR2, and is based on the Balanced Iterative Reducing and Clustering using Hierarchies (BIRCH) algorithm (Zhang et al. 1996) in a four-dimensional space of physical parameters –positions and proper motions– that detects groups of stars in that 4D-space. We extracted 5258 Gaia sources that are very likely members of the cluster. The membership analysis shows that most of the stars in this field are indeed members of the cluster, but that their proper motions are quite small ( mas/yr), and that their distribution is well overlapped with that of the field stars. The top two panels of Fig. 4 display the full CMD diagram before and after the field star correction. Almost all known variables are matched with a member. The exceptions are stars V24, V26 and V31, that match with sources of unknown membership, because their proper motions were not measured in the Gaia survey.
Plotting the positions of all Gaia DR2 sources in the field of our images, we noted that, in some cases, two or even three of them can fall within the FWHM of the PSF of a detected stellar source. A direct consequence of this is an alteration of the magnitude of the star, making it apparently brighter and, in the case of variable stars, artificially reducing the amplitude of their light curves.
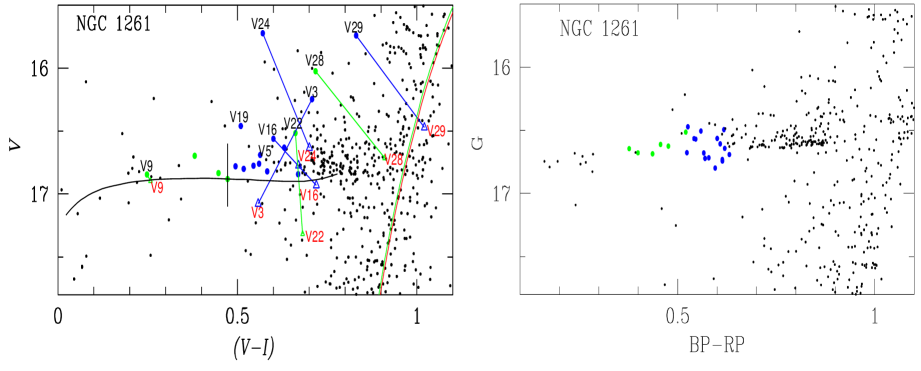
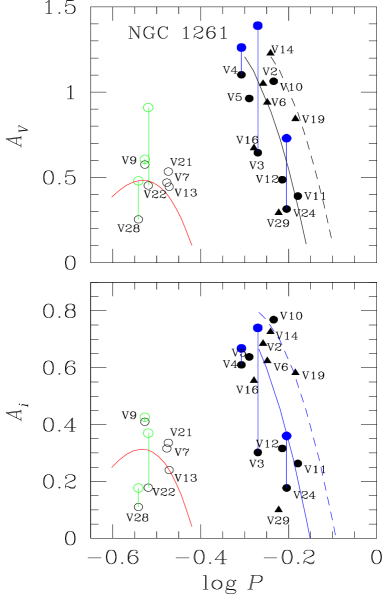
In Fig. 5, we show an amplification of the HB region of NGC 1261. In the left panel, known variables are plotted using the intensity weighted mean and listed in Table 3. RRab and RRc stars are represented by blue and green symbols respectively. It is evident that some of the RR Lyrae stars are much too bright relative to the ZAHB, namely, V3, V19, V22, V24, V28 and V29. The positions of the two RRc stars V22 and V28 are also much redder than expected. As a reference, the vertical black line that represents the empirical red edge of the first overtone instability strip (FORE) is also displayed (Arellano Ferro et al., 2016).
To help decide whether the odd positions of these stars are the result of light pollution, or simply because they are non-members, in the cluster, we analyzed the photometric values of all Gaia sources present in a given variable star PSF. The magnitudes of the individual sources in the Gaia photometric system, -, -, and -band, were transformed into and magnitudes using the relationships provided by J.M. Carrasco (2018: Gaia team), and available in Section 5.3.7 of the Gaia DR2 documentation333http://gea.esac.esa.int/arcfhive/documentation/GDR2/index.html. Then, the expected combined magnitude was calculated, and hence an estimation was derived of the correction to be applied to our observed (combined) and magnitudes. This also enabled us to estimate the amplitude corrections.
In Table 4 we list the variable stars with two Gaia sources within their PSF. We use the variability flag in Gaia DR2 to identify the variable component when it is available; for stars without variability flag (V17, V24 and V29) we have analysed their positions in the CMD with Gaia DR2 magnitudes and colours to decide which is the variable and which is the contaminant. Their Gaia magnitudes were transformed into the Johnson-Kron-Cousins photometric system ( , and ), and the combined magnitudes of the pair, and , were calculated. The differences between the magnitude of the variable component and the combined magnitude of the pair, and , were computed; the corrected positions are represented by triangles in the left panel of Fig. 5 and labelled with red numbers. The corrected amplitudes due to the presence of the neighbour star (Amp and Amp ) were also calculated, and are represented by colour symbols and vertical displacements in the Bailey diagram, discussed below in 6. It can be seen in that diagram that, after the corrections of the amplitudes, most stars have moved much closer to the expected locus for this OoI type cluster.
The persistent peculiar positions of some variables in the CMD, make us suspicious about their membership status in the cluster, or that a serious light pollution by neighbouring stars is corrupting our photometry for these specific objects. In the right panel of Fig. 5, we reproduced the HB of the cluster using the Gaia DR2 photometric indices. It is rewarding to see that all RR Lyrae stars fall properly on the HB, which also indicates that the selection of the true variable, performed in Table 4, for those stars contaminated by a secondary Gaia source, was correct. This figure also shows that the distribution of modes on the HB is neatly segregated, a property that will be discussed later in the paper.
We can conclude that, all known variables are most likely, cluster members, and that our photometry for these stars, namely V3, V16, V19, V24, V28 and V29 is seriously contaminated by a close, well within the PSF, unseen neighbour.
We note that the two SR V15 and V23, are mem- bers while for the three SX Phe, V25 lies in the blue straggler region and seems a likely member, V26 has not values of proper motion and V30 is definitely not a member. The latter two were not detected in our photometry. Hence, our calculations of the physi- cal parameters will be restricted to the non-peculiar stars and will be described below.
| Star ID | Type | (J2000.0) | (J2000.0) | Gaia DR2 ID | ||||||
|---|---|---|---|---|---|---|---|---|---|---|
| (mag) | (mag) | (mag) | (mag) | (days) | + 2450000 | |||||
| V2 Bl | RRab | 16.780 | 12.285 | 1.16 | 0.76 | 0.585730 | 8095.6967 | 03:12:11.28 | 55:12:22.0 | 4733794790512123904 |
| V3 | RRab | 16.248 | 15.540 | 0.65 | 0.30 | 0.537003 | 8439.8438 | 03:12:21.78 | 55:13:50.7 | 4733793764014756224 |
| V4 | RRab | 16.633 | 16.002 | 1.10 | 0.61 | 0.492876 | 8376.7150 | 03:12:18.56 | 55:13:28.4 | 4733794519928245888 |
| V5 | RRab | 16.690 | 16.127 | 0.96 | 0.64 | 0.513313 | 8012.7930 | 03:12:11.93 | 55:13:01.9 | 4733794588651585664 |
| V6 Bl | RRab | 16.759 | 16.199 | 0.94 | 0.62 | 0.564100 | 8335.8557 | 03:12:25.05 | 55:13:08.6 | 4733793867093968896 |
| V7 | RRc | 16.835 | 16.388 | 0.47 | 0.32 | 0.333546 | 8095.5598 | 03:11:58.44 | 55:10:37.3 | 4733797852825688704 |
| V8 | RRab | 16.283 | – | 0.86 | – | 0.538204 | 8012.8146 | 03:12:00.44 | 55:15:16.4 | 4733700580405300480 |
| V9 | RRc | 16.846 | 16.598 | 0.58 | 0.41 | 0.297221 | 8019.6966 | 03:12:20.40 | 55:13:35.3 | 4733794519928956800 |
| V10 | RRab | 16.800 | 16.283 | 1.06 | 0.77 | 0.583374 | 8364.7012 | 03:12:21.99 | 55:11:45.9 | 4733794726089585664 |
| V11 | RRab | 16.843 | 16.174 | 0.39 | 0.26 | 0.662171 | 8335.9157 | 03:12:05.50 | 55:11:27.7 | 4733794859231637376 |
| V12 | RRab | 16.821 | 16.238 | 0.49 | 0.32 | 0.610285 | 8095.6920 | 03:12:26.15 | 55:12:45.8 | 4733794657370122880 |
| V13 | RRc | 16.698 | 16.317 | 0.45 | 0.24 | 0.337568 | 8019.7891 | 03:12:07.01 | 55:14:33.1 | 4733700713548568832 |
| V14 Bl | RRab | 16.775 | 16.228 | 1.23 | 0.73 | 0.573977 | 8378.7791 | 03:12:09.75 | 55:14:07.6 | 4733700717844254080 |
| V15 | SR | 13.778 | 11.948 | – | – | – | 8007.7702 | 03:12:02.50 | 55:10:48.1 | 4733797814168962304 |
| V16 Bl | RRab | 16.561 | 15.961 | 0.67 | 0.56 | 0.526160 | 8469.6225 | 03:12:13.90 | 55:13:12.9 | 4733794588651555584 |
| V171 | RRab | – | – | – | – | 0.511631 | 7986.8406 | 03:12:15.50 | 55:12:36.2 | 4733794588651549824 |
| V19 Bl | RRab | 16.461 | 15.951 | 0.84 | 0.58 | 0.653738 | 8376.7652 | 03:12:18.19 | 55:12:44.7 | 4733794691727354624 |
| V201 | RRab | – | – | – | – | – | – | 03:12:19.31 | 55:13:00.4 | 4733794623011123200 |
| V21 | RRc | 16.881 | 16.408 | 0.54 | 0.34 | 0.336180 | 8439.8209 | 03:12:14.47 | 55:12:31.3 | 4733794588651163648 |
| V22 | RRc | 16.516 | 15.855 | 0.45 | 0.18 | 0.302567 | 8033.8565 | 03:12:16.49 | 55:13:38.1 | 4733794519931924224 |
| V23 | SR | 13.632 | 11.926 | – | – | – | 8055.6833 | 03:12:15.69 | 55:12:40.7 | 4733794588651583616 |
| V24 | RRab | 15.724 | 15.153 | 0.32 | 0.18 | 0.624395 | 8376.6983 | 03:12:14.43 | 55:13:34.8 | 4733794554291694592 |
| V25 | SX Phe | 18.710 | 18.300 | 0.25 | 0.18 | 0.056503 | 8033.7103 | 03:12:17.17 | 55:11:22.7 | 4733794932246020480 |
| V261 | SX Phe | – | – | – | – | – | – | 03:12:17.05 | 55:12:43.9 | 4733794588651476224 |
| V271 | SR | – | – | – | – | – | – | 03:12:14.63 | 55:13:06.2 | 4733794588651284992 |
| V28 | RRc | 16.025 | 15.285 | 0.25 | 0.11 | 0.287349 | 7986.7667 | 03:12:13.53 | 55:13:00.8 | 4733794588651177344 |
| V29 Bl | RRab | 15.742 | 14.911 | 0.29 | 0.10 | 0.598775 | 7986.8960 | 03:12:13.05 | 55:13:20.5 | 4733794554291844352 |
| V301 | SX Phe | – | – | – | – | – | – | 03:12:16.58 | 55:12:54.0 | 4733794588648149248 |
| V31 | EC | – | – | – | 0.30 | 0.052493 | 8439.8246 | 03:12:18.70 | 55:14:16.0 | 4733794519931172608 |
Bl: RR Lyrae with Blazhko effect.
1. Star not resolved in our images.
0.3.2 Searching for new variables
Since prolonged time-series have proven successful in identifying new variables, we have performed a systematic search for them with the few strategies discussed below.
On the CMD of NGC 1261, we isolated all stars contained in regions where it is common to find variable stars, e.g. near the Instability Strip (IS) in the Horizontal Branch (HB), the Blue Straggler region (BS) and near the tip of the Red Giant Branch (TRGB). We analysed the light curves of the stars in those regions and looked for variability by determining their period (if any), using the program period04 (Lenz & Breger, 2005) or the string-length method (Burke et al. 1970; Dworetsky 1983); then, we plotted their apparent magnitudes with respect to their phase. For long-term variables, the magnitude is plotted as a function of Heliocentric Julian Day in search for hints of variability This procedure recovered all known variables, but in all cases we found no new ones in our data.
A third method consists in the detection of variations of PSF-like peaks in stacked residual images, from which we can see the variable stars blink. Again, all previous known variables were detected, but no new variables emerged.
0.3.3 About the RR Lyrae stars from Gaia DR2 in the field of NGC 1261
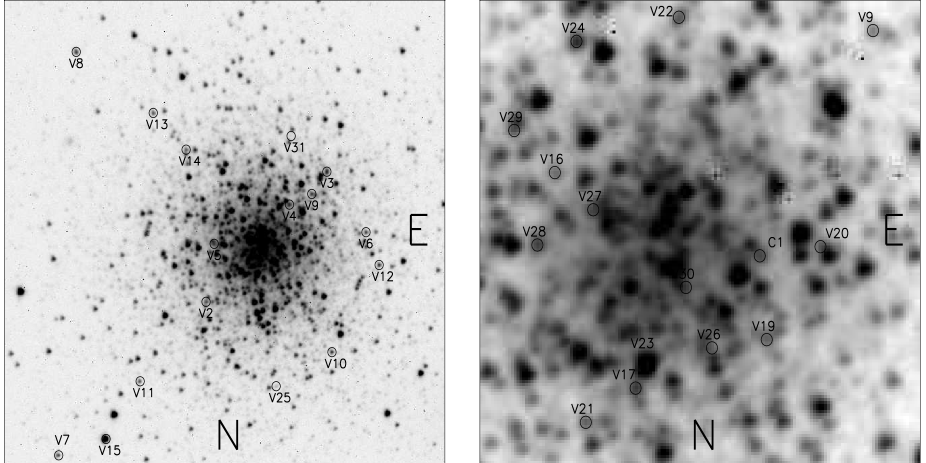
In their catalogue of RR Lyrae stars identified via the Specific Object Study pipeline in Gaia DR2 all over the sky, Clementini et al. (2019) report 21 RR Lyrae stars within a radius of 20 arcmin around NGC 1261. Eighteen of these are known RR Lyrae stars listed in the CVSGC. Two stars, well in the outskirts of that field, (Gaia DR2 sources 4734551739843543808 and 4733801701116515200), are not members according to the method of Bustos Fierro & Calderón (2019) and are not in the field of our observations. A third star near the cluster core (Gaia DR2 source 4733794519931744000), categorised by Clementini et al. (2019) as an RRc star, is present in our light curve collection. We have identified it as C1 in the chart of Fig. 7, but we found no variations. The star, with mean magnitudes =16.35 and =15.63, lies a bit above the red clump. Thus we do not confirm it as an RRc star.
For clarification, we offer in Fig. 7 an identification chart of all variables reported in the CVSGC. The SX Phe stars V26 and V30, although identified according to the coordinates in the CVSGC, were not detected as variables in the present study.
| Variable | Gaia DR2 ID | Amp | Amp | |||||||||
|---|---|---|---|---|---|---|---|---|---|---|---|---|
| (mag) | (mag) | (mag) | (mag) | (mag) | (mag) | (mag) | (mag) | (mag) | (mag) | (mag) | ||
| V3 | 4733793764014756224 | 16.6773 | 0.5234 | 16.746 | 16.295 | 0.451 | 15.91 | 0.83 | 15.32 | 0.98 | 1.39 | 0.74 |
| V3 | 4733793764014757248 | 16.4500 | 0.8248 | 16.591 | 15.883 | 0.708 | – | – | – | – | – | – |
| V4 | 4733794519928245888 | 16.5663 | 0.5417 | 16.638 | 16.172 | 0.467 | 16.50 | 0.14 | 16.07 | 0.10 | 1.26 | 0.67 |
| V4 | 4733794519931768192 | 18.7558 | – | 18.773 | 18.735 | 0.038 | – | – | – | – | – | – |
| V9 | 4733794519928956800 | 16.6788 | 0.3993 | 16.727 | 16.377 | 0.350 | 16.67 | 0.05 | 16.34 | 0.04 | 0.61 | 0.43 |
| V9 | 4733794519928957056 | 19.9313 | – | 19.949 | 19.910 | 0.038 | – | – | – | – | – | – |
| V16 | 4733794588651555584 | 16.5656 | 0.6003 | 16.650 | 16.134 | 0.516 | 16.28 | 0.37 | 15.88 | 0.25 | – | – |
| V16 | 4733794588651555840 | 17.6072 | – | 17.625 | 17.586 | 0.038 | – | – | – | – | – | – |
| V17 | 4733794588651549824 | 16.6079 | 0.6079 | 16.694 | 16.172 | 0.522 | 15.76 | 0.93 | 15.14 | 1.03 | – | – |
| V17 | 4733794588651550080 | 16.2219 | 0.7993 | 16.356 | 15.670 | 0.686 | – | – | – | – | – | – |
| V22 | 4733794519931924224 | 16.6257 | 0.4764 | 16.686 | 16.273 | 0.413 | 15.89 | 0.80 | 15.49 | 0.78 | 0.91 | 0.37 |
| V22 | 4733794519931924352 | 16.5920 | 0.6806 | 16.592 | 16.217 | 0.375 | – | – | – | – | – | – |
| V24 | 4733794554291694592 | 16.4950 | 0.6173 | 16.583 | 16.053 | 0.530 | 15.67 | 0.91 | 15.27 | 0.78 | 0.73 | 0.36 |
| V24 | 4733794554291623424 | 16.2512 | 0.3297 | 16.290 | 15.996 | 0.294 | – | – | – | – | – | – |
| V27 | 4733794588651284992 | 16.5018 | 0.5269 | 16.571 | 16.117 | 0.454 | 16.33 | 0.24 | 15.94 | 0.17 | – | – |
| V27 | 4733794588651285376 | 18.0489 | – | 18.067 | 18.028 | 0.038 | – | – | – | – | – | – |
| V28 | 4733794588651177344 | 16.5151 | 0.5204 | 16.583 | 16.134 | 0.449 | 15.89 | 0.69 | 15.62 | 0.52 | 0.48 | 0.18 |
| V28 | 4733794588651552256 | 16.6861 | – | 16.704 | 16.665 | 0.038 | – | – | – | – | – | – |
| V29 | 4733794554291844352 | 16.5704 | 0.5458 | 16.588 | 16.550 | 0.038 | 15.92 | 0.73 | 15.64 | 0.54 | – | – |
| V29 | 4733794554291843840 | 16.6775 | – | 16.695 | 16.657 | 0.038 | – | – | – | – | – | – |
0.4 Bailey diagram and Oosterhoff type
The period-amplitude or Bailey diagram for RR Lyrae stars is shown in Fig. 6 for the VI bandpasses. The periods and amplitudes are listed in Table 3. In most cases, we took the amplitudes corresponding to the best fit provided by the Fourier decomposition of the light curves. In cases where the light curve showed Blazhko effect, the maximum amplitude was measured and the star was plotted with a triangular marker. The continuous and dashed black lines in the top panel of Fig. 6 are the loci for unevolved and evolved stars according to Cacciari et al. (2005). The red parabolas were calculated by Arellano Ferro et al. (2015) from a sample of RRc stars in five OoI clusters, avoiding Blazhko variables. In the bottom panel, the blue solid and segmented loci for unevolved and evolved stars, respectively, are from Kunder et al. (2013).
As noted in 0.3.1, a few variables are clearly unresolved from very close neighbours. In these cases, the amplitudes were corrected using the individual magnitudes of the components listed in Table 4. The corrected amplitudes are indicated in Fig. 6 by green and blue symbols, for RRc and RRab stars respectively. It is rather clear that the amplitude corrections help sustain the fact that the distribution of stars concentrates around the unevolved sequences, as expected in Oo I type clusters.
0.5 Comment on the cluster reddening
While this cluster is far away from the Galactic disk, and a very low reddening has been assigned to it, it is always a good exercise to calculate such reddening by an independent method. Individual reddenings for RRab stars can be estimated using the colour curve near minimum. Proposed originally by Sturch (1966), the method has now been calibrated in the VI passbands by Guldenschuh et al. (2005), who concluded that the intrinsic colour of RRab stars curves at phases 0.5-0.8, is 0.58 0.02. We calculated the observed at this phase range in our light curves and estimated individual values of , the average of which, converted to is , i.e., nearly zero, and in agreement with the interstellar reddening of given by the calibrations of Schlafly & Finkbeiner (2011) and Schlegel et al. (1998). In what follows we shall adopt .
0.6 RR Lyrae stars: [Fe/H]and from light curve Fourier decomposition
Fourier decomposition of the light curves and the use of empirical calibrations enable us to estimate some key stellar physical parameters. The Fourier series to mathematically describe the light curve is of the form:
| (3) |
where is the magnitude at time , is the period of pulsation, and is the epoch. When calculating the Fourier parameters, we used a least-squares approach to estimate the best fit for the amplitudes and phases of the light curve components. The phases and amplitudes of the harmonics in Eq. 3, i.e. the Fourier parameters, are defined as , and .
This approach has been regularly used in RR Lyrae stars in a large number of clusters (e.g., Arellano Ferro et al. (2018a); Deras et al. (2019) and references therein). To avoid a lengthy repetition, we refer the reader to Section 4 of Deras et al. (2019) for the specific calibrations. Particularly, their Eqs. 4 and 5 describe the calibrations for RRab stars of Jurcsik & Kovács (1996) and Kovács & Walker (2001), which render values of [Fe/H] and , with standard deviations of 0.14 dex and 0.04 mag rectively, and to Eqs. 6 and 7, that give the calibrations for RRc stars of Morgan et al. (2007) and Kovács & Kanbur (1998) with standard deviations of 0.14 dex and 0.042 mag respectively. We have not included in the calculation of physical parameters those stars that are apparently contaminated by a neighbouring source (cf. 0.3.1); since the presence of a neighbour also perturbs the light curves shapes, the Fourier parameters and the derived physical parameters turn out spurious. In Table 5 we list the Fourier parameters, and in Table 6 the corresponding individual physical parameters for the stars included in the calculation and the averages. For comparison, we have transformed [Fe/H]ZW on the Zinn & West (1984) metallicity scale into the UVES scale using the equation [Fe/H]UVES= + 0.130 [Fe/H] [Fe/H] (Carretta et al., 2009). It should be noted that the uncertainties we have quoted in Table 6 only represent the internal errors associated to the Fourier fitting procedure, and do not include any systematic errors that may be inherent to the use of the calibrations quoted above to estimate the physical parameters. The standard deviation of the mean , given below the weighted mean physical parameters, is comparable to the standard deviation of the calibrations, and represents a more reliable estimate of the systematic errors in our procedure.
| Variable ID | ||||||||
| ( mag) | ( mag) | ( mag) | ( mag) | ( mag) | ||||
| RRab star | ||||||||
| V2 | 16.788(4) | 0.331(6) | 0.126(6) | 0.072(6) | 0.029(6) | 4.036(59) | 8.198(99) | 6.147(219) |
| V6 | 16.752(2) | 0.305(4) | 0.146(4) | 0.098(3) | 0.070(4) | 3.910(33) | 8.215(51) | 6.205(68) |
| V10 | 16.810(3) | 0.377(4) | 0.189(3) | 0.128(4) | 0.077(4) | 3.936(27) | 8.255 (39) | 6.191(59) |
| V11 | 16.837(3) | 0.147(4) | 0.060(3) | 0.028(4) | 0.011(4) | 4.050(78) | 8.587 (139) | 7.709(344) |
| V12 | 16.816(2) | 0.177(3) | 0.070(3) | 0.034(3) | 0.018(3) | 4.406(48) | 9.254(90) | 7.522(150) |
| V14 | 16.775(3) | 0.368(5) | 0.182(4) | 0.154(5) | 0.088(5) | 4.079(39) | 8.369 (51) | 6.378(75) |
| RRc stars | ||||||||
| V7 | 16.810(3) | 0.181(4) | 0.011(4) | 0.019(4) | 0.008(4) | 4.665(31) | 4.415(201) | 2.409(509) |
| V9 | 16.846(1) | 0.285(2) | 0.052(2) | 0.028(2) | 0.028(2) | 4.749(37) | 2.734(64) | 1.485(67) |
| V13 | 16.698(2) | 0.222(3) | 0.026(3) | 0.013(3) | 0.008(2) | 4.792(114) | 3.815(206) | 2.681(318) |
| V21 | 16.881(1) | 0.262(2) | 0.022(2) | 0.023(2) | 0.006(2) | 4.795(88) | 4.115(88) | 2.729(347) |
| RRab star | |||||||
| Star | [Fe/H]ZW | [Fe/H]UVES | log | log | |||
| V2 | 0.570(9) | 3.811(25) | 1.672(3) | 0.70(21) | 5.49(2) | ||
| V6 | 0.604(5) | 3.809(10) | 1.658(3) | 0.67(8) | 5.46(1) | ||
| V10 | 0.517(6) | 3.810(10) | 1.693(2) | 0.70(8) | 5.66(2) | ||
| V11 | 0.600(6) | 3.790(39) | 1.660(2) | 0.67(31) | 5.98(2) | ||
| V12 | 0.635(4) | 3.813(18) | 1.646(2) | 0.55(12) | 5.29(1) | ||
| V14 | 0.562(7) | 3.812(11) | 1.675(3) | 0.66(9) | 5.49(2) | ||
| Weighted Mean | 0.590 | 3.810 | 1.664 | 0.66 | 5.51 | ||
| 0.05 | 0.05 | 0.042 | 0.008 | 0.006 | 0.05 | 0.09 | |
| RRc stars | |||||||
| Star | [Fe/H]ZW | [Fe/H]UVES | log | log | |||
| V7 | 0.571(18) | 3.869(1) | 1.672(7) | 0.49(1) | 4.21(4) | ||
| V9 | 0.512(9) | 3.866(1) | 1.695(4) | 0.63(1) | 4.37(2) | ||
| V13 | 0.588(10) | 3.864(1) | 1.677(4) | 0.51(1) | 4.47(2) | ||
| V21 | 0.571(10) | 3.866(1) | 1.672(4) | 0.49(1) | 4.25(2) | ||
| Weighted Mean | 0.547 | 3.866 | 1.681 | 0.54 | 4.31 | ||
| 0.29 | 0.29 | 0.014 | 0.001 | 0.005 | 0.03 | 0.05 |
1. Not included in the average of [Fe/H].
0.7 Previous metallicity estimates of NGC 1261
To our knowledge, no spectroscopic determination of the metallicity of NGC 1261 or of any of its stars has ever been published. Estimations of [Fe/H] based on photometric indices and their calibrations do exist; they use the height above the HB, the slope of the HB, and the intrinsic colour of the reg-giant branch (RGB) at the HB level, Ferraro et al. (1993) employed these methods and found –1.540.4, –1.850.2 and –1.260.04 respectively, adopting a weighted average . The value of [Fe/H] listed in the catalogue of Harris (1996) (2010 edition) is , that corresponds to the compiled average of Carretta et al. (2009) in their UVES scale, which is equivalent to in the Zinn-West scale.
Our calculations based on the Fourier decomposition and calibrations discussed in 0.6 and listed in Table 6 are, for the RRab stars: [Fe/H] or [Fe/H], and for the RRc stars: [Fe/H] or [Fe/H]. Since different empirical relations have been used to estimate the metallicities of the RRab and RRc stars, there may be some systematic offset between the metallicity estimates for the two types of variable. We should note the peculiarly large value of [Fe/H] found for star V12. The reason for this is the anomalously large value of the Fourier parameter of 9.2540.09. Star V12 is among the smallest amplitude and largest period RRab in NGC 1261, and reminds the case of star V12 in NGC 6171, whose light curve structure is different from that of other RRab stars (Clement & Shelton, 1997), and then is not suitable for the calculation of [Fe/H] from the Fourier analysis. Although the associated uncertainties in our average values of [Fe/H] are smaller than in previous determinations, these values are slightly more metal-weak than those published; still, they are rather in agreement, within the given uncertainties.
0.8 On the distance to NGC 1261
The solar distance to NGC 1261 recorded in the catalogue of Harris (1996) (2010 edition) is 16.3 kpc, calculated from the estimated mean level HB of Ferraro et al. (1993), adopting a [Fe/H]- relation with [Fe/H] and . Our Fourier estimates of and for RRab and RRc stars lead to mean distances of and kpc respectively. Considering the large scatter of the 6 RRc stars in the CMD, and that we only used the RRab closer to the ZAHB, we should probably ignore the distance obtained from the RRc stars, in which case our best estimate of the distance to the cluster from this method is kpc. In Fig. 4 we have shifted the ZAHB and isochrones to this distance, although, admittedly an eye fit of the HB suggests a brighter ZAHB for a distance of about 16.8 kpc
Another independent method to estimate the distance to the cluster, is via the P-L relations of SX Phe stars and of RR Lyrae stars. In the former case, we have calculated of the star V25, the only SX Phe detected in our study, using three versions of P-L relations, from Cohen & Sarajedini (2012), Poretti et al. (2008) and Arellano Ferro et al. (2011), and found 16.1, 15.5 and 15.0 kpc respectively, i.e., all values well below the estimates based on the HB luminosity.
Alternatively, the P-L in the -band for RR Lyrae stars derived by Catelan et al. (2004); , with ; and log f = [/Fe] (Salaris et al., 1993), was applied to the RRab and RRc stars residing close to the ZAHB in the CMD of Fig. 4. From 6 RRab and 4 RRc stars we found an average distance of kpc, which agrees very well with the results obtained from the Fourier light curve decomposition approach. In summary, the best results for the cluster distance are obtained from the Fourier light curve decomposition of the RRab stars that show little scatter near the ZAHB, and the P-L () relationship; these methods give an average of kpc and an uncertainty between 0.7 and 0.3 kpc, respectively.
0.9 Structure of the HB and Age
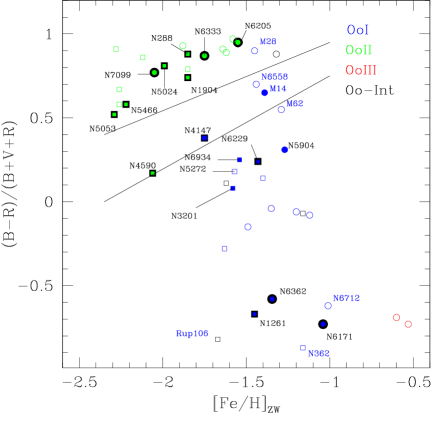
NGC 1261 has a very red HB. The HB structure can be characterised by the parameter . In the HB region shown in the left panel of Fig. 5, built from our VI indices, the RRab and RRc stars appear clearly well segregated by the FORE. This is confirmed in the right panel, built with the Gaia DR2 indices. Fig. 8 is an updated version of Fig. 9 of Arellano Ferro et al. (2018b) which includes NGC 1261 and a few other clusters. Clearly NGC 1261, like other Oo I clusters with very red HBs like NGC 6171 (M107) and NGC 6362, shows a neat segregation of pulsation modes among the RR Lyrae stars. Other Oo I clusters with a similarly red HB where the RRc-RRab distribution is yet to be explored are: NGC 362, Rup 106 and NGC 6712. In Rup 106, however, no RRc stars are known, and NGC 6712 is an interesting borderline case, since either a few RRab are sitting in the either-or region, or the FORE is shifted to the red by only about 0.04 mag (Deras 2019; private communication), which is the uncertainty in the location of the FORE. We have found that, in all Oo II clusters, the modes are always segregated. Only a few Oo I clusters with between 0.0 and 0.7 have been found to have inter-mode region populated by RRab and RRc stars: NGC 3201, NGC 5904 (M5), NGC 6402 (M14) and NGC 6934.
Based on Hubble Space Telescope Advanced Camera for Surveys photometry, and using the isochrone fitting between the base of turnoff and the lower RGB, VandenBerg et al. (2013) concluded that the age of NGC 1261 is 10.75 0.25 Gyr. Being the precision of our photometry, and the dispersion in the CMD near the TO, inadecuate for a subtle discussion on the age of the system, we overplotted to our observed CMD two isochrones for 10.0 and 11.0 Gyr from the stellar models of VandenBerg et al. (2014), for [Fe/H]=, Y=0.25 and [/Fe]= 0.4. The isochrones and the ZAHB, shifted to a distance of 17.2 kpc and . We can see (Fig. 4) that the current data set is consistent with the age of the cluster determined by VandenBerg et al. (2013).
0.10 Summary and Discussion
Almost all photometric studies of NGC 1261, both in the photographic plate and CCD eras, dedicate their efforts to the overall study of the cluster, its CMD structure and the estimation of its age. Only a few studies, since the pioneering works of Fourcade & Laborde (1966) and Laborde & Fourcade (1966) when the first variables in this cluster were discovered, have been devoted to the study of the cluster variable stars population. Specifically in the CCD era, and to the best of our knowledge, only the works of Salinas et al. (2007) and Salinas et al. (2016) have focused on the study of the variable stars in crowded environments, via the differential image approach (DIA). Yet these authors point out the extreme difficulty of transforming the relative fluxes rendered by DIA, into the astrophysically more useful magnitudes in a given calibrated system. We must add that time-series do not always cover the light curves fully in the phase diagrams. The present study is the first one, as far as we know, that reports complete light curves in the VI filters, and use them to derive physical quantities from the variable star families of NGC 1261. This approach also allowed our best estimate of the cluster distance to be kpc. Individual radii and masses for the RR Lyrae stars are also reported.
A thorough multi-approach search in a region of about arcmin2 around the cluster revealed no new variable stars within the limitations of our CCD photometry. The Fourier decomposition technique was employed to derive the mean values [Fe/H] and [Fe/H] for the RRab and RRc stars, respectivelly. These two estimations should be considered independent, as they come from totally unrelated calibrations. The above results show a cluster slightly more metal poor and distant than generally accepted (e.g., Harris 1996).
The distribution of cluster member RR Lyrae stars on the HB shows a rather clear splitting of modes about the FORE, as seems to be the case of other two or perhaps three globulars with very red HB, namely, NGC 6171, NGC 6362 and probably NGC 6712. Two more clusters with a very red HB are NGC 362 and Rup 106, but no detailed study of the distribution of modes exists for NGC 362, and no RRc stars are known in Rup 106.
Acknowledgements
We are grateful to Cecilia Quiñones for her proficient help during the acquisition of the observations in Bosque Alegre. This project was partially supported by DGAPA-UNAM (Mexico) via grant IN106615-17. We have made extensive use of the SIMBAD, ADS services.
References
- Arellano Ferro et al. (2018a) Arellano Ferro, A., Ahumada, J. A., Bustos Fierro, I. H., Calderón, J. H., & Morrell, N. I. 2018a, Astronomische Nachrichten, 339, 183
- Arellano Ferro et al. (2011) Arellano Ferro, A., Figuera Jaimes, R., Giridhar, S., Bramich, D. M., Hernández Santisteban, J. V., & Kuppuswamy, K. 2011, MNRAS, 416, 2265
- Arellano Ferro et al. (2016) Arellano Ferro, A., Luna, A., Bramich, D. M., Giridhar, S., Ahumada, J. A., & Muneer, S. 2016, Ap&SS, 361, 175
- Arellano Ferro et al. (2015) Arellano Ferro, A., Mancera Piña, P. E., Bramich, D. M., Giridhar, S., Ahumada, J. A., Kains, N., & Kuppuswamy, K. 2015, MNRAS, 452, 727
- Arellano Ferro et al. (2018b) Arellano Ferro, A., Rojas Galindo, F. C., Muneer, S., & Giridhar, S. 2018b, Rev.Mex.Astron.Astrofis, 54, 325
- Bartolini et al. (1971) Bartolini, C., Grilli, F., & Robertson, J. W. 1971, Information Bulletin on Variable Stars, 594
- Bono et al. (1994) Bono, G., Caputo, F., & Stellingwerf, R. F. 1994, ApJ, 423, 294
- Bramich (2008) Bramich, D. M. 2008, MNRAS, 386, L77
- Bramich et al. (2015) Bramich, D. M., Bachelet, E., Alsubai, K. A., Mislis, D., & Parley, N. 2015, A&A, 577, A108
- Bramich et al. (2011) Bramich, D. M., Figuera Jaimes, R., Giridhar, S., & Arellano Ferro, A. 2011, MNRAS, 413, 1275
- Bramich & Freudling (2012) Bramich, D. M. & Freudling, W. 2012, MNRAS, 424, 1584
- Bramich et al. (2013) Bramich, D. M., Horne, K., Albrow, M. D., Tsapras, Y., Snodgrass, C., Street, R. A., Hundertmark, M., Kains, N., Arellano Ferro, A., Figuera, J. R., & Giridhar, S. 2013, MNRAS, 428, 2275
- Burke et al. (1970) Burke, Edward W., J., Rolland, W. W., & Boy, W. R. 1970, Journal of the Royal Astronomical Society of Canada, 64, 353
- Bustos Fierro & Calderón (2019) Bustos Fierro, I. H. & Calderón, J. H. 2019, MNRAS, 488, 3024
- Cacciari et al. (2005) Cacciari, C., Corwin, T. M., & Carney, B. W. 2005, AJ, 129, 267
- Caputo et al. (1978) Caputo, F., Castellani, V., & Tornambe, A. 1978, A&A, 67, 107
- Carretta et al. (2009) Carretta, E., Bragaglia, A., Gratton, R., D’Orazi, V., & Lucatello, S. 2009, A&A, 508, 695
- Catelan et al. (2004) Catelan, M., Pritzl, B. J., & Smith, H. A. 2004, ApJS, 154, 633
- Clement et al. (2001) Clement, C. M., Muzzin, A., Dufton, Q., Ponnampalam, T., Wang, J., Burford, J., Richardson, A., Rosebery, T., Rowe, J., & Hogg, H. S. 2001, AJ, 122, 2587
- Clement & Shelton (1997) Clement, C. M. & Shelton, I. 1997, AJ, 113, 1711
- Clementini et al. (2019) Clementini, G., Ripepi, V., Molinaro, R., Garofalo, A., Muraveva, T., Rimoldini, L., Guy, L. P., Jevardat de Fombelle, G., Nienartowicz, K., Marchal, O., Audard, M., Holl, B., Leccia, S., Marconi, M., Musella, I., Mowlavi, N., Lecoeur-Taibi, I., Eyer, L., De Ridder, J., Regibo, S., Sarro, L. M., Szabados, L., Evans, D. W., & Riello, M. 2019, A&A, 622, A60
- Cohen & Sarajedini (2012) Cohen, R. E. & Sarajedini, A. 2012, MNRAS, 419, 342
- Deras et al. (2019) Deras, D., Arellano Ferro, A., Lázaro, C., Bustos Fierro, I. H., Calderón, J. H., Muneer, S., & Giridhar, S. 2019, MNRAS, 486, 2791
- Dworetsky (1983) Dworetsky, M. M. 1983, MNRAS, 203, 917
- Ferraro et al. (1993) Ferraro, F. R., Clementini, G., Fusi-Pecci, F., Vitiello, E., & Buonanno, R. 1993, MNRAS, 264, 273
- Fourcade & Laborde (1966) Fourcade, C. R. & Laborde, J. R. 1966, Atlas y Catálogo de Estrellas Variables en Cúmulos globulares al sur de -29∘, Cordoba, Argentina
- Gaia Collaboration et al. (2018) Gaia Collaboration, Brown, A. G. A., Vallenari, A., Prusti, T., de Bruijne, J. H. J., Babusiaux, C., Bailer-Jones, C. A. L., Biermann, M., Evans, D. W., Eyer, L., & et al. 2018, A&A, 616, A1
- Goldsbury et al. (2010) Goldsbury, R., Richer, H. B., Anderson, J., Dotter, A., Sarajedini, A., & Woodley, K. 2010, AJ, 140, 1830
- Guldenschuh et al. (2005) Guldenschuh, K. A., Layden, A. C., Wan, Y., Whiting, A., van der Bliek, N., Baca, P., Carlin, J., Freismuth, T., Mora, M., Salyk, C., Vera, S., Verdugo, M., & Young, A. 2005, PASP, 117, 721
- Harris (1996) Harris, W. E. 1996, AJ, 112, 1487
- Jurcsik & Kovács (1996) Jurcsik, J. & Kovács, G. 1996, A&A, 312, 111
- Kovács & Kanbur (1998) Kovács, G. & Kanbur, S. M. 1998, MNRAS, 295, 834
- Kovács & Walker (2001) Kovács, G. & Walker, A. R. 2001, A&A, 374, 264
- Kunder et al. (2013) Kunder, A., Stetson, P. B., Cassisi, S., Layden, A., Bono, G., Catelan, M., Walker, A. R., Paredes Alvarez, L., Clem, J. L., Matsunaga, N., Salaris, M., Lee, J.-W., & Chaboyer, B. 2013, AJ, 146, 119
- Laborde & Fourcade (1966) Laborde, J. R. & Fourcade, C. R. 1966, Mem. Soc. Astron. Italiana, 37, 251
- Lenz & Breger (2005) Lenz, P. & Breger, M. 2005, Communications in Asteroseismology, 146, 53
- Morgan et al. (2007) Morgan, S. M., Wahl, J. N., & Wieckhorst, R. M. 2007, MNRAS, 374, 1421
- Poretti et al. (2008) Poretti, E., Clementini, G., Held, E. V., Greco, C., Mateo, M., Dell’Arciprete, L., Rizzi, L., Gullieuszik, M., & Maio, M. 2008, ApJ, 685, 947
- Salaris et al. (1993) Salaris, M., Chieffi, A., & Straniero, O. 1993, ApJ, 414, 580
- Salinas et al. (2007) Salinas, R., Catelan, M., Smith, H. A., & Pritzl, B. J. 2007, Information Bulletin on Variable Stars, 5744
- Salinas et al. (2016) Salinas, R., Contreras Ramos, R., Strader, J., Hakala, P., Catelan, M., Peacock, M. B., & Simunovic, M. 2016, AJ, 152, 55
- Schlafly & Finkbeiner (2011) Schlafly, E. F. & Finkbeiner, D. P. 2011, ApJ, 737, 103
- Schlegel et al. (1998) Schlegel, D. J., Finkbeiner, D. P., & Davis, M. 1998, ApJ, 500, 525
- Stetson (2000) Stetson, P. B. 2000, PASP, 112, 925
- Sturch (1966) Sturch, C. 1966, ApJ, 143, 774
- VandenBerg et al. (2014) VandenBerg, D. A., Bergbusch, P. A., Ferguson, J. W., & Edvardsson, B. 2014, ApJ, 794, 72
- VandenBerg et al. (2013) VandenBerg, D. A., Brogaard, K., Leaman, R., & Casagrande, L. 2013, ApJ, 775, 134
- Wehlau & Demers (1977a) Wehlau, A. & Demers, S. 1977a, A&A, 57, 251
- Wehlau et al. (1977b) Wehlau, A., Flemming, T., Demers, S., & Bartolini, C. 1977b, Information Bulletin on Variable Stars, 1361
- Zinn & West (1984) Zinn, R. & West, M. J. 1984, ApJS, 55, 45