Jets, Bubbles, and Heat Pumps in Galaxy Clusters
Abstract
Feedback from AGN jets has been proposed to counteract the catastrophic cooling in many galaxy clusters. However, it is still unclear which physical processes are acting to couple the energy from the bi-directional jets to the ICM. We study the long-term evolution of rising bubbles that were inflated by AGN jets using MHD simulations. In the wake of the rising bubbles, a significant amount of low-entropy gas is brought into contact with the hot cluster gas. We assess the energy budget of the uplifted gas and find it comparable to the total energy injected by the jets. Although our simulation does not include explicit thermal conduction, we find that, for reasonable assumptions about the conduction coefficient, the rate is fast enough that much of the uplifted gas may be thermalized before it sinks back to the core. Thus, we propose that the AGN can act like a geothermal heat pump to move low-entropy gas from the cluster core to the heat reservoir and will be able to heat the inner cluster more efficiently than would be possible by direct energy transfer from jets alone. We show that the maximum efficiency of this mechanism, i.e. the ratio between the conductive thermal energy and the work needed to lift the gas, can exceed 100 per cent. While in realistic scenarios, AGN-induced thermal conduction has the potential to significantly increase the efficiency with which AGN can heat cool-core clusters and transform the bursty AGN activities into a smoother and enduring heating process.
keywords:
galaxies: clusters: intracluster medium — galaxies: jets — conduction — MHD — methods: numerical, analytical1 Introduction
The cores of galaxy clusters often exhibit strong x-ray emission with cooling times short compared to the cluster age, which should lead to substantial radiative cooling and the formation of a cooling flow (Fabian, 1994). The lack of cold gas in observations (Peterson et al., 2003; Peterson & Fabian, 2006) motivates the study of feedback processes that could counteract the cooling (McNamara & Nulsen, 2007; Fabian, 2012). Mechanical energy deposited by AGN jets could serve as the mechanism to regulate the thermal evolution of galaxy clusters (see McNamara & Nulsen, 2012, for review). Strong evidence supporting this mechanism includes X-ray observations of galaxy clusters, which often show radio-filled cavities that are likely inflated by jets from the supermassive black holes in the central galaxy (see e.g. Bîrzan et al., 2004). In many cases, multiple cavities, likely caused by episodic jet activity, are observed. The most detailed observations of this kind include the Perseus Cluster (Fabian et al., 2011) and M87 (Forman et al., 2007). Churazov et al. (2000) show that AGN jets have comparable power to offset the cooling in the Perseus Cluster. Observations of numerous other cool core clusters support this claim, but with large scatter in jet power (see e.g. Rafferty et al., 2006; McNamara & Nulsen, 2007; Hardcastle et al., 2019).
However, the processes through which the energy of AGN jets couples to the ICM are still uncertain. The highly directional nature of jets poses substantial difficulty to distribute their energy isotropically in the core of galaxy clusters (O’Neill & Jones, 2010). Fabian et al. (2017) argue that the dissipation of sound waves, which are visible as ripples in the x-ray observations, could heat the ICM. Heinz et al. (2006) and Morsony et al. (2010) show that large-scale motion of the cluster helps to disperse the energy from the AGN. Other possible mechanisms include turbulence (Zhuravleva et al., 2014), mixing (Hillel & Soker, 2016; Yang & Reynolds, 2015; Hillel & Soker, 2018), shocks (Fabian et al., 2006; Li et al., 2017), internal waves (Zhang et al., 2018), and cosmic ray streaming (Enßlin et al., 2011; Ehlert et al., 2018) among others.
Although most of the discussion of heating focuses on the direct energy coupling between the AGN output and the ICM, a few authors have alluded that the removal of the cool gas from the core of the cluster could possibly prevent catastrophic cooling. Yang & Reynolds (2016) point out that a “gentle circulation“ can help isotropize the heating from the weak shock and mixing that happens primarily in the jet cone. Uplifted gas trailing the bubbles was also noticed in simulations (Weinberger et al., 2017; Duan & Guo, 2018). Pope et al. (2010) calculate the amount of gas transported by a rising bubble and conclude that the mass transport by the bubble wake could prevent the core from overcooling.
Buoyantly rising bubbles are identified and studied by many works. Churazov et al. (2001) conduct hydrodynamic simulations of bubbles to model the radio and x-ray arms in M87. In a deep Chandra observation, Forman et al. (2007) detected many filamentary structures that could be associated with independent bubbles in M87. Wise et al. (2007) identify a series of cavities in the Hydra A cluster. Gendron-Marsolais et al. (2017) report observations of cool x-ray gas rims in NGC 4472 that could be gas lifted by the bubbles. Su et al. (2017) find the gas uplift rate is comparable to that expected to cool in low-mass Fornax cluster. These works all suggest that rising bubbles are prevalent and could bring gas from the core to the outskirt of the galaxy cluster.
Although thermal conduction is considered insufficient to offset the cooling in cool-core clusters by itself (Voigt & Fabian, 2004; Dolag et al., 2004), it still plays a vital role in the thermal state of the cluster, especially when perturbed by the rising bubble. In this work, we propose and investigate the effect of rising bubbles bringing low-entropy gas from the cool core to the hot outskirt of the galaxy cluster where thermal conduction is much more efficient. With this mechanism, the AGN could “heat” the ICM with an efficiency that can exceed 100 per cent, drawing on the excess heat contained in the outer cluster like a heat pump. This heating process is also more gentle than direct heating.
This work is organized as follows. We describe the methodology and techniques in Section 2. In Section 3, we present the results of the simulations, including the energy budget and the conduction rate estimates. We derive and calculate the efficiency of this mechanism in simplified profiles in Section 4. In Section 5 and 6, we discuss and summarize our findings.
2 Numerical Setup and Techniques
Here we describe the important and relevant details of the simulation. We conduct full 3D ideal MHD simulations using FLASH (Fryxell et al., 2000; Dubey et al., 2009) with the unsplit staggered mesh scheme (Lee, 2013) and AMR. We simulate the cluster as a spherically symmetric environment, tuned to match the properties of the cool-core Perseus Cluster following Zhuravleva et al. (2015). The density profile follows a -model
| (1) |
with g cm-3, kpc, . The temperature profile is set such that the core of the cluster is cooler than the outskirts, , with keV, keV and kpc. We assume monatomic gas in the cluster so that the adiabatic index = 5/3 and choose the mean molecular weight = 0.61. The cluster potential is assumed to be spherically symmetric and static throughout the simulations, neglecting changes in the gravitational potential due to the changes in gas density. The fixed gravitational potential is chosen so that the initial conditions are in hydrostatic equilibrium. Our simulations were set up to study a wide context of questions relating to jet and cluster physics that do not require magnetization of the ICM, so it was not included in the initial conditions of our simulations. The simulation box is Mpc with hydrostatic diode boundary condition (hydrostatic-f2+nvdiode in FLASH). The adaptive refinement criteria include the native second derivative based estimator and also a self-defined momentum-based condition that ensures that we resolve the jets at the highest resolution (30 pc). The jets are active at a constant jet power until 10 Myr. We restrict the maximum refinement level for the ICM further away from the center. To study the motion of the gas, we use Lagrangian tracer particles in FLASH (Dubey et al., 2012). Using density-weighting, we randomly distribute particles within a 150 kpc radius in the ICM. Thus, each particle represents approximately the same mass.
We set up a nozzle through which energy, momentum, and magnetic flux are injected into the simulation grid to model the jets from the central AGN. The magnetic pressure is in equilibrium with the thermal pressure in the nozzle, i.e. plasma =1. We further set the jet power ( erg s-1), jet speed (0.1c), nozzle radius (240 pc), and the internal Mach number (10), which sets the jet density. The magnetic field of the jet nozzle is set to be poloidal, i.e., parallel to the jet propagation direction111We also performed simulations with other topologies which are fully consistent with the results shown here, see Chen et al. in prep.. The jet is active for 10 Myr, during which it operates at constant power. The direction of the jet is set up to have a small angle ( 8 degrees) jittering to mimic the dentist’s drill effect seen in observations and inferred theoretically (Scheuer, 1982). After 10 Myr, the jet shuts off and the bubbles inflated by the jets continue to rise. For computational expediency, the highest resolution of the simulation is reduced to 120 pc shortly after turning off the jet (from 30 pc when the jet is active). Radiative cooling and explicit thermal conduction are not included in the simulation. We investigate the long-term impact of this one-time activity of the jets on the dynamical state of the galaxy cluster. Visualizations and profile analysis are performed with the python-based software package yt222http://yt-project.org/ (Turk et al., 2010).
3 Results
3.1 Motion of the low-entropy gas
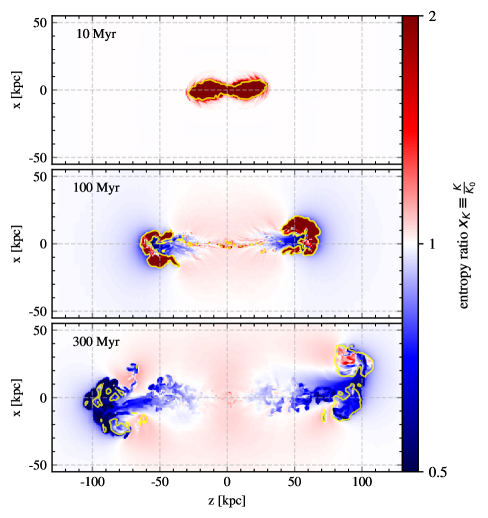
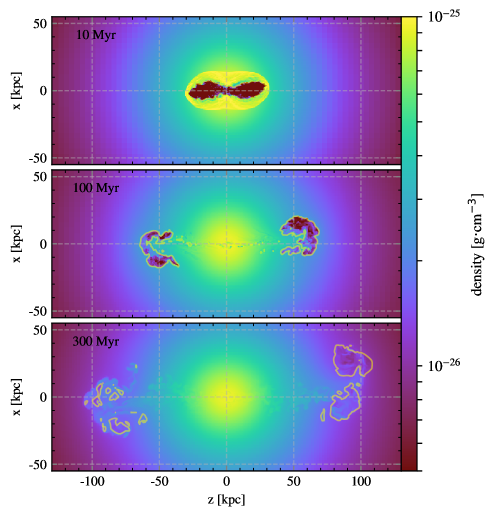
First, we investigate the lifting of the low-entropy gas by the rising bubbles. During the active phase of the AGN, only a small amount of gas is displaced by the jet. However, as the jet ceases and bubbles rise, they drag a significant amount of gas from the core in the wake. This phenomenon can be seen clearly in the entropy ratio maps. In Fig. 1, the specific entropy, defined as , of the gas at different times of the simulation is plotted relative to the entropy profile of the initial ICM conditions alongside the density slices. Since the entropy is conserved during adiabatic processes, the entropy ratio is a good indicator of the origin of the gas333We do have shocks in the simulation during the initial inflation of the cocoon, so some fraction of the gas undergoes non-adiabatic heating. Its entropy will be correspondingly raised.. An entropy ratio smaller than one shows the gas has been lifted radially outward, while an entropy ratio larger than one could mean that the gas has been moved inward or reveal the presence of the hot gas from the jet or the shocked cluster gas. When the jet is still active, at 10 Myr, only the very hot gas injected by the jets is visible in the entropy ratio map and the initial entropy profile of the ICM is almost unchanged. This anisotropic heating has been a challenge for invoking AGN feedback to counteract the strong x-ray cooling (O’Neill & Jones, 2010).
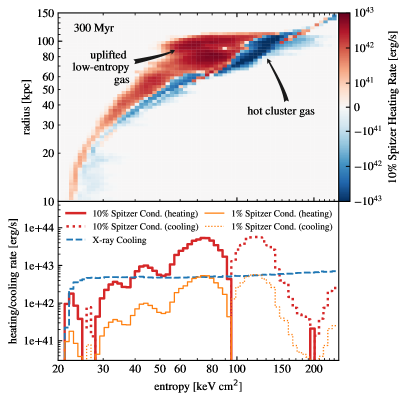
However, the bubbles keep rising due to both buoyancy and momentum injected by the jets. At 100 Myr (middle panel of Fig. 1), we can see there is lower-entropy gas pushed ahead of the bubbles as well as rising in their wakes. A slight increase of density can also be seen in the right panels of Fig. 1. However, due to the underlying density gradient of the cluster profile and the strong contrast between the bubble and ICM gas, it is not immediately obvious except in the bottom panel. The sphere inside the location of the bubble ( 50 kpc) shows a general increase of entropy because of the replenishment of the gas from larger radii. At 300 Myr (lower panel of Fig. 1), most of the hot gas injected by the jet is mixed–mostly numerically–with the ICM444It is important to note that we do not count the numerical mixing in our heating rate later on, as it is a purely numerical artifact.. The vortex generated by the bubble brings a notable amount of gas moving outward to large radii even further than the bubble. Only a small fraction of the hot gas is still visible as a ring surrounded by the lower-entropy gas. If there is no heat exchange between the high- and low-entropy gas, the low-entropy gas will eventually fall back to the core again. In Section 3.4, we argue that the conduction rate will increase when the low-entropy gas is brought into contact with the hot atmosphere, thus heating the gas efficiently before it sinks.
3.2 Percentage of gas lifted by the rising bubbles
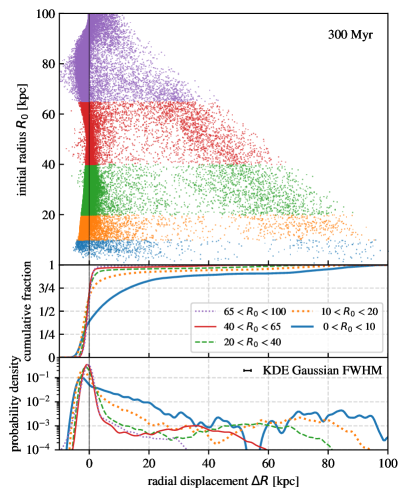
To quantify the amount of gas being lifted by the rising bubbles, we use tracer particles to track the movement of gas. The particles are distributed according to the density of the gas at the beginning of the simulation. Thus, each particle represents roughly the same mass of gas. The radial displacement of these particles at 300 Myr is shown in the upper panel of Fig. 2, in which we group them by their initial radii.
The distribution of the gas displaced by the bubbles can be identified in the middle and lower panel of Fig. 2. We group the particles by their initial radii and use the kernel density estimation with the Gaussian kernel width matching the initial average separation between particles. The same kernel is used for both the cumulative distribution and probability density function. The distribution can be viewed as the distribution of mass for the gas in different initial radii. We can see that a larger fraction of mass is lifted for the gas closer to the core. For the gas initially inside 10 kpc radius, about 15 per cent of the gas is lifted more than 20 kpc outward; for the gas in 10 to 20 kpc initial radii, the fraction is slightly less than 10 per cent. This is the effect at 300 Myr of the bubble inflated by the jet that is active for only 10 Myr. If there were additional episodes of jet activity, the fraction would be larger.
In Fig.2, we can also see the replenishment of the gas in the core. The negative in both the cumulative fraction and probability density indicates an inward motion due to the removal of low-entropy gas from the core. This motion gradually brings the higher-entropy gas from larger radii to the core. Note that the inflow and the outflow take place at different regions of the cluster – the outflow happens in the cone around the bubbles while the inflow occurs primarily outside the bubble cone.
3.3 Mass and energy budget of the low-entropy gas lifted by the rising bubble
We now investigate the mass of the low-entropy gas and the energy that could be extracted from the hot gas and transferred to the uplifted low-entropy gas by heat conduction. We identify gas with entropy ratio below various thresholds in the simulation. The evolution of the mass of the low-entropy is shown in the upper panel of Fig. 3. We then estimate the amount of energy needed to bring this gas into thermal equilibrium with its surroundings, assuming monatomic gas under constant pressure:
| (2) |
where is the mean molecular weight and is the difference between current and initial temperature of the gas at the same location.
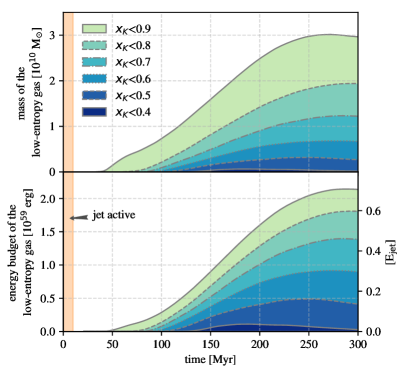
We use this upper limit as a proxy for the amount of thermal energy that could be absorbed by the uplifted low-entropy gas. The actual energy budget will obviously depend on the rate of thermal conduction, which will be discussed in Section 3.4, and the dynamic state of the cluster. The lower panel of Fig. 3 shows the evolution of this energy as a function of time with different values of . The vertical axis at the left labels the energy in [ergs], while at the right it denotes this energy relative to the total energy ( erg) injected during the active phase of the jet (10 Myr).
One can see that the conductive energy budget of the low-entropy gas is comparable to the total energy injected by the jet and reaches the peak value at around Myr. The value of naturally depends on the details of the system, including the density of the lobe and gravitational potential profile. However, it will likely be on the order of hundred million years, which is induced by the short active phase (10 Myr) of the jets. Thus, it may transform the bursty activities of the AGN into a much longer timespan and result in smoother heating of the cluster.
It is imperative to note that the heat exchange occurs between cluster gas, not with the very high-entropy relativistic plasma inside the bubble, which has a vanishingly small conduction coefficient. The estimated energy budget is not directly from the AGN itself, but from the hot atmosphere at large radii of the clusters, where the cooling time is longer than the Hubble time. When the cooler gas is brought into thermal contact with the hot reservoir, heat exchange can take place more efficiently than it could in a stratified cluster atmosphere. We discuss the rate of heat exchange in the next section.
3.4 Conductive heating rates
Next, we estimate the rate of thermal conduction between the uplifted low-entropy gas and the hot thermal bath. We consider the classic Spitzer conduction in ionized gas (Spitzer, 1962; Narayan & Medvedev, 2001). The Spitzer coefficient can be calculated as
| (3) |
The coefficient has a strong dependence on the temperature and, as a consequence, the conduction rate is slow in the cool core. However, once the cool gas is lifted to large radii and placed in close proximity to hot gas, high temperature and increased temperature gradient both accelerate the thermal conduction rate across the interface. The highly corrugated nature of the interface (cf. Fig. 1) further increases conduction compared to a stratified isotropic cluster. High-resolution simulations are critical to resolve this interface.
We then calculate the heat flux by
| (4) |
in which is the fraction relative to the classic Spitzer conduction rate and encapsulates various factors including the orientation of the magnetic fields and the plasma microphysics. Since we do not include magnetic fields in the initial ICM, it is impossible to include anisotropic conduction in this analysis. Instead, we conservatively use = 0.1 and 0.01, which is much lower than the typical value used in many studies, and express any findings in terms of Sp, the effective conductive coefficient in units of the Spitzer value so that results can readily be understood for a range of assumptions about conductivity. We further exclude regions where the jet mass fraction exceeds (cf. contours in Fig. 1) to avoid counting the heat exchange between the relativistic gas in the hot bubbles and the ICM, which is strongly suppressed. Note that we do not exclude the jet region explicitly in Section 3.3, since the selection of the low-entropy gas naturally does not incorporate the hot jet gas.
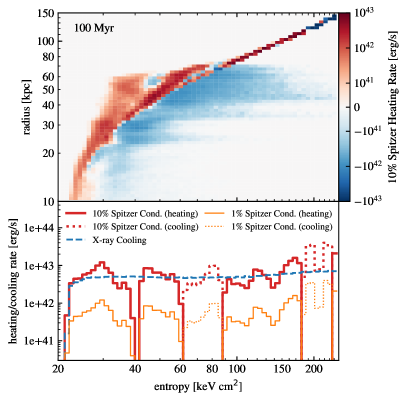
The instantaneous global heating and cooling rate due to conduction is calculated by taking the divergence of the heat flux. We then add the thermal conduction heating/cooling rates in each radial and entropy bin and compare them with the x-ray cooling rate in the marginal histogram at two different times in Fig. 4 and Fig. 5. We show two plausible conduction rates at 10% and 1% of the Spitzer value. The heat flux in galaxy clusters is likely far below the nominal Spitzer value, For example, a factor of 100 suppression is consistent with recent results from studies of the plasma physics of conduction (Roberg-Clark et al., 2018a).
One can see that at an earlier time in Fig. 4, the conductive heating rate at 10% Spitzer value does not yet overcome the x-ray cooling rate. At 300 Myr in Fig. 5, the heating rates can be close to the radiative cooling in some bins even at . The heating and cooling rate as a function of radius have much smaller values since most of the Spitzer heat flux happens between the high-entropy and the low-entropy gas at the same radius as shown in the upper panels in Fig. 4 and Fig. 5. Note that the heating and cooling rates in these figures are cluster-average quantities. While x-ray cooling is a global phenomenon, the conductive heating and cooling happen primarily around the uplifted gas. Thus, the net heating rate locally at the surface of the low-entropy gas is significant even at 1% of the Spitzer rate.
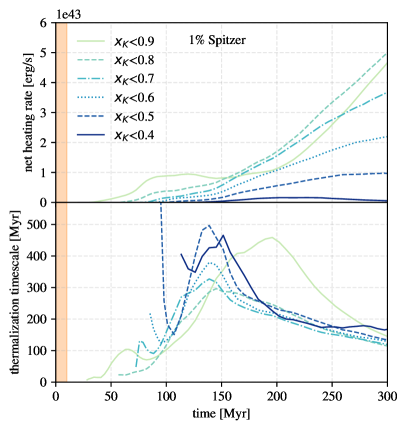
Although the microphysical details of the conduction deserve investigations in more depth, we find that thermal conduction will be able to bring the low-entropy gas to the temperature of the heat reservoir in a short amount of time. The heating rate increases significantly at later times, which is shown in Fig. 6, where we aggregate the net heating rate of the low-entropy gas for 1% Spitzer value and subtract the x-ray cooling rate. Most of the lower-entropy-ratio gas experiences net heating. However, at later times, cooling exceeds heating in the gas with entropy ratio between 0.8 and 0.9, which is indicated by the cumulative heating curve for crossing below the curve after 150 Myr.
We can also estimate the heating timescale from the energy budget and the corresponding net heating rate (lower panel of Fig. 6). The free-fall time at 100 kpc, where most of the low-entropy gas is located at the simulation time of 300 Myr, is about 150 Myr. At 1% of the Spitzer rate, the thermalization timescales are comparable or shorter than the free-fall time. As long as the lifted gas is thermalized before it falls back, the heat pump mechanism will be able to pull more energy than the AGN provided. In the discussion section, we will discuss the conduction rates in more details.
We perform the same calculation on a similar simulation with different jet magnetic field configuration and find the same conclusion. Locally, the conduction rate is slightly different due to different bubble shapes, but globally the energy budget remains much the same within 10 per cent.
4 The Maximum Possible Efficiency of the Cluster Heat Pump
In a traditional heat pump, energy is expended on performing mechanical work (compression or decompression) before the heat exchange stage. In geothermal heat pumps, energy is expended to move fluid against gravity. Our case is similar to a geothermal system in that work is done against net gravity.
The low-entropy gas is lifted against the net gravitational force towards the heat reservoir in order for thermal conduction to take place. Due to the buoyancy, lifting the gas from its original location, where the density is the same as the surroundings, requires almost no force. Once the gas is away from its original location, the density drops adiabatically. As long as the density profile of the cluster falls steeper than adiabatic, i.e. the ICM profile is sub-adiabatic, which is always true for convectively stable cool-core clusters, lifting the gas requires work. In this case, the temperature of the lifted gas is lower than the surroundings and allows thermal energy to transfer to the gas through conduction.
Here we consider the limiting efficiency of the heat pump, defined as the ratio between the thermal energy through conduction and the work needed to move the gas to a large radius, in a simplified case. We first consider the generic case where the temperature and density profiles of the ICM follow simple power-laws
| (5) |
where the index of the density corresponds to in the -model outside of the core in Eq. 1. When , this represents an isothermal atmosphere; for cool-core clusters, . The pressure then follows the ideal gas law
| (6) |
We also assume the ICM is in hydrostatic equilibrium
| (7) |
which gives us the condition that for negative pressure gradient and the scaling of the gravitational acceleration
| (8) |
In the limiting case of slow lift of a blob of gas, we can neglect the kinetic energy of the blob. When the gas is lifted away from its original location, it will expand to be in pressure balance with the surroundings. The net gravitational force acting on the gas is
| (9) |
Assuming the gas expands adiabatically, we have the scaling of the volume
| (10) |
and the density
| (11) |
The net gravitational force can then be written as
| (12) | ||||
where is the mass of the lifted gas. The work needed to lift the gas from to is the integral of the force
| (13) | ||||
where we changed variables to and call the lifting radius ratio .
When the gas is lifted, its temperature is lower than the surroundings
| (14) |
and the thermal energy necessary to themalize the gas when it is lifted to is
| (15) | ||||
where the hydrostatic equilibrium and the ideal gas law imply
| (16) |
The efficiency of the heat pump can then be expressed as
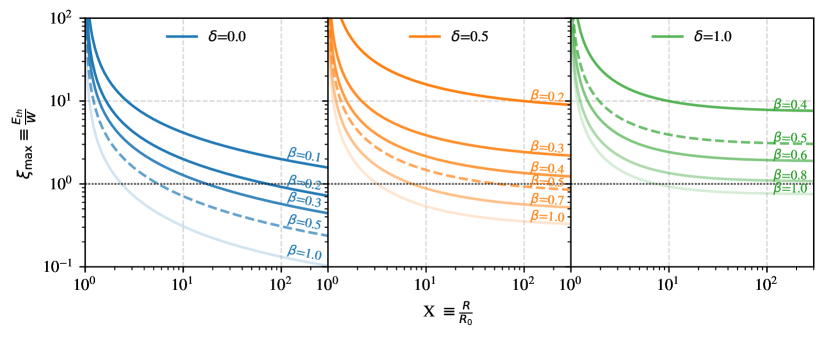
| (17) | ||||
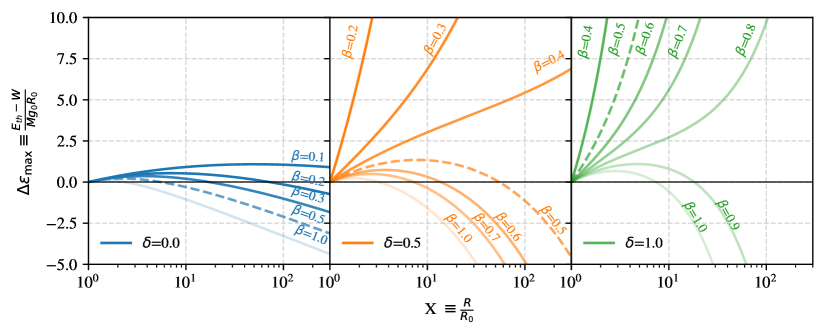
where . We plot the efficiency for several cases of and in Fig. 7. Note that the efficiency is largest at small because of the near-zero work needed to lift the gas around its original location. The gravitational energy is invested in lifting the gas upward and will not be recovered if the gas is thermalized before it sinks back. In the case of large lift, i.e. , the limiting efficiency becomes
| (18) |
For monatomic gas, , the limiting efficiency is larger than 100 per cent for large when
| (19) |
In Fig. 7, we can see that the heat pump mechanism operates optimally when the temperature gradient is large (large ) or when the density gradient is small (small ) such that lifting the gas requires very little work. Although the efficiency is larger at small , the absolute thermal energy gain is small. We can further consider the energy gain of the mechanism normalized by the initial gravitational energy
| (20) | ||||
We show the energy gain for various and in Fig. 8. For , the curves diverge to infinity, i.e. more thermal energy is available for more lift. For , there is an optimal lift that maximize the energy gain. Considering the temperature gradient of the cluster is only positive from the cool core to the hot atmosphere, it is unlikely that this mechanism will get infinite thermal energy from large radial change. Instead, there will be an optimal lift that the energy gain is maximized depending on the profile of the cluster.
Since the AGN expends energy on other aspects not included here (namely, the kinetic and internal energy of the jets/lobes, and kinetic energy of the lifted gas), the true efficiency is and the energy gain is . This method works as long as positive heat exchange is possible, i.e. the temperature gradient being shallower than the adiabatic gradient, , which is the criterion for convective stability.
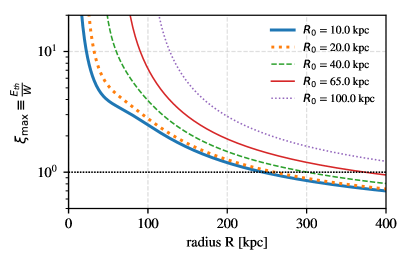
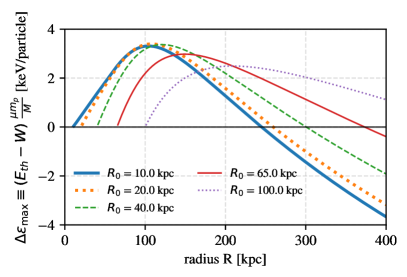
For a more realistic background profile like the one used in our simulation of the Perseus cluster (sec Section 2), we can integrate the work and calculate the conductive thermal energy numerically, which is shown in Fig. 9 for efficiency and Fig. 10 for energy gain. Various initial radii are included in the calculation. We can see that a lift of a few tens of kpc, as observed with the simulations, can provide for a high limiting efficiency and a large energy gain. This radius corresponds to the final distance of the bubbles from the cluster center in our simulation, as well as the locations of x-ray bubbles in many observations (Bîrzan et al., 2004; Shin et al., 2016).
In Fig. 10, we can see lifting the low-entropy gas can provide up to an additional 3 keV of energy per particle. Thus, moving can generate additional erg of thermal energy from the heat pump mechanism as we estimate from the simulation in Section 3.3.
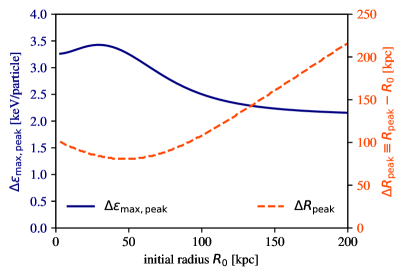
Now we can find the peak energy gain for different initial radii in Fig. 10 and the corresponding change in radius, which is shown in Fig. 11. We see that for small initial radius, the peak energy gain is larger and also requires less lifting. For large initial radius, where the temperature profile tends to be isothermal, the increases linearly, i.e. constant , and the energy gain becomes constant, i.e. constant . Again, we see that the optimal operating range of the heat pump mechanism is to lift the gas from the cool core to the hot atmosphere of the cluster.
For other observed groups and galaxies, the best fit -model usually gives in the range between 0.3 and 0.7 (Mulchaey et al., 2003; McCarthy et al., 2004; Dong et al., 2010; O’Sullivan et al., 2017), including the Perseus Cluster modeled in our simulation. Most of their temperature profiles do not follow a simple power law, but increase from the cool core to the outskirt and becomes near isothermal at large radii. Thus, the heat pump operates best across the temperature gradient around the cluster core where the heating is essential for the cluster.
5 Discussion
5.1 The conduction rate and energy budget
In the literature, adiabatic uplift is usually deemed ineffective to offset the cooling because the lifting of gas only decreases the cooling time by a factor of few (see McNamara & Nulsen, 2012, for review). However, in our scenario, even though the uplift process is adiabatic, the gas will be heated by the hot atmosphere of the cluster due to the increased conduction coefficient and temperature gradient. The thermalization timescale based on 1% Spitzer value in Fig. 6 suggests that the low-entropy gas might not have enough time to be heated during the uplift, but will eventually be heated before sinking. The energy budget estimated from the simulation in Fig. 3 provides a rough estimation of the available energy through this mechanism. The actual energy budget depends on various factors, including the conduction rate, the efficiency of lifting, and the cluster profile. We show in this work that this effect can be significant and should not be ignored when analyzing the thermal balance of clusters.
Anisotropic thermal conduction has been widely discussed in the context of galaxy clusters. Kannan et al. (2017) pointed out that anisotropic thermal conduction could enhance the energy coupling between the AGN and the ICM through more effective mixing. In this work, we focus on the additional heating channel between high- and low-entropy cluster gas facilitated by the long-lived rising bubbles, rather than the direct heating from the bubbles themselves.
We caution that the calculation in Section 3.4 is likely an overestimate due to the following reasons: (a) Our simulation does not have explicit thermal conduction, and the estimated rate is based on the distribution of the gas without prior heat exchange (except for numerical mixing). Once thermal conduction takes place, the sharp temperature gradient will quickly smooth out and the rate will drop roughly as . (b) Heat flux might be significantly suppressed by magnetic field geometry and microscopic plasma instabilities in the cluster gas (Roberg-Clark et al., 2016, 2018b). Although we include magnetic fields in the injection of the jets, the ICM is not magnetized in our simulations. Thus, it is impossible to estimate the effect of anisotropic conduction between the low-entropy gas and the hot atmosphere.
However, we argue that these uncertainties do not change our major finding that the heat pump mechanism is able to provide additional energy to the AGN feedback loop. The total energy budget estimated in Section 3.3 and the efficiency in Section 4 should not change significantly due to the uncertainties in the conduction rate provided that the thermalization can happen before the sinking of the low-entropy gas. As long as the heating timescale is shorter than the free-fall time (), our mechanism works, which leaves a lot of room even if the conduction coefficient is much smaller than Spitzer. We will leave the investigation of the anisotropic conduction effect and the interplay between the conduction rate and the total energy budget to future work.
Even if the conduction rate at an earlier time is substantial and the gas is thermalized before it reaches the largest radius, the upward motion triggered by the rising bubble can still bring the already thermalized gas to larger radii. Indeed, we show in Section 4 that the heat pump operates at very high efficiency around the initial radius (X 1). This is due to the minimal work needed to lift the gas with the same density as the surroundings. Thus, the bubble might be able to bring more gas to large radii if the gas was thermalized before reaching the final location.
The amount of the uplifted low-entropy gas, nevertheless, might change depending on the integrity of the bubble while it rises. Pure hydrodynamic bubbles have been suggested to be quickly disrupted by instabilities (Diehl et al., 2008). Thus, most of the bubbles associated with x-ray cavities may be supported by magnetic fields or require other mechanisms to suppress the instabilities. Some research suggests that the stability of the bubbles might be affected more by the surrounding magnetic field than by the field inside the bubbles (Ruszkowski et al., 2007; Dursi & Pfrommer, 2008). How the amount of lifted low-entropy gas depends on the dynamics of the bubble and the internal or external field, will require further research.
5.2 Effect of mixing
Some recent studies identify mixing (between the bubble plasma and the cluster gas) as the primary heating mechanism (Yang & Reynolds, 2015; Li et al., 2017). Whether mixing is a major mechanism requires further studies (see Hillel & Soker, 2016, 2018). It is important to note, however, that the effect of the thermal conduction is only evident in simulations with high spatial resolution. In resolution-limited simulations, both the hot gas from the bubbles and the low entropy gas lifted in their wake is quickly mixed with the ICM and unrealistic numerical mixing leads to quick dissipation of the bubble and increased heating of low-entropy uplifted gas. The amount of lifted low-entropy gas is likely reduced due to the bubbles being prematurely mixed and dispersed numerically. High resolution is important also because conduction is strongly increased by the corrugated surface of the uplifted gas and turbulence keeps re-arranging the interface between low- and high- temperature gas, regenerating the hot-cold interface and keeping gradients large for large heating rate (see Fig.1).
On the other hand, our simulation probably still underestimates the level of turbulent mixing due to numerical viscosity. Such mixing between low-entropy and hot cluster gas, however, would help to bring cold and hot gas into contact and therefore increase the heat transfer rate. This strengthens our argument that the low-entropy gas can be heated before falling back to the core.
5.3 Multiphase filaments
Multiphase filaments in H, x-ray, and molecular lines, are often observed in galaxy clusters (see e.g. Fabian et al., 2003; Lim et al., 2012; McNamara et al., 2014). Some observations (Vantyghem et al., 2016; Russell et al., 2016; Vantyghem et al., 2018) and simulations (Revaz et al., 2007; Li & Bryan, 2014) suggest that the filaments are formed in-situ from the entrained cold gas lifted by the bubbles. Our simulations do not include the formation of the filaments as the entropy reservoir of the uplifted gas in our simulations corresponds to a different ICM phase. The magnetic field in the wake might indeed prevent evaporation by thermal conduction of the H filaments (Ruszkowski et al., 2007). However, the existence of the filaments may be suggestive of efficient up-lift. Regardless, there is no way to generally avoid uplift of cold gas by jet-inflated bubbles.
While our results suggest that the conduction rate between the hot atmosphere and the lifted low-entropy gas could be substantial, our simulations do not exclude the formation of the filaments since they involve more physics that were not modeled in our work. The H filaments could be a much smaller volume where thermal instability takes place and thus consistent with the stimulated condensation scenario (McNamara et al., 2016). Locally, cooling can become catastrophic in this scenario, as a detailed local balance between heating and cooling is not provided by the heat pump mechanism, which regulates the cluster on a global scale. Rapidly cooling gas clumps will sink to the gravitational center of the cluster, where they are most easily captured by the drag of the rising bubbles.
5.4 Implication of the heat pump mechanism
In our simplified simulation, we study the long-term effect of a single AGN outburst. The proper balance between heating and cooling is not the main goal of this work since it is impossible to counteract the cooling of the cluster for 300 Myr with just one episode of AGN activity. It has been a question how the “bursty” AGN events can regulate the constant radiative cooling (Best et al., 2007). The process discussed in this work suggests a solution to this problem by transforming the bursty nature of AGN into a much more gentle heating process. Not only can the AGN heat the ICM during the active phase, but the rising bubbles enable conduction between the hot atmosphere and the uplifted cool gas. It can also help to explain the scatter of the jet power seen in the observations relative to the cluster cooling power since this mechanism does not require a close instantaneous balance between jet power and the cooling rate.
By bringing gas of different entropy into close thermal contact, the AGN essentially acts as a heat pump. The energy used to heat the low-entropy gas is drawn from the thermal base of the outer cluster, not the jet power. In this way, the heating efficiency of AGN can exceed 100 per cent, as slow and subsonic exchange of gas can be done adiabatically. We show that the thermal energy in many cases exceeds the work needed to bring the low-entropy gas to large radii in Section 4.
The feedback loop of the heat pump is, like the traditional AGN feedback, governed by the cooling within the cluster core that stimulates the AGN activities. In the short term, other mechanisms may still be required to help counteract the rapid cooling in the core if there were no previous episodes of AGN bubbles. Once the rising bubbles are established, they will be able to remove part of the cooled gas from the core and regulate the cooling in a long timescale and with more energy than injected by the jets itself. This will likely change the necessary duty cycle to balance the radiative cooling in AGN feedback.
6 Conclusions
We consider the idea that AGN jets could act as a “heat pump” by inflating buoyant bubbles that lift low-entropy gas from the core into thermal contact with the surrounding hot gas. The increased temperature gradients and conduction coefficient accelerate the thermal exchange between the hot atmosphere and the lifted gas. The AGN in this scenario does not heat the cluster core directly; rather it creates a pipeline which allows the energy exchange between the heat reservoir and the cool core. In this mechanism, the total available energy gained by the cluster core to offset the radiative cooling is not simply limited by the total energy output of the AGN, but also the heat transferred from the hot gas at large radii of the cluster to the uplifted low-entropy gas. Our analysis implies that a 10-Myr active jet could still affect the thermal state of the cluster after 300 Myr. This mechanism has the advantage that bursty AGN activity is transformed into a more gentle and longer-lasting heating process. In this work, we demonstrate that
-
1.
Jet-inflated bubbles can bring a significant amount of low-entropy gas to large radii. The removal of the cool gas from the core is seen mostly in the wake of the rising bubbles. Higher-entropy gas replaces the lifted low-entropy gas. Repeated AGN cycles can thus likely induce sufficient circulation to affect gas not aligned with the jet axis.
-
2.
The energy budget that can be drawn from the heat reservoir to the low-entropy gas is comparable to the energy input from the jet. This energy budget reaches a maximum when the bubbles are already mostly disrupted.
-
3.
The large thermal conduction rate at later times suggests low-entropy gas can be thermalized before sinking back even at 1% of Spitzer conduction rate. Uncertainties and open questions regarding the nature of thermal transport in the intracluster plasma motivate further work to explore this proposed mechanism.
-
4.
The efficiency of the heat pump, defined as the ratio between the thermal energy transferred and the work needed to lift the low-entropy gas, could be greater than 100 per cent in many cases. Even if the efficiency is not larger than 100 per cent asymptotically, the energy gain will still be positive for moderate lift and will work in concert with any other forms of dissipation of jet energy.
We want to bring attention to the heat exchange between the uplifted gas and the hot atmosphere through this exploratory work inspired by the long-term evolution of our simplified numerical experiment. In addition to heating the core itself, the AGN could act as a facilitator in cool-core systems and exchange energy from the hot atmosphere. To investigate this heat-pump mechanism rigorously, we will need the simulations to include effects like radiative cooling and anisotropic thermal conduction and also consider the integrity of the bubbles. Our preliminary analysis nonetheless indicates that this process can provide another avenue in the already hotly debated cooling flow problem.
Acknowledgement
We thank the anonymous referee’s insightful and detailed feedback that greatly improves this work. YC and SH would like to acknowledge support from NASA through the Astrophysics Theory Program grant NNX17AJ98G. This work used the Extreme Science and Engineering Discovery Environment (XSEDE) Stampede at the Texas Advanced Computing Center at The University of Texas at Austin and the HPC Cluster at the Center for High Throughput Computing at the University of Wisconsin-Madison. Support for this research was provided by the Office of the Vice Chancellor for Research and Graduate Education at the University of Wisconsin-Madison with funding from the Wisconsin Alumni Research Foundation. A part of this work was presented in IAU Symposium 342: Perseus in Sicily: from black hole to cluster outskirts and was included in the Proceedings.
References
- Best et al. (2007) Best P. N., Von Der Linden A., Kauffmann G., Heckman T. M., Kaiser C. R., 2007, MNRAS, 379, 894
- Bîrzan et al. (2004) Bîrzan L., Rafferty D. A., McNamara B. R., Wise M. W., Nulsen P. E. J., 2004, ApJ, 607, 800
- Churazov et al. (2000) Churazov E., Forman W., Jones C., 2000, A&A, 356, 788
- Churazov et al. (2001) Churazov E., Bruggen M., Kaiser C. R., Bohringer H., Forman W., 2001, ApJ, 554, 261
- Diehl et al. (2008) Diehl S., Li H., Fryer C., Rafferty D., 2008, ApJ, 687, 173
- Dolag et al. (2004) Dolag K., Jubelgas M., Springel V., Borgani S., Rasia E., 2004, ApJ, 606, L97
- Dong et al. (2010) Dong R., Rasmussen J., Mulchaey J. S., 2010, ApJ, 712, 883
- Duan & Guo (2018) Duan X., Guo F., 2018, ApJ, 861, 106
- Dubey et al. (2009) Dubey A., Antypas K., Ganapathy M. K., Reid L. B., Riley K., Sheeler D., Siegel A., Weide K., 2009, Parallel Computing, 35, 512
- Dubey et al. (2012) Dubey A., Daley C., Zuhone J., Ricker P. M., Weide K., Graziani C., 2012, ApJS, 201, 27
- Dursi & Pfrommer (2008) Dursi L. J., Pfrommer C., 2008, ApJ, 677, 993
- Ehlert et al. (2018) Ehlert K., Weinberger R., Pfrommer C., Pakmor R., Springel V., 2018, MNRAS, 481, 2878
- Enßlin et al. (2011) Enßlin T. A., Pfrommer C., Miniati F., Subramanian K., 2011, A&A, 527, A99
- Fabian (1994) Fabian A. C., 1994, ARAA, 32, 277
- Fabian (2012) Fabian A. C., 2012, ARAA, 50, 455
- Fabian et al. (2003) Fabian A. C., Sanders J. S., Crawford C. S., Conselice C. J., Gallagher J. S., Wyse R. F. G., 2003, MNRAS, 344, L48
- Fabian et al. (2006) Fabian A. C., Sanders J. S., Taylor G. B., Allen S. W., Crawford C. S., Johnstone R. M., Iwasawa K., 2006, MNRAS, 366, 417
- Fabian et al. (2011) Fabian A. C., et al., 2011, MNRAS, 418, 2154
- Fabian et al. (2017) Fabian A. C., Walker S. A., Russell H. R., Pinto C., Sanders J. S., Reynolds C. S., 2017, MNRAS, 464, L1
- Forman et al. (2007) Forman W., et al., 2007, ApJ, 665, 1057
- Fryxell et al. (2000) Fryxell B., et al., 2000, ApJS, 131, 273
- Gendron-Marsolais et al. (2017) Gendron-Marsolais M., et al., 2017, ApJ, 848, 26
- Hardcastle et al. (2019) Hardcastle M. J., et al., 2019, A&A, 622, A12
- Heinz et al. (2006) Heinz S., Briiggen M., Young A., Levesque E., 2006, MNRAS, 373, L65
- Hillel & Soker (2016) Hillel S., Soker N., 2016, MNRAS, 455, 2139
- Hillel & Soker (2018) Hillel S., Soker N., 2018, Research in Astronomy and Astrophysics, 18, 081
- Kannan et al. (2017) Kannan R., Vogelsberger M., Pfrommer C., Weinberger R., Springel V., Hernquist L., Puchwein E., Pakmor R., 2017, ApJ, 837, L18
- Lee (2013) Lee D., 2013, Journal of Computational Physics, 243, 269
- Li & Bryan (2014) Li Y., Bryan G. L., 2014, ApJ, 789, 153
- Li et al. (2017) Li Y., Ruszkowski M., Bryan G. L., 2017, ApJ, 847, 106
- Lim et al. (2012) Lim J., Ohyama Y., Chi-Hung Y., Dinh-V-Trung Shiang-Yu W., 2012, ApJ, 744, 112
- McCarthy et al. (2004) McCarthy I. G., Balogh M. L., Babul A., Poole G. B., Horner D. J., 2004, ApJ, 613, 811
- McNamara & Nulsen (2007) McNamara B., Nulsen P., 2007, ARAA, 45, 117
- McNamara & Nulsen (2012) McNamara B. R., Nulsen P. E. J., 2012, New Journal of Physics, 14, 055023
- McNamara et al. (2014) McNamara B. R., et al., 2014, ApJ, 785, 44
- McNamara et al. (2016) McNamara B. R., Russell H. R., Nulsen P. E. J., Hogan M. T., Fabian A. C., Pulido F., Edge A. C., 2016, ApJ, 830, 79
- Morsony et al. (2010) Morsony B. J., Heinz S., Brüggen M., Ruszkowski M., 2010, MNRAS, 407, 1277
- Mulchaey et al. (2003) Mulchaey J. S., Davis D. S., Mushotzky R. F., Burstein D., 2003, ApJS, 145, 39
- Narayan & Medvedev (2001) Narayan R., Medvedev M. V., 2001, ApJ, 562, L129
- O’Neill & Jones (2010) O’Neill S. M., Jones T. W., 2010, ApJ, 710, 180
- O’Sullivan et al. (2017) O’Sullivan E., et al., 2017, MNRAS, 472, 1482
- Peterson & Fabian (2006) Peterson J. R., Fabian A. C., 2006, Physics Reports, 427, 1
- Peterson et al. (2003) Peterson J. R., Kahn S. M., Paerels F. B. S., Kaastra J. S., Tamura T., Bleeker J. A. M., Ferrigno C., Jernigan J. G., 2003, ApJ, 590, 207
- Pope et al. (2010) Pope E. C. D., Babul A., Pavlovski G., Bower R. G., Dotter A., 2010, MNRAS, 406, 2023
- Rafferty et al. (2006) Rafferty D. A., McNamara B. R., Nulsen P. E. J., Wise M. W., 2006, ApJ, 652, 216
- Revaz et al. (2007) Revaz Y., Combes F., Salomé P., 2007, A&A, 477, L33
- Roberg-Clark et al. (2016) Roberg-Clark G. T., Drake J. F., Reynolds C. S., Swisdak M., 2016, ApJ, 830, L9
- Roberg-Clark et al. (2018a) Roberg-Clark G. T., Drake J. F., Reynolds C. S., Swisdak M., 2018a, Physical Review Letters, 120, 035101
- Roberg-Clark et al. (2018b) Roberg-Clark G. T., Drake J. F., Swisdak M., Reynolds C. S., 2018b, ApJ, 867, 154
- Russell et al. (2016) Russell H. R., et al., 2016, MNRAS, 458, 3134
- Ruszkowski et al. (2007) Ruszkowski M., Enßlin T. A., Brüggen M., Heinz S., Pfrommer C., 2007, MNRAS, 378, 662
- Scheuer (1982) Scheuer P. A. G., 1982, In: Extragalactic radio sources; Proceedings of the Symposium, pp 163–165
- Shin et al. (2016) Shin J., Woo J.-H., Mulchaey J. S., 2016, ApJS, 227, 31
- Spitzer (1962) Spitzer L., 1962, Physics of Fully Ionized Gases, 2nd editio edn. Interscience
- Su et al. (2017) Su Y., Nulsen P. E. J., Kraft R. P., Forman W. R., Jones C., Irwin J. A., Randall S. W., Churazov E., 2017, ApJ, 847, 94
- Turk et al. (2010) Turk M. J., Smith B. D., Oishi J. S., Skory S., Skillman S. W., Abel T., Norman M. L., 2010, MNRAS, 423, 3018
- Vantyghem et al. (2016) Vantyghem A. N., et al., 2016, ApJ, 832, 148
- Vantyghem et al. (2018) Vantyghem A. N., et al., 2018, ApJ, 863, 193
- Voigt & Fabian (2004) Voigt L. M., Fabian A. C., 2004, MNRAS, 347, 1130
- Weinberger et al. (2017) Weinberger R., Ehlert K., Pfrommer C., Pakmor R., Springel V., 2017, MNRAS, 470, 4530
- Wise et al. (2007) Wise M. W., McNamara B. R., Nulsen P. E. J., Houck J. C., David L. P., 2007, ApJ, 659, 1153
- Yang & Reynolds (2015) Yang H. Y. K., Reynolds C. S., 2015, ApJ, 818, 181
- Yang & Reynolds (2016) Yang H. Y. K., Reynolds C. S., 2016, ApJ, 829
- Zhang et al. (2018) Zhang C., Churazov E., Schekochihin A. A., 2018, MNRAS, 478, 4785
- Zhuravleva et al. (2014) Zhuravleva I., et al., 2014, Nature, 515, 85
- Zhuravleva et al. (2015) Zhuravleva I., et al., 2015, MNRAS, 450, 4184