Development of Hydrogen and Helium Proximity Zones around Quasars
Abstract
Increasing evidence suggests that He II proximity profiles in the quasar spectra at are sensitive probes of quasar ages. But the development of their H I counterparts is difficult to trace and remains poorly constrained. We compare the UV spectra of 15 He II quasars with their high-resolution optical counterparts and find a significant correlation between the sizes of He II and H I proximity zones. The luminous quasar HE23474342 displays a null proximity zone in both He II and H I, suggesting that it is extremely young (age Myr). Three other quasars also display small proximity zones for He II and H I. There is no evidence that a H I ionization zone expands considerably faster than its He II counterpart. The results suggest that the expansion of quasar ionizing fronts may be noticeably slower than the speed of light, and raise the possibility of distinguishing young and old quasars from the sizes of their H I proximity zones.
1 INTRODUCTION
The reionization of intergalactic helium took place at redshift as the result of increasing quasar activities. The powerful radiation of quasars creates high-ionization zones in their vicinity, and these “cosmic bubbles” can be traced with proximity profiles of absorption (Zheng & Davidsen, 1995; Zheng et al., 2015; Khrykin et al., 2016) at radial distances of up to Mpc (proper distance, for all the distances throughout the paper). The large extent of proximity zones suggests that this expansion takes a long time, on the order of million years, as a huge amount of high-energy photons are needed for ionizing helium over a vast space. Gradually, the expansion of ionizing front slows down at large distances as the quasar flux is geometrically diluted and photon-limited.
After a quasar is turned on, the expansion of its ionization zones takes place in both H I and He II, and the former is believed to propagate faster as intergalactic hydrogen has been largely ionized at . Nevertheless it would take a significant amount of time, on the order of million years, for the light signal to travel over a distance of many Mpc. The term of quasar age as discussed in this paper means the part of a quasar’s lifetime during which it provides the ionizing photons for the proximity zones. While it looks plausible that the sizes of proximity zones bear the signature of quasar ages, the possibility becomes complicated as the observed proximity effect along a line of sight may be considerably larger than the intrinsic one for a given quasar age. For hydrogen, it is believed that the propagation front expands near the speed of light, as the surrounding hydrogen has been highly ionized. As viewed along a line of sight, the expansion rate is magnified (White et al., 2003). Some models (Bolton & Haehnelt, 2007; Lu & Yu, 2011; Khrykin et al., 2016) adopt an infinite speed, thus ruling out the possibility of using H I zone sizes to scale quasar ages. If that is the case, young quasars at that display small or null proximity zones in He II would show a full-sized H I proximity effect. In this paper we attempt to address whether the H I proximity zones at carry information on quasar ages.
Given the flux of metagalactic UV background (UVB) radiation field (Bolton et al., 2005) and a nominal quasar luminosity above 1 Ry of , the size of a H I proximity zone is Mpc at . For a luminous quasar such as HS1700+6416, its zone size would be over 20 Mpc. For He II, the estimated proximity-zone sizes are sensitive to redshifts and less certain, but probably larger than their H I counterparts as the He II-ionizing UVB was rapidly developing. Indeed, the measurements of He II proximity zones cover a significant range. Increasing evidence (Shull et al., 2010; Syphers & Shull, 2013; Zheng et al., 2015; Khrykin, Hennawi, & Worseck, 2019) suggests that some quasars show quite small He II proximity zones, implying that they are likely young quasars that have not yet built significant high-ionization zones in their vicinity. If the H I front travels at the speed of light, a H I proximity zone of a young quasar along the line of sight should display a full size of Mpc, according to current models.
2 DATA
Our sample consists of 15 quasars whose He II (UV) and H I (optical, high-resolution) spectra are available. The redshift ranges are between and . The quasars at are excluded because of strong geocoronal Ly contamination on the redshifted He II Ly in the UV data. The data of a few other quasars are not used because of too low signal-to-noise (S/N) ratios. All the archival UV spectra were obtained with the HST/COS instrument, except for PKS1935692 (GHRS). Spectra taken in multiple exposures are rebinned and then combined. The bin size is 0.05 Å for COS/G130M grating, 0.32 Å for COS/G140L and 0.14 Å for GHRS/G140L. The He II proximity-zone sizes of 13 quasars in the sample were reported in Zheng et al. (2015), and that of PC0058+0215 in Worseck et al. (2016) and Q23111417 in Khrykin, Hennawi, & Worseck (2019). We remeasure these He II proximity-zone sizes at the shortest wavelengths where the proximity profile drops to 10% of the unattenuated flux level (except for HS1700+6416, see §3.2), and the results are consistent with the previously reported values. For HS1700+6416 and SDSS23460016, their He II proximity profiles are affected by geocoronal airglow emission, therefore their spectra were extracted from the portion of orbital night, using standard calcos pipeline (Hodge, 2011).
The Keck/HIRES spectra of seven quasars are retrieved from the Keck archive and the VLT/UVES spectra of eight quasars are retrieved from the ESO archive. These optical spectra cover a wavelength range in the rest frame from 1250 Å down to at least 1135 Å. All the optical spectra are obtained in the form of extracted spectra, except for HE23474342 in which a normalized UVES spectrum (Zheng et al., 2004) is in hand. The archival HIRES data have a gap between and 5247 Å, and the UVES data between and 5222 Å. These gaps affect a small portion of the wavelength coverage at . Normalized Keck/HIRES spectra for several quasars are available from the KODIAQ database (O’Meara et al., 2017). Table 1 lists the quasar redshifts, their data sources and exposure times.
The optical spectra of different orders and exposures are rebinned to a pixel scale of 0.05 Å and combined. Absorption features are identified and measured through local troughs and continua after data smoothing by 5 pixels. Depending on data quality, the detection limits vary from an equivalent width (EW) of to 0.03 Å in the restframe (and hereafter unless stated otherwise). The spectral regions free of absorption lines are fitted with high-order polynomials, and a normalized spectrum is produced. Note that our EW measurements of absorption features are not sensitive to this normalization process. In the UV data, if more than one dataset exists, they are rebinned and then combined. The data points longward of the He II lya wavelength are fitted with a power law and a reddening curve with a E(B-V) value (Schlafly & Finkbeiner, 2011) and a reddening curve of (Cardelli, Clayton & Mathis, 1989), in order to normalize a UV spectrum.
In the optical H I spectra at , Ly forest lines are not strong enough to form a continuous absorption profile, and the proximity effect is reflected as a decline of absorption-line numbers toward the Ly wavelength (Bajtlik, Duncan & Ostriker, 1988). Not all absorption lines respond sensitively to enhanced ionizing radiation as strong Ly lines are saturated. According to the curve of growth at a nominal Doppler parameter of , only the EW of Ly lines at 0.2 Å (column density ) decreases inversely with an increasing ionizing flux. Therefore our study of the H I proximity effect only includes the Ly absorption lines of EW Å. Metal absorption lines are identified by ratios of their doublet wavelengths and narrow widths ( ) and then excluded.
3 RESULTS
3.1 Estimate of H I Proximity Zones
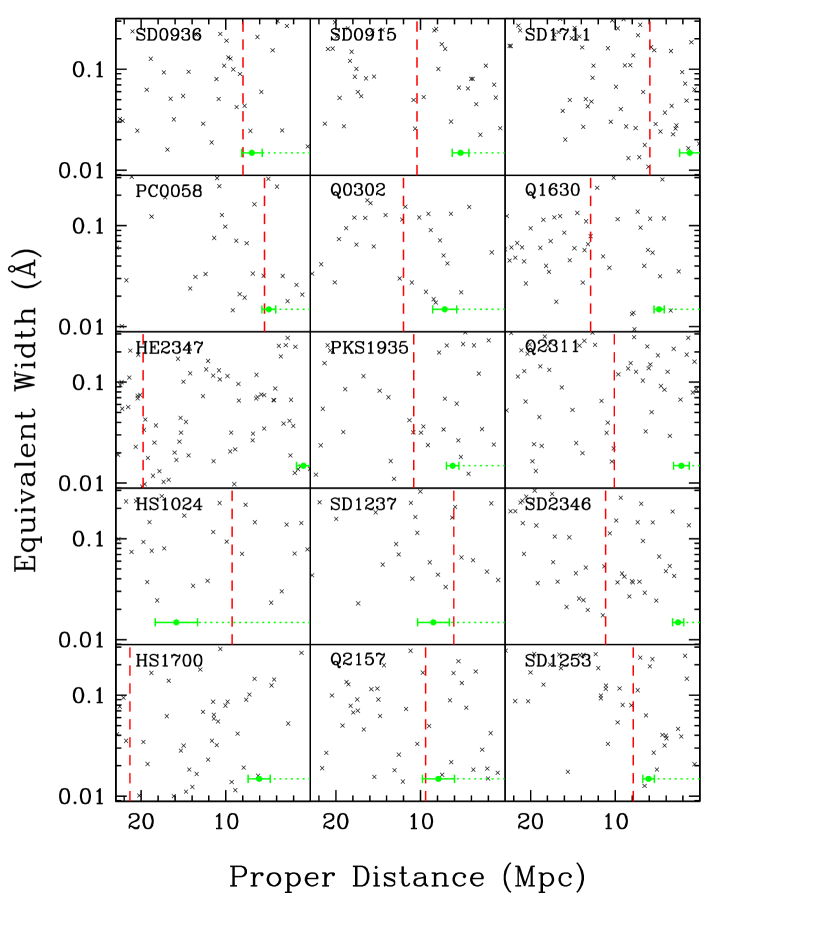
In Figure 1 we plot the EW distribution of H I absorption lines within Mpc ( Å) of radial distance. The detection limit is uneven at different parts of the same spectrum, as the result of line blending, instrumental sensitivity and gaps. Weak absorption features should be easier to find near the Ly peak, where Ly emission increases the flux and boosts S/N and the nominal Ly -line density is the highest (, Kim et al., 2013). On the contrary, the H I proximity effect in the quasar vicinity is seen as the depressed number density of absorption lines and/or their strengths. While the proximity effect is evident in some quasars as a lack of weak absorption lines near the Ly wavelength, it is present in some other quasars as a decrease in EW for a similar number density towards Ly . For a given wavelength bin, we calculate the total EW as their geometric mean (the n-th root of products) multiplied by their number, to detect a decline in both the numbers and strengths of Ly absorption lines and to avoid the bias towards strong lines. The total EWs are calculated from wavelengths as low as 1050 Å toward Ly at steps of 1 Å and with bins of 3, 5 and 7 Å.
We compare the number density and total EW with different bin sizes to estimate the H I proximity zone in every quasar. If the total EW in a bin or the number of lines declines by 30% as compared to those at larger distances, it is considered as a sign of proximity effect. The external effect by foreground quasars near lines of sight may complicate our study. The distribution of line number in the vicinity of several quasars is not monotonic, making two possible sizes of proximity zone. For example, the EW distribution in SDSS09150016 shows two dips in the distribution of line numbers around 16 and 6 Mpc (see the upper middle panel of Figure 1). The one at a further distance is consistent with an external void, as absorption lines reappear at shorter distances. We therefore mark the one at 6 Mpc as the H I proximity zone.
The sizes of H I and He II proximity zones in these 15 quasars are listed in Table 2 and compared in Figure 2. The errors are estimated from visual inspections and do not include the term due to redshift uncertainties, which would have the same effect on both the H I and He II proximity-zone sizes. In Figure 3 we normalize the proximity zones with the expected characteristic sizes , where the estimated ionizing flux from a quasar is equal to that of the UVB. To convert from the observed optical fluxes to the intrinsic values at 1 and 4 Ry, a broken power law is assumed with an index of (, Vanden Berk et al., 2001) below the Ly frequency and above it (Zheng et al., 1997; Telfer et al., 2002; Lusso et al., 2015). The UVB fluxes are fixed at (Becker & Bolton, 2013) and (Worseck et al., 2019). This is a rough estimate because the UV continua of quasars show significant variations, but it serves as a reasonable mark as the proximity-zone sizes are proportional to the square root of UV luminosities. Note that the proximity effect extends beyond such a characteristic distance, but becomes less visible.
We carry out a statistical test between the He II and H I zone sizes. It yields a Pearson correlation coefficient of and a probability of no-correlation . A test between the normalized zone sizes (Figure 3) yields similar results: and , suggest a significant correlation. We also carry out a linear regression between the He II and H I zone sizes. The slope of 0.39 and a correlation coefficient 0.62 suggest that H I proximity zones are often smaller than their He II counterparts. Part of this trend is attributed to our conservative estimates of H I proximity zones in several quasars, where more than one possible size of H I proximity zone exist, and the larger value is rejected because it is likely an external effect.
3.2 Individual Cases
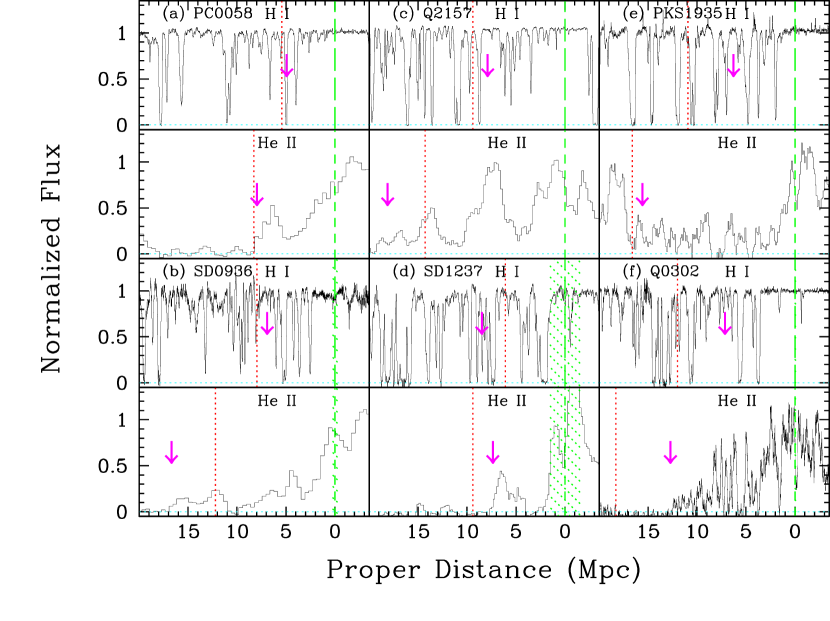
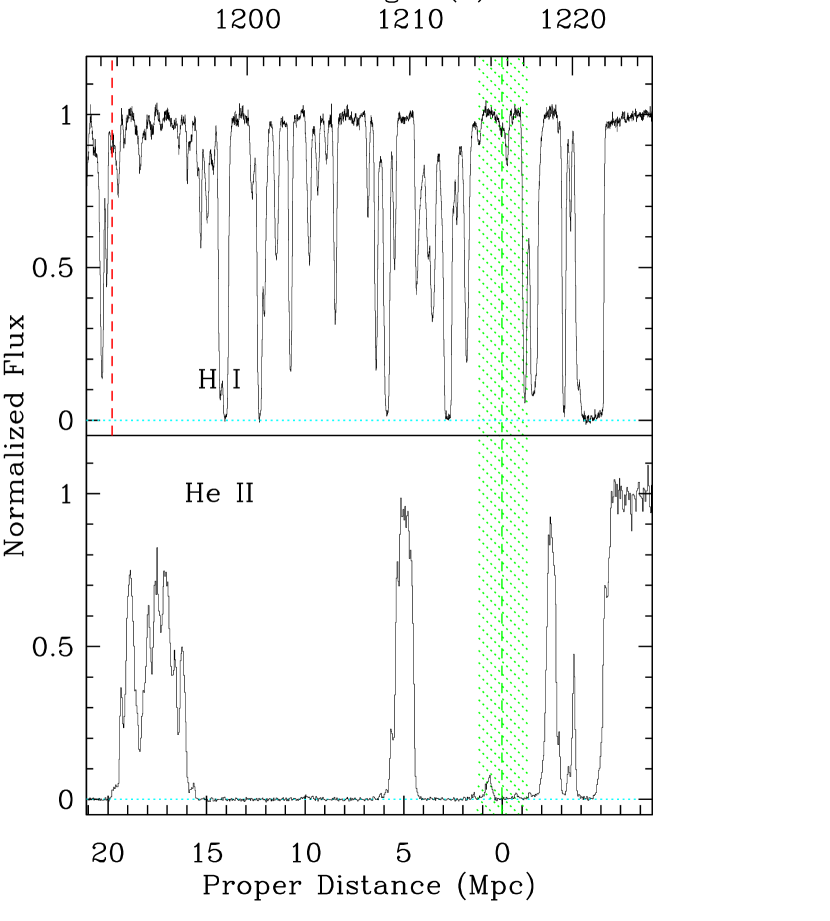
In Figures 4 and 5 we plot the normalized H I and He II spectra of 12 quasars, with marks of the estimated and characteristic proximity-zone sizes. The He II and H I spectra of three quasars with unique proximity zones are plotted in Figures 6 - 8.
HE23474342:
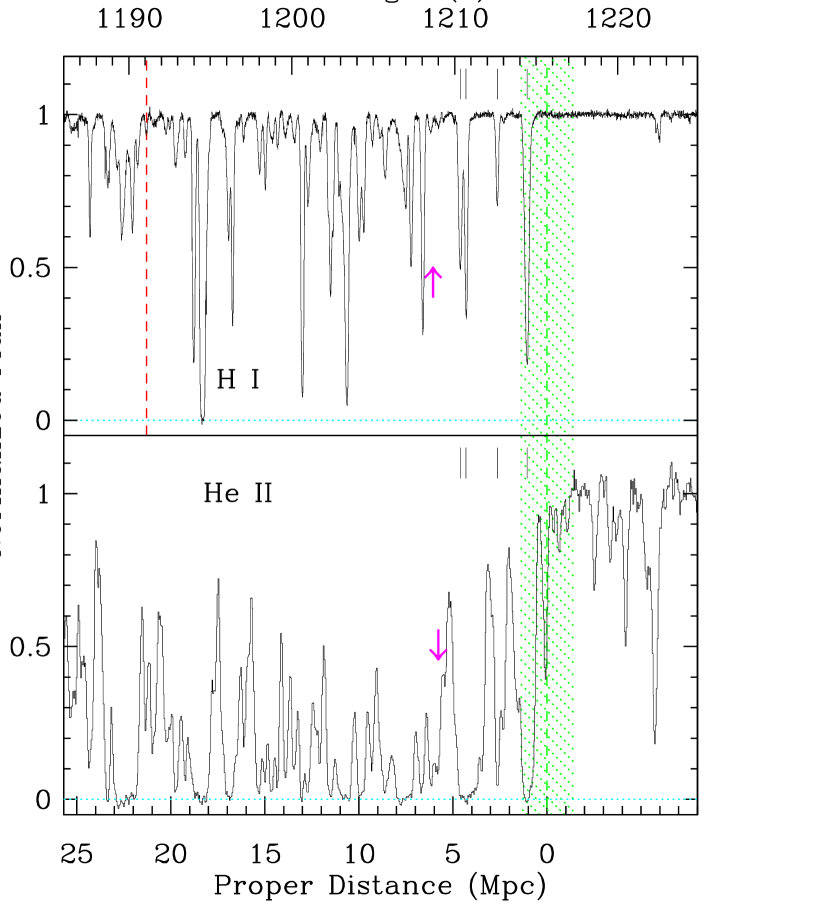
This luminous quasar is arguably the best example for a null He II proximity zone (Shull et al., 2010). A reliable systemic redshift of is measured from a broad low-ionization line of O I 1302 (Reimers et al., 1997), which is consistent with a near-infrared spectrum (R. Simcoe, private communication; see also Simcoe et al., 2013). Several He II absorption lines are present at wavelengths longward of the Ly , up to , perhaps attributed to infalling materials. The data quality for this quasar is the highest in our sample as the EWs are based on a list of fitted Ly lines down to column density (Zheng et al., 2004). As shown in Figure 6, the density of H I absorption lines does not decrease in the quasar’s vicinity, suggesting a null H I proximity zone ( Mpc). The apparent lack of weak absorption lines around 5 Å from Ly is attributed to the overlapping absorption lines between 1209 and 1214 Å. Given a high luminosity, a fully developed proximity zone should be present beyond characteristic distances Mpc for H I and Mpc for He II. Actually the upper limit to the He II proximity zone is only 1.3 Mpc, less than 5% of the anticipated value (§4.2).
HS1700+6416:
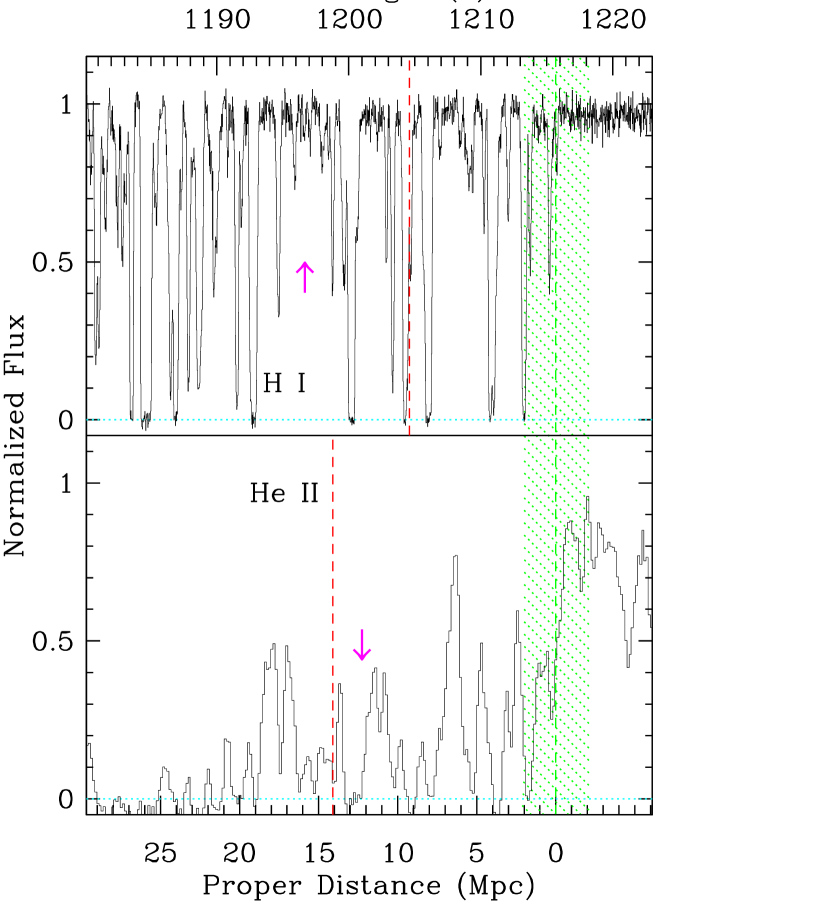
This luminous He II quasar has also been studied extensively (Davidsen, Kriss & Zheng, 1996; Fechner et al., 2006; Syphers & Shull, 2013). The HIRES spectrum (Figure 7) reveals a proximity zone: within 7 Å shortward of Ly , only four absorption lines at Å and no weaker lines. These four lines cause deep troughs in the He II proximity profile, which extends to at least 5 Å and possibly to 7 Å from Ly . Because of its high luminosity, the characteristic sizes of proximity zone are slightly larger than that of HE23474342. The residual flux at Å is not zero (Davidsen, Kriss & Zheng, 1996) because of the quasar’s low redshift, therefore the end point of He II proximity zone is estimated to be at Mpc. The measured size of He II proximity zone is only of that anticipated value. Overall, the proximity zone of HS1700+6416 is clearly present, but significantly underdeveloped.
Q23111417:
Khrykin, Hennawi, & Worseck (2019) derived a He II proximity zone of Mpc (including the redshift uncertainty) for this quasar and suggested an young age of Myr. As shown in Panel j of Figure 5, absorption lines are present at the region shortward of H I Ly wavelength, and there is no void within 20 Å toward the redshifted He II Ly wavelengths.
SDSS23460016:
As shown in Panel i of Figure 5, this quasar displays small proximity zones for He II and H I ( Mpc). The SDSS redshift of would place the entire proximity profile longward of Ly , which is unlikely. We adopt (Zheng et al., 2015) for this quasar. Only the night portion of COS data is used because of airglow emission around the observer’s wavelength of 1360 Å.
Q0302003:
This quasar is known for the first detection of He II Gunn-Peterson trough (Jakobsen et al., 1994) as well as the first confirmation of a proximity profile (Hogan, Anderson & Rugers, 1997). It represents a good example for its significant proximity zone (Heap et al., 2000; Syphers & Shull, 2014; Khrykin et al., 2016). Its redshift is as derived from narrow [O III] lines (Syphers & Shull, 2014). Optical spectra reveal a large spectral void at , which is attributed to the transverse proximity effect of a foreground quasar near the line of sight (Dobrzycki & Bechtold, 1991). There is an apparent lack of H I absorption lines within 15 Å from the Ly wavelength (Panel f of Figure 4), in spite of significantly higher S/N ratios near the Ly emission peak. We take the size of this H I void as that of the proximity zone. There is a void at approximately 11.4 Mpc (1200 Å) possibly due to another foreground quasar Q0301005 (, Syphers & Shull, 2014). We extend the lower error of the He II proximity-zone size to reflect this possible external effect.
HS1024+1849:
This quasar has been observed with the SDSS, and the SDSS value of seems too low as the most significant part of the He II proximity profile would have been missed. We fit the SDSS spectrum with a power-law continuum and Gaussians emission lines over the ranges without strong absorption lines. The C III redshift is a low value of 2.839, C IV 2.864 and Ly 2.852, using the wavelength values in Vanden Berk et al. (2001). We take their average as . The UV spectrum of this quasar, as shown in Figure 8, displays prominent high-flux points within wavelengths Å from the Ly . The optical spectrum is choppy near Ly , with several small troughs that match the strong absorption lines in the optical spectrum. However, the number of absorption lines and their total EW per wavelength bin of 5 Å is steady within Å of Ly then increase towards shorter wavelengths. We consider a large H I proximity zone for this quasar.
PKS1935692:
Anderson et al. (1999) reported a wide, flat He II proximity ”shelve” shortward of the He II Ly wavelength, extending to at least about 14 Mpc. As shown in Panel e of Figure 4, there is a significant, real void at about 18 Mpc. Because of the contrast between this void and the rest of the proximity profile, we consider it an external feature.
3.3 Redshift Uncertainties
A significant factor that affects the proximity-zone sizes is the redshift uncertainties. For the three bright quasars listed at the top rows of Table 1, the redshifts are as accurate as . For four quasars that have been observed by SDSS, we use the average of three redshifts (pipeline redshifts, PCA redshifts and C III redshifts). The systemic redshift of SDSS23460016 was derived in Zheng et al. (2015), as discrepancy was found and studied. The redshift of HS1024+1849 is estimated as described above. For the remaining five quasars at the bottom of Table 1, their redshifts and errors are from various literatures. When we derive quasar ages from the proximity zones, uncertainties in both measurements and redshifts (see the shaded regions in Figures 48) are included. When comparing the He II and H I zone sizes, the redshift errors are not included since uncertainties in systemic redshift affect both proximity zones in the same manner.
3.4 External Effect
When a long line of sight toward a distant quasar intercepts the proximity zone of another foreground quasar, a surge in flux may be observed in both the He II and H I spectra (Syphers & Shull, 2014). While it is common that a spectrum of Ly forest lines displays such voids, they may be confused as intrinsic if two quasars are within 20 Mpc in separation. The proximity profile of an external source is largely symmetrical, namely a spectral void with wings toward both the longer and shorter wavelengths. In optical spectra, if the strength of Ly forest lines declines and then recovers, this is likely an external effect. We use this criterion to reject large zone sizes in several quasars. However, rejecting an external effect in a He II proximity profile is difficult because the He II counterparts of Ly forest lines are so strong that they make significant troughs in the spectra of low resolution. The He II proximity profile reflects a gradual decline of flux towards larger radii. If a significant spectral void is found beyond the characteristic radius, it is considered as external, as illustrated in Panel e of Figure 4.
4 DISCUSSION
The time variations of IGM (intergalactic medium) reionization are governed by the two
opposing processes of reionization and recombination (Meiksin, 2009). For
hydrogen:
| (1) |
where is the fractional population of neutral hydrogen, that of ionized hydrogen, the electron density, the case-A recombination coefficient, and the hydrogen-ionization rate per neutral hydrogen atom.
Similarly, for helium:
| (2) |
where is the fractional population of neutral helium, that of singly ionized helium, that of fully ionized helium, and the total recombination rates to all levels of HeI and He II, respectively, and and the respective photoionization rates. When the ionization term is suddenly increased, the equilibration scale toward a higher state is . When this terms becomes insignificant, the time scale of reaching a new balance is .
4.1 Development of He II Ionization Zone
The expansion of a quasar’s He II proximity zone should be slower than its hydrogen counterpart for two reasons: (1) a significant portion of intergalactic singly ionized helium exists at and (2) the quasar’s He II-ionizing flux at 4 Ry is considerably weaker than that at 1 Ry. As the ionizing photons from a quasar propagate though intergalactic space, the enhanced ionization level would respond within an equilibration time scale. Since the size of a proximity zone is proportional to the square root of the quasar age. At the edge of a proximity zone, this time scale of H I equilibration is yr (Meiksin, 2009; Khrykin et al., 2016). While this time scale is too small to make a meaningful observable difference for H I, the He II equilibration time is considerably longer, on the order of Myr as is smaller by 2-3 orders of magnitude (Haardt & Madau, 2012).
Khrykin et al. (2016) simulate the He II ionization and find that the proximity profiles are different for various quasar ages, in spite of a degeneracy between the fraction and the ages. They suggest that the signature of quasar ages can be found up to about 30 Myr, or about 10 Mpc. This will serve as a gauge of the H I counterpart.
4.2 H I Proximity Zone and Quasar Age
Are the observed sizes of H I proximity zones relevant to quasar ages? To seek an answer, we compare the H I proximity zones with their He II counterparts. He II proximity zones are deemed as more sensitive and reliable probes than their H I counterparts, which can only be estimated indirectly. Some simulations assume an infinite speed of light, because the transmission spectrum is along the line of sight. If this is the case, the effect of quasar radiation should be observed to the full H I zone size for a given quasar luminosity.
As shown in Figure 3, there are four data points of normalized proximity zones that are smaller than 0.2 for He II and 0.3 for H I. If the current models are correct, the ordinate values for these data points should be at 1 or higher, which are not observed. This provides clear evidence that the sizes of H I proximity zones for young quasars are small. Only one data point in Figure 2 shows high values of He II and H I proximity zones ( Mpc), suggesting that it is likely an old quasar. Four other data points show large He II proximity zones ( Mpc), but moderate H I zone sizes, suggesting that large spectral voids at large distances from these quasars may not be attributed to a foreground quasar near the line of sight. Overall, the results suggest that the sizes of He II and H I proximity zones are correlated, and they are indicative of quasar ages.
To estimate quasar ages from He II proximity profiles, we carry out simulations using the time-dependent Equations (1) and (2). The bin size is 0.03 Mpc, and the density fluctuation follows a lognormal distribution (Bi & Davidsen, 1997) in the range of average IGM density. At large radial distances, this nominal density is for . For HE23474342, we assume a high luminosity of above 1 Ry and no time delay along a line of sight. With an assumed background radiation field of , He II has been largely ionized. From a radial distance of 0.5 Mpc outward, the ionizing flux at each distance is calculated at energy bins above 1 Ryd. The time dependence of He II and H I populations is calculated over a range of quasar ages between Myr. The optical depths at different ionization energy levels are then updated before the next round at a slightly larger radial distance.
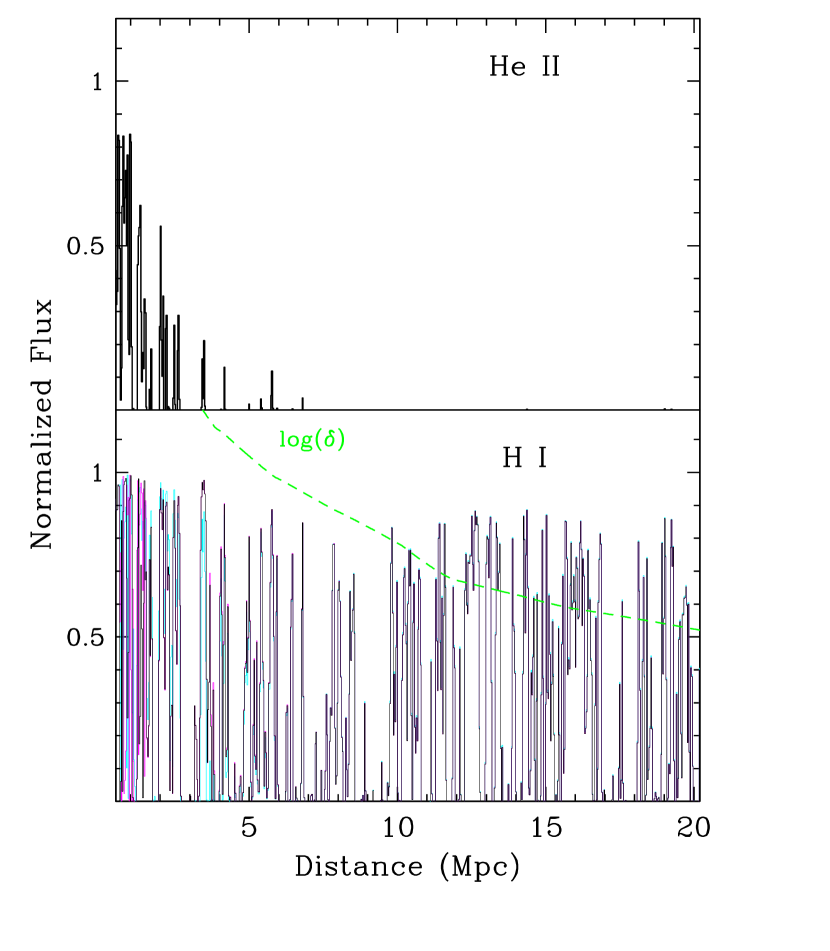
Since quasars are believed to form in the massive galactic halos, an IGM overdensity in the quasar vicinity affects the sizes of both He II and H I proximity zones. Guimarães et al. (2007) found a reduction of proximity effect for luminous quasars and suggested an overdensity factor of between radial distances of Mpc. We adapt the density profile from Figure 12 of that paper. As shown in Figure 9, the ionization front expands fast under the high luminosity, at an approximate rate of .
We carry out simulations at higher overdensities. As shown in Figure 10, at an even higher overdensity ( the density profile), the He II proximity zone indeed becomes small, but strong densities cause significant deficiency in the H I counterparts. Within the distance of 20 Mpc, no weak absorption lines are present. Therefore, very high overdensities seem difficult to match both the He II and H I spectra.
4.3 Episodic Quasar Bursts?
A correlation between the He II and H I proximity zones implies that the expansion of H I ionizing front at is largely sub-luminal. For the young quasars with small He II proximity zones, their H I counterparts are also small. To our knowledge, this is not in agreement with current models. One possible explanation is that quasar activities are flickering instead of steady. For the IGM at , the reionization term from a UVB field is normally balanced by the recombination term at . Under the enhanced radiation from a quasar and after a period of equilibration time, this balance is shifted to a lower level of . After the quasar radiation is switched off or enter a low state, the value will increase back to its original level. While the characteristic time scale of recombination is very long, it takes only a small fraction of that time to reach a new level of . At a , Equations (2) become , and the time for a rebalance is , approximately yr for . This trend is illustrated in Figure 11 for one single quasar burst. The response time for He II is considerably longer because , therefore the effect for He II is accumulative over the entire quasar lifetime, and the H I effect responds to the latest quasar burst. Combining with the correction along lines of sight, it may be possible to see both the He II and H I proximity zones on a similar scale and are suggestive of quasar ages, namely distinguishing young and old ages.
Quasar flickering has been suggested by Ciotti & Ostriker (2001); Novak, Ciotti & Ostriker (2011). Schawinski et al. (2015) find evidence for a typical AGN phase of yr. Kirkman & Tytler (2008) study the transverse H I proximity effect in 130 quasar pairs and suggest episodic quasar lifetimes of Myr. Recently Khrykin, Hennawi, & Worseck (2019) suggest that the small proximity zones in several quasars may be consistent with time-dependent quasar activities. It is possible that, during the early stage of quasar activities, flickering is common, and their He II and H I proximity zones are small. For old quasars, their activities are steadier, making large zones. It is noted that this scenario is overly simplified, and more work in both observations and theoretical models is needed.
5 CONCLUSION
We compare the He II and H I proximity zones in 15 quasars. While the sample is small, the high sensitivity of He II absorption and the high quality of optical data offer a unique chance to probe the propagation of H I proximity zones over quasar lifetimes. Our results suggest that (1) for the four quasars with small He II proximity zones, no large H I proximity effect is present. (2) for the four quasars with large He II proximity zones (), their H I counterparts are also large (), suggesting that both He II and H I proximity zones are related to quasar ages. (3) there is a significant correlation between H I and H I proximity-zone sizes, hence both may be indicative of quasar ages. H I proximity zones are often smaller than their He II counterparts. These properties remain significant even after normalizing for quasar luminosity and are not in apparent agreement with the current models. The overdensity in the quasar vicinity reduces the proximity effect, but simulations with very high overdensities do not match both the observed He II and H I spectra. A possible explanation is that quasar activities are episodic, resulting in periods of ionization and recombination for both He II and H I in the vicinity. The H I ionization responds rapidly with the varying flux, but the He II ionization responds slowly over the entire lifespan of a quasar.
Our model suggests that a He II proximity profile along the line of sight develops fast, reaching Mpc due to the first 1 Myr of quasar lifetime. Quasars that display small He II and/or H I proximity zones of Mpc should be considerably younger than 1 Myr. It is emphasized that the proximity effect along lines of sight may provide only the upper limits to quasar ages, and the actual quasar ages may be considerably smaller. Nevertheless, we should able to identify a group of young quasars from their small H I proximity zones, similar to that of He II counterparts.
References
- Anderson et al. (1999) Anderson, S. F., Hogan, C. J., Willimas, B. F. & Carswell, R. F. 1999, AJ, 117, 56
- Bajtlik, Duncan & Ostriker (1988) Bajtlik, S., Duncan, R. C. & Ostriker, J. P. 1988, ApJ, 327, 570
- Becker & Bolton (2013) Becker G. D. & Bolton, J. S. 2013, MNRAS, 436, 1023
- Bi & Davidsen (1997) Bi, H. & Davidsen, A. F. 1997, ApJ, 479, 523
- Bolton & Haehnelt (2007) Bolton, J. S. & Haehnelt, M. G. 2007, MNRAS, 374, 493
- Bolton et al. (2005) Bolton, J. S. & Haehnelt, M. G., Viel, M., & Springel, V. 2005, MNRAS, 357, 1178
- Cardelli, Clayton & Mathis (1989) Cardelli, J. A., Clayton, G. C., and Mathis, J. S. 1989, ApJ, 345, 245
- Ciotti & Ostriker (2001) Ciotti L. & Ostriker J. P., 2001, ApJ, 551, 131
- Dall’Aglio, Wisotzki & Worseck (2008) Dall’Aglio, A., Wisotzki, L., & Worseck, G. 2008, A&A, 491, 465
- Davidsen, Kriss & Zheng (1996) Davidsen, A. F., Kriss, G. A. & Zheng, W. 1996, Nature 380, 47
- Dobrzycki & Bechtold (1991) Dobrzycki, A. & Bechtold, J. 1991, ApJ, 377, L69
- Fechner et al. (2006) Fechner, C., Reimers, D., Kriss, G, A. et al. 2006, A&A, 455, 91
- Guimarães et al. (2007) Guimarães, R., Petitjean, P., Rollinde, E. et al. 2007, MNRAS, 377, 657
- Haardt & Madau (2012) Haardt, F. & Madau, P. 2012, ApJ, 746, 125
- Heap et al. (2000) Heap, S. R., Williger, G. M., Smette, A. et al. 2000, ApJ, 534, 69
- Hodge (2011) Hodge, P. E. 2011, in Astronomical Data Analysis Software and Systems XX, eds. I. N. Evans, A. Accomazzi, D. J. Mink, & A. H. Rots, (A. S. P. Conf. Series 442, ASP, San Francisco), 391
- Hogan, Anderson & Rugers (1997) Hogan, C. J., Anderson, S. F. & Rugers, M. H. 1997, AJ, 113, 1495
- Jakobsen et al. (1994) Jakobsen, P., Boksenberg, A., Deharveng, J. M., Greenfield, P., Jedrzejewski, R., & Paresce, F. 1994, Nature, 370, 35
- Khrykin et al. (2016) Khrykin, I. S., Hennawi, J. F., McQuinn, M., & Worseck, G. 2016, ApJ, 824, 133
- Khrykin, Hennawi, & Worseck (2019) Khrykin, I. S., Hennawi, J. F. & Worseck, G. 2019, MNRAS, 484, 3897
- Kim et al. (2013) Kim, T.-S., Partl, A. M., Carswell, R. F., & Müller, V. 2013, A&A, 552, 77
- Kirkman & Tytler (2008) Kirkman, D. & Tytler, D. 2008, MNRAS, 391, 1547
- Lu & Yu (2011) Lu, Y. & Yu, Q. 2011, ApJ, 736, 49
- Lusso et al. (2015) Lusso E., Worseck G., Hennawi J. F. et al. 2015, MNRAS, 449, 4204
- Meiksin (2009) Meiksin, A. A. 2009, Rev. Modern Phys., 841, 1405
- Novak, Ciotti & Ostriker (2011) Novak G. S., Ostriker J. P. & Ciotti L. 2011, ApJ, 737, 26
- O’Meara et al. (2017) O’Meara, J. M., Lehner, N., Howk, J. C. et al. 2017, AJ, 154, 114
- Pâris et al. (2017) Pâris, I. Petijean, P., Ross, N. et al. 2017, å, 597, 79
- Reimers et al. (1997) Reimers, D., Köhler, S., Wisotzki, L., Groote, D., Rodriguez-Pascual, P. & Wamsteker, W. 1997, A&A, 327, 890
- Schawinski et al. (2015) Schawinski, K., Koss, M., Berney, S. & Sartori, L. F. 2015, MNRAS, 451, 2517
- Schlafly & Finkbeiner (2011) Schlafly, E. F. & Finkbeiner, D. P. 2011, ApJ, 737, 103
- Schneider et al. (2010) Schneider, D. P., Richards, G. T., Hall, P. B. et al. 2010, AJ, 139, 2360
- Shull et al. (2010) Shull, J. M., France, K., Danforth, C. W., & Smith, B. 2010, ApJ, 722, 1312
- Simcoe et al. (2013) Simcoe, R. A., Burgasser, A. J., Schechter, P. L. et al. 2013, PASP, 125, 270
- Syphers & Shull (2013) Syphers, D. & Shull, J. M. 2013, ApJ, 765, 119
- Syphers & Shull (2014) 2014, ApJ, 784, 42
- Telfer et al. (2002) Telfer, R., Zheng, W., Kriss, G. A., & Davidsen, A. F. 2002, ApJ, 565, 733
- Vanden Berk et al. (2001) Vanden Berk, D. E., Richards, G. T., Bauer, A. et al. 2001, AJ, 122, 549
- White et al. (2003) White, R. L., Becker, R., Fan, X., & Strauss, M. A. 2003, AJ, 126, 1
- Worseck et al. (2019) Worseck, G., Davies, F. B., Hennawi, J. F. & Prochaska, J. X. 2019, ApJ, 875, 111
- Worseck et al. (2007) Worseck, G., Fechner, C., Wisotzki, L., & Dall’Aglio, A. 2007, 473, 805
- Worseck et al. (2012) Worseck, G., Hennawi, J. F., Prochaska, J. X. et al. 2012, http://www.stsci.edu/hst/phase2-public/13013.pro
- Worseck et al. (2016) Worseck, G., Prochaska, J. X., Hennawi, J. F. & McQuinn, M. 2016, ApJ, 825, 144
- Zheng & Davidsen (1995) Zheng, W. & Davidsen, A. F. 1995, ApJ, 440, L53
- Zheng et al. (2004) Zheng, W., Kriss, G. A., Deharveng, J.-M. et al. 2004, ApJ, 605, 631
- Zheng et al. (1997) Zheng, W., Kriss, G. A., Telfer, R. C. et al. 1997, ApJ, 475, 469
- Zheng et al. (2015) Zheng, W., Syphers, D., Meiksin, A. et al. 2015, ApJ, 806, 142


| Name | Redshift | Optical | Exp. (sec) | UV/HST | Exp. (sec) |
|---|---|---|---|---|---|
| HE23474342 | aaReimers et al. (1997), bSyphers & Shull (2013), cSyphers & Shull (2014), dSDSS DR12 quasar catalog (Pâris et al., 2017), ethis work, fZheng et al. (2015), gKhrykin, Hennawi, & Worseck (2019), hWorseck et al. (2016), iAnderson et al. (1999), jHST/GO proposal 13013, Worseck et al. (2012). | VLT/UVES | 28455 | COS/G130M | 69852 |
| HS1700+6416 | bbCharacteristic radius at which the quasar ionizing flux above 4 Ry is equal to that of the UVB of . | Keck/HIRES | 27632 | COS/G130M | 18137 |
| Q0302003 | ccCharacteristic radius at which the quasar ionizing flux above 1 Ry is equal to that of the UVB of . | Keck/HIRES | 15595 | COS/G130M | 21995 |
| SDSSJ0915+4756 | ddfootnotemark: | Keck/HIRES | 10800 | COS/G130M | 26864 |
| SDSSJ1237+0126 | ddfootnotemark: | VLT/UVES | 47600 | COS/G140L | 3382 |
| SDSSJ0936+2927 | ddfootnotemark: | Keck/HIRES | 14400 | COS/G140L | 2943 |
| SDSSJ1253+6817 | ddfootnotemark: | Keck/HIRES | 15000 | COS/G140L | 14096 |
| HS1024+1849 | eefootnotemark: | VLT/UVES | 3000 | COS/G130M | 28689 |
| SDSS23460016 | fffootnotemark: | Keck/HIRES | 18900 | COS/G140L | 4679 |
| SDSSJ1711+6052 | ggfootnotemark: | Keck/HIRES | 25200 | COS/G140L | 23951 |
| QSOJ1630+043 | ggfootnotemark: | VLT/UVES | 12000 | COS/G130M | 40919 |
| Q23111417 | ggfootnotemark: | VLT/UVES | 29865 | COS/G130M | 44882 |
| PC0058+0215 | hhfootnotemark: | VLT/UVES | 27000 | COS/G140L | 6212 |
| PKS1935692 | iifootnotemark: | VLT/UVES | 18112 | GHRS/G140L | 82579 |
| QSOJ2157+2330 | jjfootnotemark: | VLT/UVES | 15000 | COS/G140L | 5524 |
| Name | bbCharacteristic radius at which the quasar ionizing flux above 4 Ry is equal to that of the UVB of . | ccCharacteristic radius at which the quasar ionizing flux above 1 Ry is equal to that of the UVB of . | ||
|---|---|---|---|---|
| HE23474342 | 30.1 | |||
| HS1700+6416 | 32.4 | |||
| Q0302003 | 18.3 | |||
| SDSSJ0915+4756 | 15.8 | |||
| SDSSJ1237+0126 | 9.4 | |||
| SDSSJ1253+6817 | 12.0 | |||
| HS1024+1849 | 14.2 | 9.3 | ||
| SDSSJ0936+2927 | 12.2 | |||
| SDSS23460016 | 17.0 | 11.1 | ||
| SDSSJ1711+6052 | 8.9 | |||
| QSOJ1630+043 | 19.8 | 13.0 | ||
| Q23111417 | 15.4 | |||
| PC0058+0215 | 8.3 | 5.4 | ||
| PKS1935692 | 16.6 | 10.9 | ||
| QSOJ2157+2330 | 14.3 | 9.4 |