Progressive steepening of the SNR RX J1713.7–3946 X-ray spectrum from XMM-Newton to INTEGRAL
Abstract
In this work, we present the first detailed analysis of the supernova remnant RX J1713.7–3946 in the hard X-ray energy range with the IBIS coded-mask telescope on board the INTEGRAL observatory. The shell-type morphology of the entire remnant is mapped in hard X-rays for the first time and significantly detected up to 50 keV. The IBIS sky image of RX J1713.7–3946, accumulated over 14 years of operations, demonstrates two extended hard X-ray sources. These sources are spatially consistent with northwest and southwest rims of RX J1713.7–3946 and are also clearly visible at energies below 10 keV with XMM-Newton. This points to a single emission mechanism operating in soft and hard X-rays. The INTEGRAL 17–120 keV spectrum of RX J1713.7–3946 is characterized by a power-law continuum with the photon index of , that is significantly softer than determined by XMM-Newton in the 1–10 keV energy range, suggesting a progressive steepening of the spectrum with the energy.
keywords:
SNRs, X-rays: individual (RX J1713.7–3946)1 Introduction
Supernova remnants (SNRs) are well-known accelerators of cosmic rays (CRs, see, e.g., Blasi, 2013, for a review). RX J1713.7–3946 (hereafter RX J1713), also known as G347.3–0.5 (Slane et al., 1999), is one of the best studied young shell-type SNRs. It was discovered in the Scorpius constellation during the ROSAT All Sky Survey in soft X-rays (Pfeffermann & Aschenbach, 1996). In this band, the source has a slightly elliptical shape with the maximum size of . Based on Chandra observations, Uchiyama et al. (2003) revealed bright filamentary structures in RX J1713. A double-shell structure was also detected in the western part of RX J1713 with an enhanced absorption along this edge (Cassam-Chenaï et al., 2004), likely associated with nearby molecular clouds (Butt et al., 2001; Hiraga et al., 2005; Cassam-Chenaï et al., 2004; Fukui et al., 2003). The distance to RX J1713 was estimated to be kpc based on the molecular gas observations (Fukui et al., 2003; Moriguchi et al., 2005). Such a location most likely coincides with the historical supernova SN 393, which age is about 1600 years (Wang et al., 1997).
RX J1713 is a bright source in X-ray and gamma energy bands. Its interior regions exhibit a faint thermal component with Ne Ly and Mg He emission lines attributed to the reverse-shocked supernova ejecta (Katsuda et al., 2015). The X-ray emission of RX J1713 is dominated by the synchrotron radiation of electrons in shell regions (Koyama et al., 1997; Slane et al., 1999) accelerated up to multi-TeV energies at the supernova shock (Koyama et al., 1995; Zirakashvili & Aharonian, 2007).
The X-ray synchrotron spectrum in the soft 0.7–7.0 keV energy band is well described by the absorbed power-law model with the photon index and the hydrogen column density cm2 varying within a selected SNR region (Okuno et al., 2018). Similar results were obtained with XMM-Newton (Acero et al., 2009) and Suzaku XIS (Takahashi et al., 2008; Tanaka et al., 2008). Hard X-rays from the RX J1713 have been detected by Suzaku HXD up to 40 keV with the spectrum well described by a power-law with the photon index of , which is steeper than that measured for energies below keV (Tanaka et al., 2008).
The gamma-ray emission from SNR RX J1713 was first detected with CANGAROO Cherenkov telescopes (Muraishi et al., 2000; Enomoto et al., 2002). Further observations of RX J1713 were carried out with H.E.S.S. gamma-telescopes (Aharonian et al., 2004, 2006, 2007). Based on H.E.S.S. data, Acero et al. (2009); H. E. S. S. Collaboration et al. (2018) obtained the photon index estimate of in the 0.2–30 TeV energy band. The similarity of the SNR shell-like morphology in soft X-rays and gamma-rays suggests a common emission mechanism in both bands, presumably due to cosmic ray particles accelerated at the shocks.
Despite the large number of observatories operating in hard X-rays, there is still no detailed information about the hard X-ray morphology and spectrum of RX J1713 at energies above keV. As a part of all-sky survey, Krivonos et al. (2007) reported the first detection of the RX J1713 in the hard X-ray band with the IBIS coded-mask telescope on board the INTEGRAL gamma-ray observatory. It was shown that the keV sky image of RX J1713 exhibits a clear extended structure spatially consistent with the soft X-ray morphology revealed by ROSAT in the keV energy band. Later, Takahashi et al. (2008) presented the X-ray spectrum of the southwestern part of RX J1713 measured with the non-imaging hard X-ray instrument Suzaku HXD. However, the full FOV of HXD covers only a part of RX J1713 and the spectral analysis requires non-trivial modeling of the astrophysical background. Due to its large extent of , RX J1713 is also a complicated target for the hard X-ray focusing telescope NuSTAR (Harrison et al., 2013), with the FOV, prescribed by Wolter Type 1 design. Tsuji et al. (2019) presented the first direct X-ray image of the northwest rim of RX J1713 at energies above 10 keV obtained with NuSTAR. However, the full NuSTAR survey of the entire remnant is strongly limited by ghost-ray contamination and the known stray-light issues (Madsen et al., 2017).
Given the above difficulties of observing RX J1713 in the hard X-ray band, INTEGRAL provides a reasonable trade-off between the size of the source () and the angular resolution of the IBIS telescope ( FWHM).
In this paper, we present the first detailed spatial and spectral study of RX J1713 with the INTEGRAL/IBIS, using the significantly increased exposure time on the source since the work by Krivonos et al. (2007). The paper is structured as follows: in Sect. 2, we describe the observations and data reduction; the RX J1713 morphology and spatial analysis of the data in soft and hard X-rays are presented in Sect. 3 and 3.1, respectively; Sect. 4 contains the procedure of the RX J1713 spectral analysis; the obtained results are discussed and summarized in Sections 5 and 6, correspondingly.
2 Observations and data analysis
This work is based on data acquired with the IBIS coded-mask telescope (Ubertini et al., 2003) on board the INTEGRAL gamma-ray observatory (Winkler et al., 2003) from December 2002 to March 2017. We followed the data analysis procedure described in Churazov et al. (2014); Krivonos et al. (2017) to produce sky images of RX J1713 in 17–27, 27–36, 36–50, 50–120 and 17–60 keV energy bands.
In order to extend the image and spectral analysis of RX J1713 to the standard X-ray energy band of keV, we use all available XMM-Newton archival observations of RX J1713 from 2001 to 2017 with the total (effective) exposure of 711 ks (549 ks) as listed in Table 1. In this work, we use data from EPIC/MOS cameras only. We followed the analysis procedure described in Churazov et al. (2003) to obtain a background-subtracted, exposure and vignetting-corrected image of the entire region of SNR RX J1713 in the 1–10 keV energy band.
| ObsID | Date and time | Full | Effective |
|---|---|---|---|
| of observation | exposure, ks | exposure, ks | |
| 0093670101 | 2001-09-05 02:27:41 | 15.0 | 3.1 |
| 0093670201 | 2001-09-05 07:21:05 | 15.0 | 10.4 |
| 0093670301 | 2001-09-07 23:55:07 | 16.2 | 15.4 |
| 0093670401 | 2002-03-14 15:52:41 | 13.7 | 12.8 |
| 0093670501 | 2001-03-02 17:39:37 | 14.8 | 13.5 |
| 0203470401 | 2004-03-25 08:02:28 | 16.9 | 16.5 |
| 0203470501 | 2004-03-25 13:35:49 | 16.9 | 15.2 |
| 0207300201 | 2004-02-22 14:15:54 | 34.2 | 16.8 |
| 0502080101 | 2007-09-15 03:41:24 | 34.9 | 19.5 |
| 0502080201 | 2007-09-03 06:27:15 | 25.4 | 2.9 |
| 0502080301 | 2007-10-03 04:53:43 | 25.1 | 5.7 |
| 0551030101 | 2008-09-27 16:44:57 | 24.9 | 23.6 |
| 0722190101 | 2013-08-24 20:48:23 | 138.9 | 128.8 |
| 0740830201 | 2014-03-02 07:25:30 | 140.8 | 105.7 |
| 0743030101 | 2015-03-10 21:36:40 | 83.9 | 74.3 |
| 0804300801 | 2017-08-30 16:32:02 | 47.8 | 45.0 |
| 0804300901 | 2017-08-29 15:10:48 | 47.0 | 39.5 |
3 RX J1713 hard X-ray morphology
The IBIS telescope is a soft gamma-ray (20 keV – 10 MeV) instrument constructed in coded-mask design with the low-energy detector layer ISGRI (Lebrun et al., 2003) and high-energy layer PICSIT (Di Cocco et al., 2003). The coded-aperture imaging system with a tungsten mask located at 3.2 m above the detector plane provides the angular resolution of . Since the coded-mask telescope design does not provide a direct imaging, deconvolution-based sky image reconstruction procedures are applied to obtain relative positions of X-ray sources in the FOV. This approach is not suitable for observing sources with an angular size greatly exceeding the telescope angular resolution. However, if the source size is slightly larger than the full width at half maximum (FWHM) of the telescope point spread function (PSF), it is possible to obtain some limited information about the morphology of the extended source emission. For instance, Eckert et al. (2007, 2008); Lutovinov et al. (2008) effectively utilized IBIS data to study the extended hard-X-ray emission of galaxy clusters.
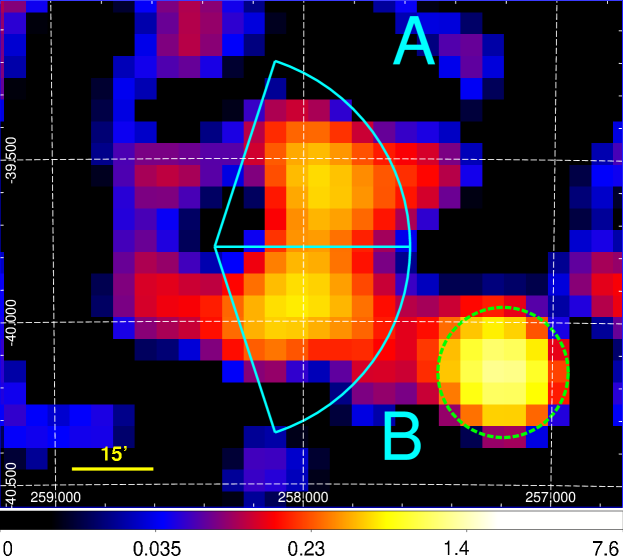
The IBIS/ISGRI keV image of RX J1713 is shown in Fig. 1. The surface brightness of RX J1713 is dominated by two hard X-ray excesses referred later as A and B, which have been detected at the significance level of 8.7 and 9.3, respectively, which is a factor of higher than the detection significance reached in Krivonos et al. (2007). The statistical significance of the total extended emission is . The improvement in sensitivity is consistent with the increased IBIS exposure for this region from 5.3 Ms (Krivonos et al., 2007) to Ms (Krivonos et al., 2017) over the period of 10 years. The centroid position of A and B excesses have been determined, respectively, at RA=, Dec.= and RA=, Dec.=. The localization error of point X-ray sources detected with IBIS/ISGRI depends on the source significance (Gros et al., 2003). Given the detection significance for A and B at the level of each, the corresponding 68% confidence interval of centroid position is (Krivonos et al., 2007), provided that the extent of A and B is not very large.
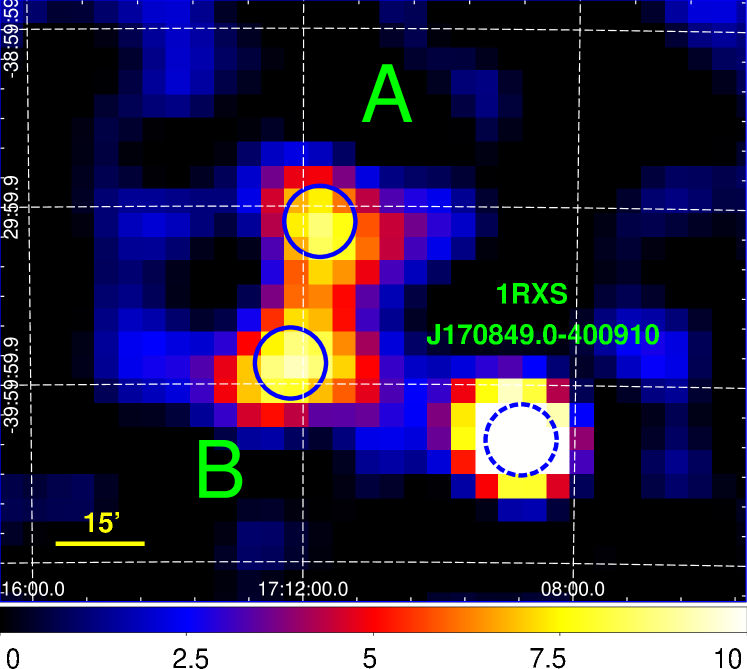
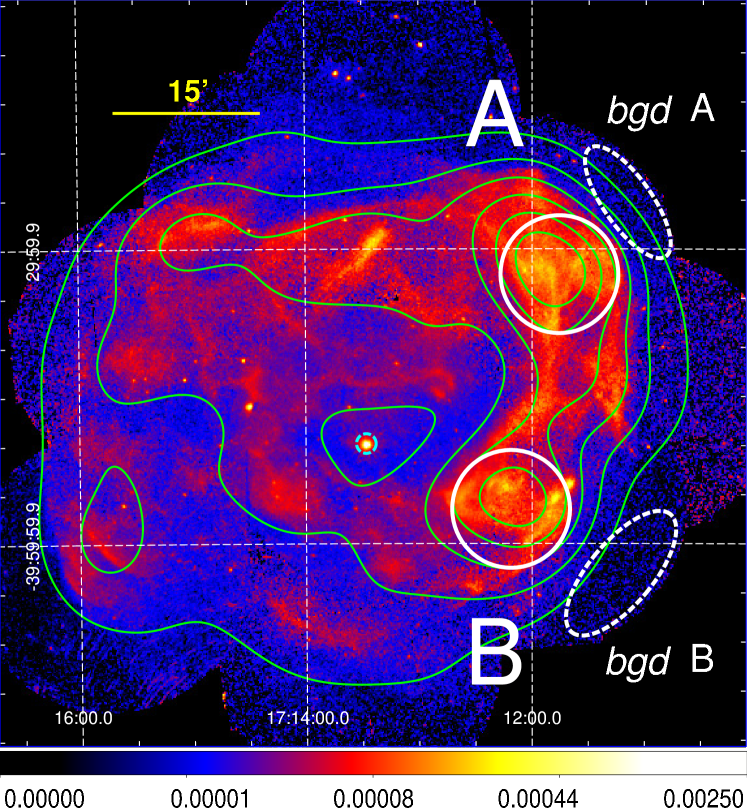
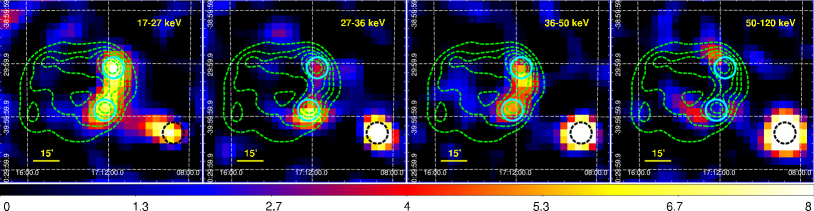
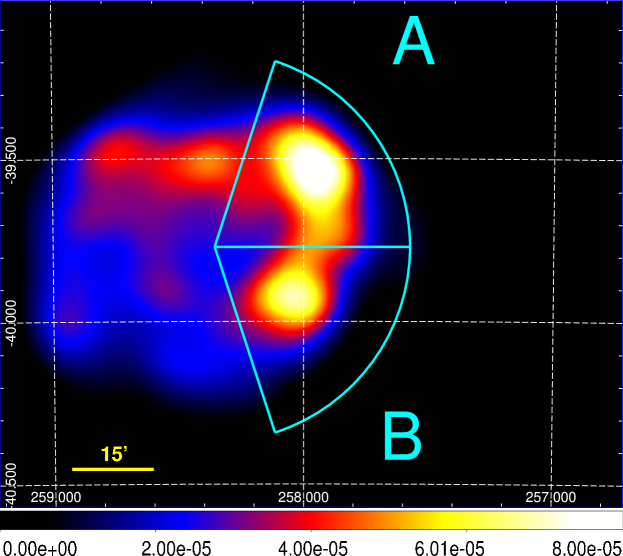
Fig. 2 shows the detailed keV XMM-Newton image of RX J1713 with positions of hard X-ray sources A and B. As seen from the image, the positions of A and B are spatially consistent with the brightest parts of the northwest and the southwest rim of the SNR, respectively. Fig. 3 shows the IBIS/ISGRI image of RX J1713 in the 17–27, 27–36 and 36–50 keV energy bands. The shell-like structure of the SNR is readily visible in the softest IBIS/ISGRI keV band. It is also clearly seen in hard X-ray band, up to keV. Note that source A appears fainter than B in the 27–36 keV energy bands. This could simply be the result of statistical fluctuations or an artifact of the image reconstruction method for a weak source in a densely populated environment of nearby sources (see, e.g. Krivonos et al., 2010), which might increase the noise level. At higher energies of 50–120 keV, the image is dominated by noise, although a hint of a positive excess over the RX J1713 shell region might be present, albeit with low significance.
The IBIS/ISGRI hard X-ray image of RX J1713 also contains a bright X-ray source with the flux111The flux units are in mCrab, where 1 mCrab in the 17–60 keV energy band corresponds to the flux of erg s-1 cm-2 for a source with a spectrum similar to that of the Crab Nebula, represented as keV photons cm-2 s-1 keV-1. of mCrab ( keV) located from source B in the south-west direction. Its centroid position RA=, Dec.= is consistent with the 1RXS J170849.0–400910 source discovered in the ROSAT All-Sky Survey (Voges et al., 1999) and identified as an anomalous X-ray pulsar using the ASCA observations (Sugizaki et al., 1997).
3.1 2D image analysis
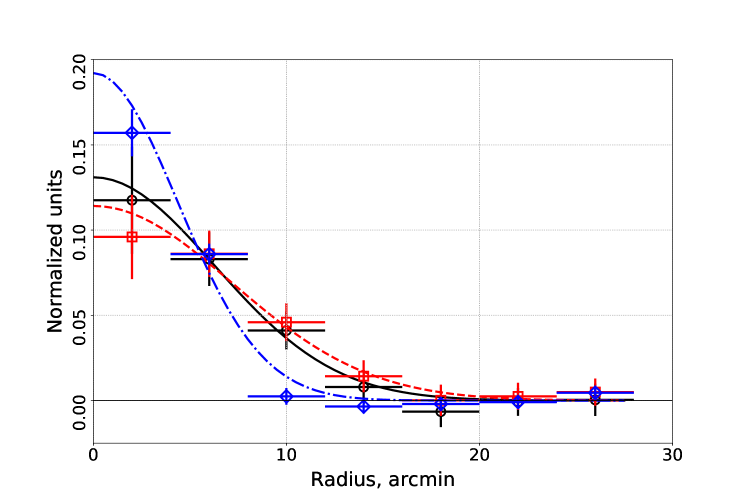
In the standard X-ray band, the brightest regions A and B are clearly extended, with a characteristic size of , i.e. comparable to the PSF FWHM of the IBIS telescope. Assuming that the same emission mechanism is operating in the hard band, we expect their extended nature to show up in the IBIS data too. To verify this conjecture, we compare 17–60 keV radial profiles of the sources A and B with that of the point-like source 1RXS J170849.0–400910. The latter is expected to be consistent with the PSF of the IBIS telescope. The radial profiles were extracted relative to the corresponding centroid position, and re-normalized to the unit integral value for convenience. The extracted radial profiles are shown in Fig. 4. We fitted the profiles with the Gaussian function with a center fixed at the zero value. As a result, we obtained the following Gaussian standard deviations , and , respectively, for A, B, and 1RXS J170849.0–400910. The width of the latter is consistent with of the IBIS PSF. The spatial extent of A and B is systematically (albeit, marginally) larger than the IBIS PSF, suggesting that the IBIS/ISGRI image of RX J1713 follows the morphology of the SNR, and it is not consistent with two hard X-ray point-like sources seen in projection on RX J1713 shell.
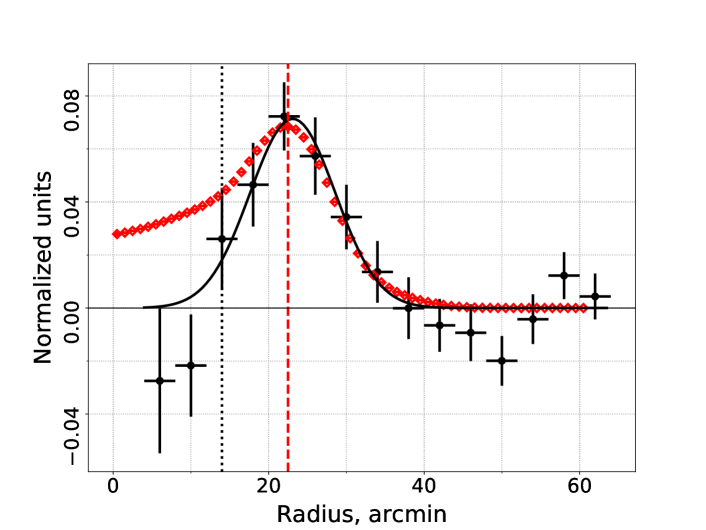
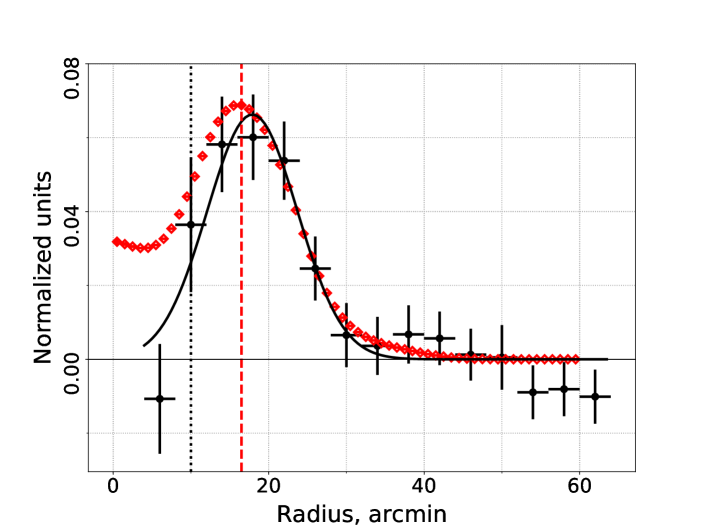
However, since RX J1713 has a shell-like typical SNR morphology, we then extracted the IBIS/ISGRI radial profiles for A and B sources relative to the center of the shell-like structure located at RA= and Dec.=. The center coordinates were taken from a three-dimensional spherical shell model evaluated on H.E.S.S. atmospheric Cherenkov telescope data (H. E. S. S. Collaboration et al., 2018). The radial profiles were extracted from both the IBIS/ISGRI and XMM-Newton (MOS1+2) images in two corresponding sectors with the opening angle of as shown in Fig. 5. To compare IBIS and XMM-Newton radial profiles, we renormalized profiles in range (sector A) and (sector B). Note that the XMM-Newton image was convolved with the IBIS PSF. Before the convolving procedure, we also removed from the XMM-Newton image a circular region with the bright X-ray source 1WGA J1713.4–3949, which is probably a neutron star and the central compact object of SNR RX J1713 (Lazendic et al., 2003; Cassam-Chenaï et al., 2004).
The extracted radial profiles of A and B are shown in Fig. 6. We fitted the IBIS radial profiles with a simple Gaussian function to estimate the offset of the shell-like structure relative to the center. The best-fit model parameters are listed in Table 2. The obtained best-fit Gaussian functions for the sectors A and B have comparable widths but they are significantly shifted relative to each other, however, consistent with the corresponding peaks of the XMM-Newton radial profiles.
| Parameter | Sector A | Sector B |
|---|---|---|
| Amplitude, mCrab | ||
| Offset position | ||
| /d.o.f. | ||
| XMM-Newton peak emission offset |
Note that a double-shell structure along the western limb of the remnant is clearly seen in the soft X-ray XMM-Newton image of RX J1713 (see Fig. 2). Presumably, the outer shell is caused by a forward shock wave, while the inner one is due to a shock wave reflected from the nearest molecular cloud (Tsuji et al., 2019). Because of insufficient angular resolution ( FWHM) of IBIS, we cannot directly detect a double-shell structure. However, after convolving the XMM-Newton image with the IBIS PSF, we see the similar shell-like structure dominated by two bright clumps whose positions are consistent with the IBIS A and B hard X-ray excesses (see Fig. 5). This agreement indicates that a double-shell structure is likely to be remaining in hard X-rays, too.
4 Spectral analysis
X-ray spectra of supernova remnants carry an unique information about a cosmic rays acceleration at expanding shocks. In particular, the hard X-ray spectrum of RX J1713 can shed light on the diffusion regime of electrons in the SNR shock region Zirakashvili & Aharonian (2007). Since the observations in the hard X-ray energy band are complicated due to many different factors (e.g., a modest angular resolution or even non-imaging, background-dominated measurements, systematic noise, stray-light, low signal-to-noise ratio, etc.), the information about hard X-ray emission of RX J1713 is limited. Thanks to the long-term INTEGRAL observations of the Galactic Center, we now can significantly detect the RX J1713 emission up to keV and improve its spectral information in hard X-rays.
We extracted the RX J1713 spectrum in the keV energy band from the IBIS/ISGRI images in fractional units of the Crab Nebula flux (mCrab, see note in Sect. 3) which can be directly converted to physical units. According to the matched-filter approach (Vikhlinin et al., 1995), the optimal way to collect the flux of a point-like source (and hence, to obtain the highest signal-to-noise ratio), is to use images convolved with the telescope instrumental PSF. For an extended source, the convolution kernel should reflect the size and morphology of the object, as it was done by Lutovinov et al. (2008) to study the hard X-ray emission of the Coma cluster using IBIS/ISGRI data. For this reason, we extended the size of the Gaussian kernel from to , which is the average value between and determined in Sect. 3.1. To build the spectrum, we extracted fluxes of the A and B sources from the images in the corresponding energy bands. The source flux has been extracted from the positions of A and B estimated in the keV band, since the image in this band has the highest significance. Note that the highest keV energy band is dominated by the background (Fig. 3). However, some hint of the positive overall excess over the entire SNR region is noticed. Finally, to make the overall spectrum of RX J1713 (see Fig. 7), we summed up A and B spectra to reduce statistical errors. The resulting spectrum was fitted with a pegged power-law model in the keV energy band with the following best-fitting model parameters: , flux erg cm-2s-1, and fit statistics (reduced for 2 d.o.f.).
To validate the obtained IBIS/ISGRI spectrum of RX J1713, we extract the spectrum of the nearby point source 1RXS J170849.0–400910 by the same method, except that we used the Gaussian kernel with as the standard IBIS instrumental PSF. The spectrum of 1RXS J170849.0–400910 is over-plotted in Fig. 7 without any re-normalization. The spectrum is well described by a simple power-law model (, normalization at 1 keV ph keV-1 cm-2 s-1, for 2 d.o.f.), which is consistent with spectral characteristics previously obtained from the INTEGRAL data by den Hartog et al. (2008), indicating that our IBIS/ISGRI flux determination procedure is correct.
4.1 IROS procedure
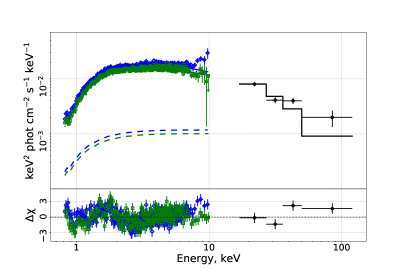
In the IBIS sky image reconstruction algorithm, we use the procedure of Iterative Removal Of Sources (IROS, for details see Goldwurm et al. (2003); Krivonos et al. (2005, 2010)), which allows us to remove the false appearance (“ghosts”) of known X-ray sources, a by-product of a replicated IBIS mask pattern. The IROS removes the contribution from the brightest sources first, gradually moving to the weaker ones, since the source flux is evaluated assuming that there is only one source in the IBIS field of view. Because of large uncertainties of the flux estimates in the individual observations for weak sources, a systematic error appears in the final image. We extracted the combined spectrum of RX J1713 without applying the IROS, to check for possible systematic effects on the final spectrum. Note that IROS was applied to all other sources in the IBIS FOV, including nearby 1RXS J170849.0–400910. The spectrum of RX J1713 without IROS (shown in Fig. 8) is well described by a power-law model with the following best-fit parameters: , erg cm-2s-1, and fit statistics for 2 d.o.f. Note that the photon index does not change significantly. However, the flux normalization decreases by a factor of 2. We conclude that the IROS procedure may introduce some systematic bias in the flux determination of RX J1713, however its impact on the spectral shape seems non-significant.
4.2 Broad-band spectrum
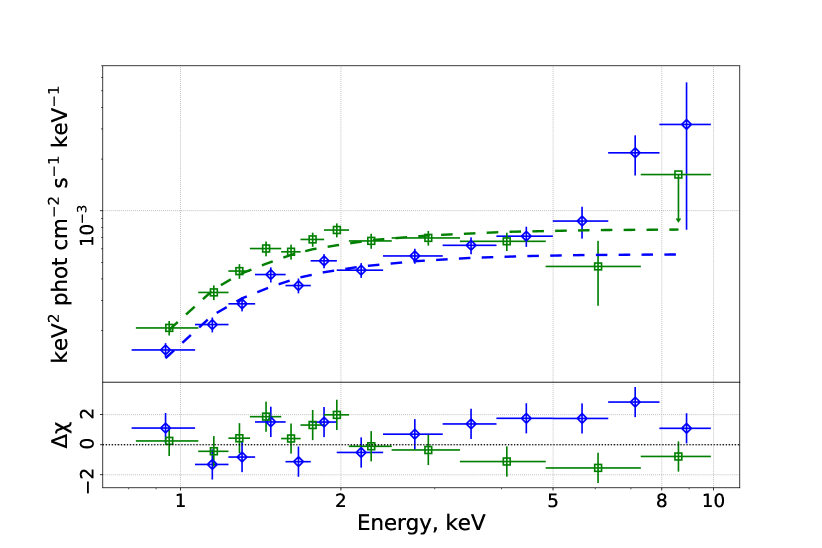
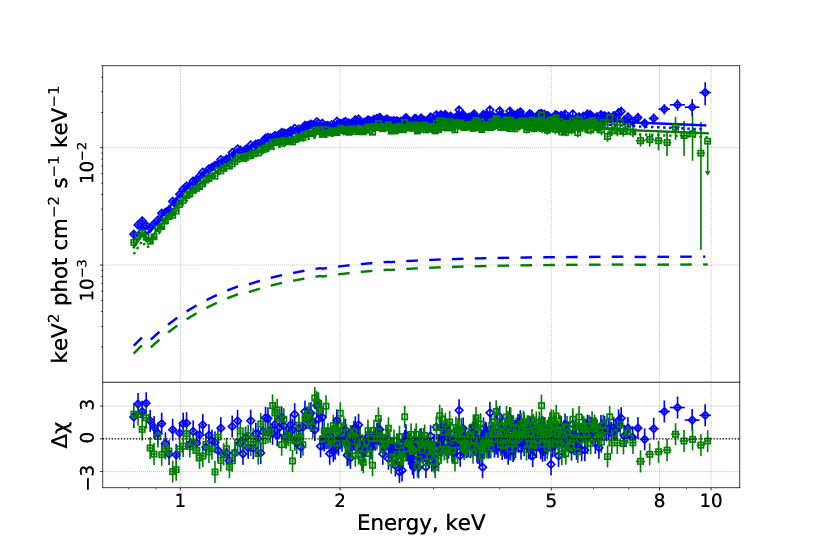
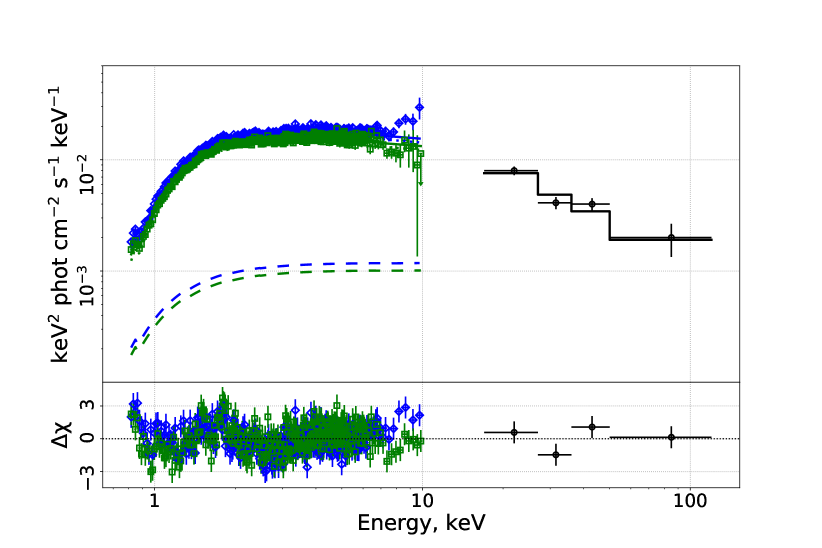
To obtain the broad-band X-ray spectrum of RX J1713, we used the XMM-Newton MOS1+2 data in the 0.8–10 keV energy range. We chose circular regions for A and B sources (Fig. 2) with , what corresponds to the FWHM of the IBIS PSF. As background regions, we utilized two corresponding elliptical regions denoted as bgd A and bgd B in Fig. 2. The background spectra were fitted by an absorbed power-law model with the following best-fit parameters: cm-2, , ph keV-1 cm-2 s-1, the cross-normalization constant between bgd A and bgd B regions , and fit statistics . Note, that for the photoelectric absorption, we used the model (Wilms et al., 2000) with the corresponding chemical abundances and absorption cross-sections by Verner et al. (1996). Then, following the method described in Acero et al. (2009), the best-fit background model was applied in the source fitting procedure with all parameters fixed. We recalculated the normalization parameter to the areas ratio of the background bgd A and the source A regions and fixed it at ph keV-1 cm-2 s-1. The final 0.8–10 keV spectra of regions A and B (Fig. 9) are well described by an absorbed power-law model with the best-fit parameters listed in Table 3.
Since we are dealing with extended sources, it is difficult to guarantee that the spectra are effectively extracted from exactly the same region, especially for the coded mask telescopes such as IBIS. There are two possibilities to mitigate this problem. For instance, one can untie the normalizations of the spectra obtained with different telescopes. Another option is to fit individual spectra and then plot the slope as a function of energy. Here, we pursue the former option.
| Parameter | Units | Value |
|---|---|---|
| cm-2 | (fixed) | |
| (fixed) | ||
| ph keV-1 cm-2 s-1 | (fixed) | |
| cm-2 | ||
| ph keV-1 cm-2 s-1 | ||
| /d.o.f. | ||
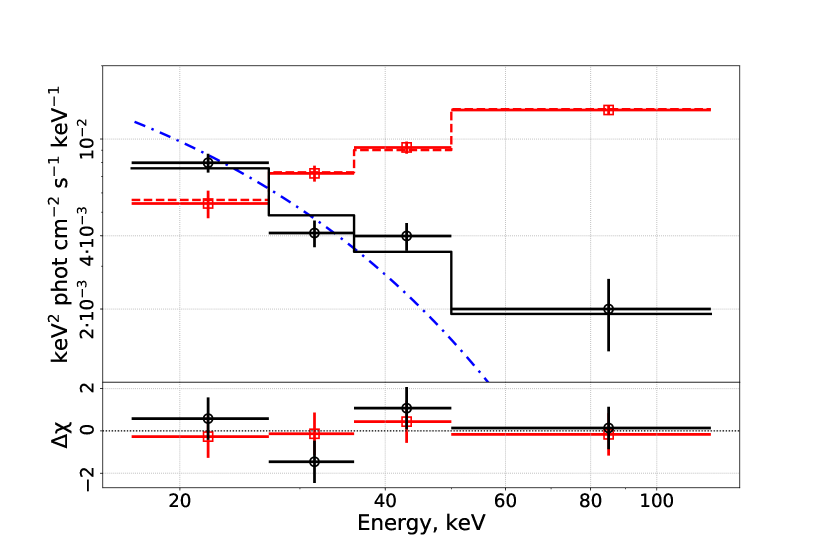
The spectrum of RX J1713 in the soft X-rays is well described by a power-law model with the photon index of , which differs significantly from that observed in hard X-rays where . This indicates a change in the slope of the power-law between somewhere around 10–20 keV. We checked whether the change in the slope is consistent with a power law with an exponential cutoff (cutoffpl) at high energies or a broken power-law (bknpower). When XMM-Newton MOS1+2 and IBIS data are simultaneously fitted by these models, the quality of the IBIS data do not allow us to constrain the cutoff or break energy. We, therefore, fixed this value to 17 keV, i.e., at the lower end of the IBIS energy range. The best-fit model parameters are listed in Table 4 and the broad-band spectrum approximated by the bknpower model is shown in Fig. 10. The spectral shape of the cutoffpl model is also shown in Fig. 7. The calculated null-hypothesis probabilities of cutoffpl and bknpower models for the IBIS data points are 0.04% and 16%, respectively. Thus, we come to the conclusion that the INTEGRAL spectrum of RX J1713 in the 17–120 keV energy band favors the broken power-law model rather than the model of the power-law with an exponential cutoff (at least when the cutoff or break energy is fixed to 17 keV).
| Parameter | Units | Bknpower | Cutoffpl |
|---|---|---|---|
| cm2 | |||
| / | keV | (fixed) | (fixed) |
| — | |||
| ph keV-1 cm-2 s-1 | |||
| (fixed) | (fixed) | ||
| /d.o.f. |
5 Discussion
| Parameter | Units | Equation (1) | Equation (2) |
|---|---|---|---|
| cm2 | |||
| keV | |||
| (fixed) | (fixed) | ||
| /d.o.f. |
The above results qualitatively agree with Tsuji et al. (2019), who for the cutoffpl model obtained the cutoff energy at keV (the first and second errors correspond to the statistic and systematic errors), which is close to our adopted value of 17 keV. In addition, Tsuji et al. (2019) found that the NuSTAR spectrum of RX J1713 in the 3–20 keV band, is well described by the power-law model with the photon index of , which agrees with our conclusion on the steepening of the power law slope in the hard X-ray band.
As regards physically motivated spectral models, we use the model of Zirakashvili & Aharonian (2007) (hereafter ZA07), who gave an analytic approximation of the synchrotron emission of electrons accelerated by a non-relativistic shock-wave in a shell-type SNR, assuming that synchrotron losses dominate. Two flavors of this model are proposed by ZA07:
| (1) |
and
| (2) |
where is the observed spectrum in units of and is the photon energy. The former expression corresponds to the case when the ratio of the magnetic field strength upstream to downstream (magnetic field is perpendicular to the shock front), while the latter is for (isotropic magnetic field). In both cases, the compression factor is assumed (see Zirakashvili & Aharonian, 2007, for details). The parameter is set by a competition of the synchrotron losses and the particle energy gain due to acceleration at the shock front, and depends, in particular, on the shock velocity and on the departures of the particle diffusion coefficient from the Bohm value. It does not correspond to an apparent cutoff or a break energy in the observed spectrum, because the power-law term with a positive index effectively compensates the slow exponential term at energies. Accordingly, the break/cutoff shows up at higher energies than .
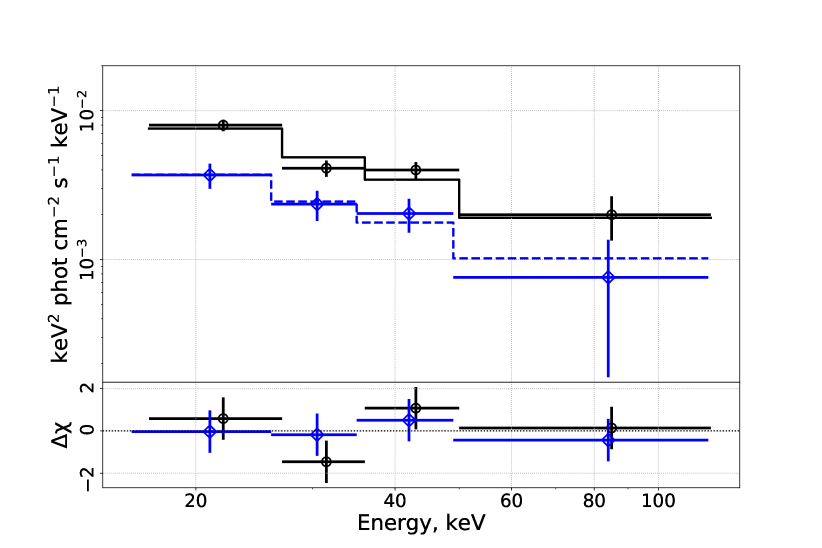
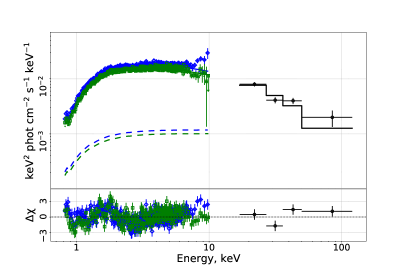
We fitted the broad-band spectrum of RX J1713 with ZA07 model adding it as XSPEC table model (see Fig. 11). The model is in a good agreement with the XMM-Newton MOS1+2 and INTEGRAL data for both cases of (see Table 5). The estimations of at keV and keV for Eqs. (1) and (2), respectively, are consistent with Tsuji et al. (2019).
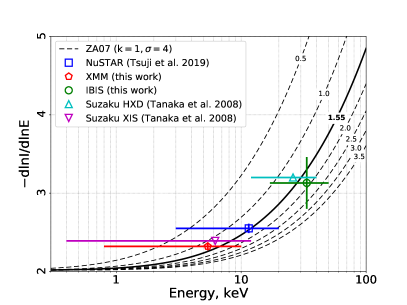
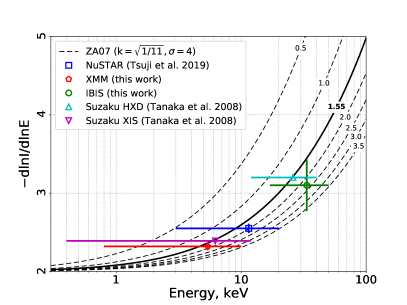
To avoid the normalization uncertainties of the RX J1713 spectra obtained with different telescopes, we plot individual slopes as a function of energy. To this end, we used the photon indexes of RX J1713 measured by NuSTAR (Tsuji et al., 2019) and Suzaku/XIS/HXD (Tanaka et al., 2008) along with the XMM-Newton and INTEGRAL photon indexes measured in this work. In Fig. 12, we compare the running photon index for the two ZA07 models given by Eqs. (1) and (2) with the available observational data. The running photon index is evaluated as and shown in Fig. 12 with dashed lines, corresponding to different values of . It is clear that qualitatively the progressive steepening of the spectrum is consistent with the ZA07 models, although uncertainties in observational data are substantial. In terms of the parameter , both models suggest comparable values and for Eqs. (1) and (2), respectively, which are consistent with values obtained from fitting procedure (see Table 5). As expected, the model corresponding to (see Eq. (2)), prefers slightly higher values of than the model with . For the estimated shock velocity in RX J1713 and the diffusion coefficient close to the Bohm limit, the value of predicted by ZA07 model is (Tsuji et al., 2019). Therefore, the IBIS data up to 50 keV in combination with the data of other observatories are consistent with the assumption that the shock in RX J1713 operates in a regime close to the Bohm limit.
6 Summary
In this paper, we presented the first detailed study of RX J1713 with INTEGRAL/IBIS/ISGRI in the hard X-ray energy band. The images of RX J1713 obtained in the 17–27, 27–36, 36–50, and 17–60 keV bands are in a good agreement with the more detailed 1–10 keV XMM-Newton map of RX J1713, which points to a single emission mechanism operating in the soft and hard X-ray bands. The hard X-ray IBIS/ISGRI image of RX J1713 is dominated by two extended X-ray sources spatially coincident with the brightest parts of the SNR. Considering the shell structure of RX J1713, we find a good agreement between the position of the shocks in the hard and soft X-ray bands.
The spectral analysis of the IBIS data shows that in the 17–120 keV energy band, the RX J1713 spectrum is well described by a power-law model with , which is significantly steeper than determined from XMM-Newton/MOS1+2 data in the 1–10 keV band. The difference in indexes points toward a change in the slope of the power-law spectrum during the transition from the soft to the hard X-ray bands.
Simultaneous fitting of the XMM-Newton MOS1+2 and IBIS data reveals that IBIS data are better described by a broken power-law model than by an exponential cutoff model, if the break and cutoff energies are fixed to 17 keV for both models. Obtaining better constraints is difficult, since we are dealing with the complex diffuse source and absolute normalizations of the XMM-Newton and IBIS spectra for extended regions are hard to get, especially for the coded-mask telescopes.
Nevertheless, the diagram, which is free from the normalization issues shows that the photon index estimate based on the IBIS data is not dissimilar from the predictions of the Zirakashvili & Aharonian (2007) analytical model of the synchrotron-photon spectrum of electrons accelerated by non-relativistic shock-wave in a young shell-type SNR. We conclude that this model well describes the observational data with energy keV, in agreement with expectations for the acceleration regime close to the Bohm limit.
Acknowledgments
This work is based on observations with INTEGRAL, an ESA project with instruments and the science data centre funded by ESA member states (especially the PI countries: Denmark, France, Germany, Italy, Switzerland, Spain), and Poland, and with the participation of Russia and the USA. This work is supported by the Russian Science Foundation (grant 19-12-00369).
References
- Acero et al. (2009) Acero F., Ballet J., Decourchelle A., Lemoine- Goumard M., Ortega M., Giacani E., Dubner G., Cassam-Chenaï G., 2009, A&A, 505, 157
- Aharonian et al. (2004) Aharonian F. A., et al., 2004, Nature, 432, 75
- Aharonian et al. (2006) Aharonian F., et al., 2006, A&A, 449, 223
- Aharonian et al. (2007) Aharonian F., et al., 2007, A&A, 464, 235
- Blasi (2013) Blasi P., 2013, A&ARv, 21, 70
- Butt et al. (2001) Butt Y. M., Torres D. F., Combi J. A., Dame T., Romero G. E., 2001, ApJ, 562, L167
- Cassam-Chenaï et al. (2004) Cassam-Chenaï G., Decourchelle A., Ballet J., Sauvageot J. L., Dubner G., Giacani E., 2004, A&A, 427, 199
- Churazov et al. (2003) Churazov E., Forman W., Jones C., Böhringer H., 2003, ApJ, 590, 225
- Churazov et al. (2014) Churazov E., et al., 2014, Nature, 512, 406
- Di Cocco et al. (2003) Di Cocco G., et al., 2003, A&A, 411, L189
- Eckert et al. (2007) Eckert D., Neronov A., Courvoisier T. J.-L., Produit N., 2007, A&A, 470, 835
- Eckert et al. (2008) Eckert D., Produit N., Paltani S., Neronov A., Courvoisier T. J.-L., 2008, A&A, 479, 27
- Enomoto et al. (2002) Enomoto R., et al., 2002, Nature, 416, 823
- Fukui et al. (2003) Fukui Y., et al., 2003, Publications of the Astronomical Society of Japan, 55, L61
- Goldwurm et al. (2003) Goldwurm A., et al., 2003, A&A, 411, L223
- Gros et al. (2003) Gros A., Goldwurm A., Cadolle-Bel M., Goldoni P., Rodriguez J., Foschini L., Del Santo M., Blay P., 2003, A&A, 411, L179
- H. E. S. S. Collaboration et al. (2018) H. E. S. S. Collaboration et al., 2018, A&A, 612, A6
- Harrison et al. (2013) Harrison F. A., et al., 2013, The Astrophysical Journal, 770, 103
- Hiraga et al. (2005) Hiraga J. S., Uchiyama Y., Takahashi T., Aharonian F. A., 2005, A&A, 431, 953
- Katsuda et al. (2015) Katsuda S., et al., 2015, ApJ, 814, 29
- Koyama et al. (1995) Koyama K., Petre R., Gotthelf E. V., Hwang U., Matsuura M., Ozaki M., Holt S. S., 1995, Nature, 378, 255
- Koyama et al. (1997) Koyama K., Kinugasa K., Matsuzaki K., Nishiuchi M., Sugizaki M., Torii K., Yamauchi S., Aschenbach B., 1997, Publications of the Astronomical Society of Japan, 49, L7
- Krivonos et al. (2005) Krivonos R., Vikhlinin A., Churazov E., Lutovinov A., Molkov S., Sunyaev R., 2005, ApJ, 625, 89
- Krivonos et al. (2007) Krivonos R., Revnivtsev M., Lutovinov A., Sazonov S., Churazov E., Sunyaev R., 2007, A&A, 475, 775
- Krivonos et al. (2010) Krivonos R., Revnivtsev M., Tsygankov S., Sazonov S., Vikhlinin A., Pavlinsky M., Churazov E., Sunyaev R., 2010, A&A, 519, A107
- Krivonos et al. (2017) Krivonos R. A., Tsygankov S. S., Mereminskiy I. A., Lutovinov A. A., Sazonov S. Y., Sunyaev R. A., 2017, MNRAS, 470, 512
- Lazendic et al. (2003) Lazendic J. S., Slane P. O., Gaensler B. M., Plucinsky P. P., Hughes J. P., Galloway D. K., Crawford F., 2003, ApJ, 593, L27
- Lebrun et al. (2003) Lebrun F., et al., 2003, A&A, 411, L141
- Lutovinov et al. (2008) Lutovinov A. A., Vikhlinin A., Churazov E. M., Revnivtsev M. G., Sunyaev R. A., 2008, ApJ, 687, 968
- Madsen et al. (2017) Madsen K. K., Christensen F. E., Craig W. W., Forster K. W., Grefenstette B. W., Harrison F. A., Miyasaka H., Rana V., 2017, Journal of Astronomical Telescopes, Instruments, and Systems, 3, 044003
- Moriguchi et al. (2005) Moriguchi Y., Tamura K., Tawara Y., Sasago H., Yamaoka K., Onishi T., Fukui Y., 2005, ApJ, 631, 947
- Muraishi et al. (2000) Muraishi H., et al., 2000, A&A, 354, L57
- Okuno et al. (2018) Okuno T., Tanaka T., Uchida H., Matsumura H., Tsuru T. G., 2018, Publications of the Astronomical Society of Japan, 70, 77
- Pfeffermann & Aschenbach (1996) Pfeffermann E., Aschenbach B., 1996, in Zimmermann H. U., Trümper J., Yorke H., eds, Roentgenstrahlung from the Universe. pp 267–268
- Slane et al. (1999) Slane P., Gaensler B. M., Dame T. M., Hughes J. P., Plucinsky P. P., Green A., 1999, ApJ, 525, 357
- Sugizaki et al. (1997) Sugizaki M., Nagase F., Torii K., Kinugasa K., Asanuma T., Matsuzaki K., Koyama K., Yamauchi S., 1997, PASJ, 49, L25
- Takahashi et al. (2008) Takahashi T., et al., 2008, Publications of the Astronomical Society of Japan, 60, S131
- Tanaka et al. (2008) Tanaka T., et al., 2008, ApJ, 685, 988
- Tsuji et al. (2019) Tsuji N., Uchiyama Y., Aharonian F., Berge D., Higurashi R., Krivonos R., Tanaka T., 2019, The Astrophysical Journal, 877, 96
- Ubertini et al. (2003) Ubertini P., et al., 2003, A&A, 411, L131
- Uchiyama et al. (2003) Uchiyama Y., Aharonian F. A., Takahashi T., 2003, A&A, 400, 567
- Verner et al. (1996) Verner D. A., Ferland G. J., Korista K. T., Yakovlev D. G., 1996, ApJ, 465, 487
- Vikhlinin et al. (1995) Vikhlinin A., Forman W., Jones C., Murray S., 1995, ApJ, 451, 542
- Voges et al. (1999) Voges W., et al., 1999, A&A, 349, 389
- Wang et al. (1997) Wang Z. R., Qu Q.-Y., Chen Y., 1997, A&A, 318, L59
- Wilms et al. (2000) Wilms J., Allen A., McCray R., 2000, ApJ, 542, 914
- Winkler et al. (2003) Winkler C., et al., 2003, A&A, 411, L1
- Zirakashvili & Aharonian (2007) Zirakashvili V. N., Aharonian F., 2007, A&A, 465, 695
- den Hartog et al. (2008) den Hartog P. R., Kuiper L., Hermsen W., 2008, A&A, 489, 263