Magnetic and electric behaviors of DyMn2O5: effect of hole doping
Abstract
DyMn2O5 is an intriguing multiferroic material showing multiple magnetic, electric and structural transitions. We present here the systematic study on the effect of Sr doping at the Dy site of DyMn2O5 through magnetic and dielectric measurements. Doping of divalent Sr at the Dy site is expected to enhance the Mn4+:Mn3+ ratio and it will also dilute the Dy site. Our study indicates large enhancement in the magnetic anomaly observed close to 43 K, which we believe to be related to the increased ferromagnetic correlations on Sr doping. Gradual increase in coercive field at 3 K with the Sr doping and decrease in bond length of adjacent Mn4+ ions further support the enhancement of ferromagnetic corelations in the system. The parent sample shows a large magnetocaloric effect around 12 K, the magnitude of which found to decrease with increasing Sr concentration. The doping also enhances the anomaly at around 28 K observed in the dielectric permittivity versus temperature data, and this anomaly was earlier claimed to be associated with the spin reorientation as well as a simultaneous transition from one ferroelectric state to other. The electric orderings observed below 25 K are found to be susceptible to the applied magnetic field, and supports the view of Ratcliff II et al.(Phys. Rev. B 72, 060407(R)(2005)) of concomitant changes in the magnetic structure associated with the multiple electric transitions.
I Introduction
Orthorhombic RMn2O5 (R = rare-earth ion) type manganites have been studied extensively in recent times due to their exotic magnetic as well as multiferroic properties. Abrahams and Bernstein (1967); Higashiyama et al. (2004); Hur et al. (2004a); Cruz et al. (2006a); Hur et al. (2004b); Inomata and Kohn (1996); Nakamura and Kohn (1997); Chattopadhyay et al. (2016); Yang et al. (2016); Sanina et al. (2011); Kagomiya et al. (2002) RMn2O5 is a mixed valent material consisting of both Mn3+ and Mn4+ ions in equal proportion. These materials show fascinating multiple magnetic transitions as a function of temperature. The magnetic interactions in these compounds are quite complicated with the presence of frustration. Cheong (2007) The spin induced electric polarization in these compounds primarily originates from exchange striction mechanism, as the magnetic structures are nearly colinear. Brink and Khomskii (2008); Balédent et al. (2015)
The crystal structure of RMn2O5 consists of edge-sharing Mn4+O6 octahedra and Mn3+O5 pyramids. The Mn4+O6 octahedra form ribbons running along the axis. Two such adjacent ribbons are separated alternatively by layers of Mn3+ and R3+ ions. The nearest and next nearest neighbour magnetic interactions and are between two Mn4+ ions through R3+ and Mn3+ layers respectively. is found to be stronger and it is ferromagnetic (FM) in nature. When viewed along the direction, five Mn ions (two Mn4+ and three Mn3+) are found to form loop with the R3+ ion at the centre. The interactions and between neighbouring Mn4+ and Mn3+ ions in the loop are antiferromagnetic (AFM) in nature. Similarly between Mn3+ and Mn3+ is also AFM. Evidently, due to the presence of AFM interactions (, and ) in the loop, a certain degree of magnetic frustration is obvious. Noda et al. (2008); Radaelli and Chapon (2008)
In the present work, we studied the compound DyMn2O5 and its hole doped derivatives. The parent compound orders magnetically from a paramagnetic (PM) to an incommensurate antiferromagnetic (IC-AFM) state below 43 K. Powder neutron diffraction studies, both on single crystalline and polycrystalline samples, indicate that this IC-AFM phase continues to exist down to 9 K. Chattopadhyay et al. (2017); Blake et al. (2005) Below 9 K, the magnetic structure becomes commensurate (C-AFM) in nature with the concomitant ordering of the Dy sublattice. A small fraction of the IC-AFM phase still remains untransformed even below 9 K. However, there are several other reports claiming the presence of additional magnetic transitions intermediate between 9 and 43 K. Zhao et al. (2014a) Ratcliff II et al finds a significantly complex phase diagram with other magnetic transitions at 40 K, 28 K, 20 K based on their single-crystal neutron diffraction studies, along with the coexistence of multiple magnetic phases (both C-AFM and IC-AFM) below 28 K. Ratcliff II et al. (2005)
Just below the magnetic transition at 43 K, the DyMn2O5 shows a transformation into a ferroelectric (FE) state with the emergence of spontaneous polarization at 40 K (from paraelectric to FE1 state). It also shows multiple anomalies in polarization, some of which are linked with the spin ordering temperatures. Polarisation shows anomalies due to the change in the ferroelectric states at 28 K (from FE1 to FE2) and 20 K (from FE2 to FE3) while cooling. Finally, it shows clear anomaly at 9 K due to the onset of a ferrielectric state, and it is linked to the magnetic ordering of rare-earth sublattice. Higashiyama et al. (2004); Zhao et al. (2014a); Sushkov et al. (2014)
DyMn2O5 is a mixed-valent manganite containing both Mn3+ and Mn4+ ions. The fascinating and multiple phase transitions, as well as multiferroic properties, is connected to the mixed valent nature of Mn. In the present work, we have tuned the Mn3+ and Mn4+ ratio by doping divalent Sr at the Dy site. The present work aims to ascertain the role of enhanced Mn4+ concentration on the magnetic and multiferroic properties of this complex oxide.
II Experimental Details
The desired polycrystalline samples of nominal compositions Dy1-xSrxMn2O5 ( = 0.0, 0.1 and 0.2) were prepared by the conventional solid-state reaction method. Required amount of Dy2O3, SrCO3, and Mn(CH3COO)2.4H2O with purity 99.9% were mixed thoroughly and heated at 900∘C for 24 h. The resultant products were sintered at 1150∘C for 72 h in pellet form with three intermediate grindings. Room temperature powder X-ray diffraction (PXRD) patterns were recorded in a PANalytical X-ray diffractometer using Cu K radiation. The dc magnetization () was measured using a vibrating sample magnetometer attached with the commercial cryogen-free high magnetic field system from Cryogenic Ltd., U.K. in the temperature () range between 3-300 K in the presence of applied magnetic field () = 0-150 kOe. Dielectric permittivity () was measured by an LCR meter (Agilent E4980a) attached to a closed cycle refrigerator. A thin rectangular and polished piece of each sample was used for measurement, and electrodes are made on two polished surfaces using thin layers of silver paste. Pyroelectric current density () was recorded in an electrometer (Keithley, model 6517B) connected to the PPMS-II system (Quantum Design). First the sample was cooled down to 100 K and then a poling electric filed () of +5 kV/cm (or -5 kV/cm) was applied to the sample until the sample was further cooled down to 2 K. At 2 K the sample was short-circuited for a time of 40 min to release the accumulated charges in the sample. Finally the sample was heated at a constant temperature sweep rate of 5 K/min and the data were collected during this warming process. was also measured in presence of 50 kOe magnetic field in two different cooling conditions namely (i) zero field cooled and (ii) field cooled.
III Results
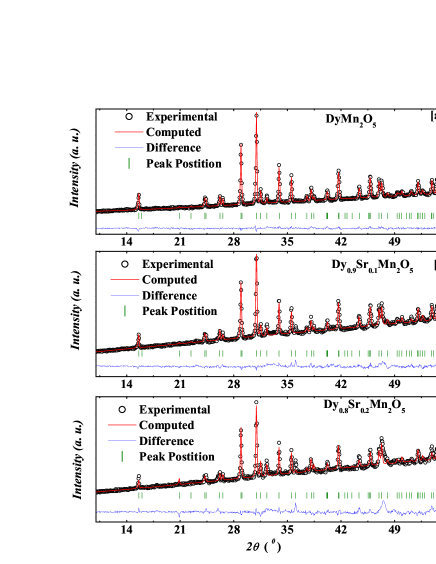
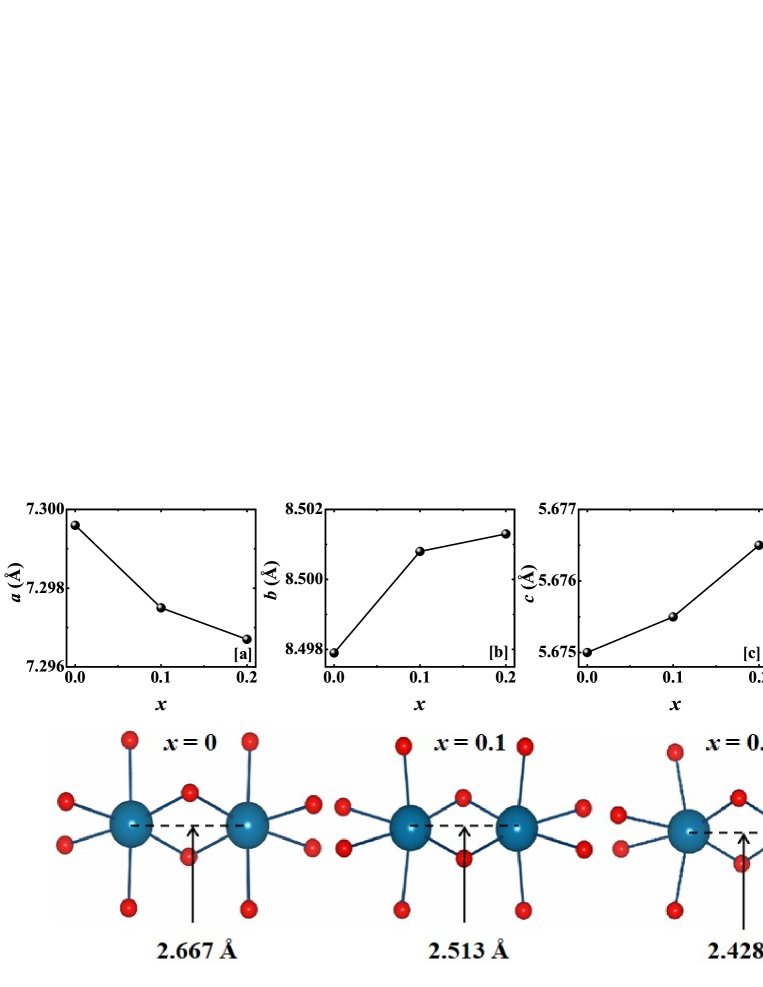
Fig. 1 shows the PXRD patterns of the studied compounds measured at room temperature. We have analyzed our PXRD data using MAUD software package Lutterotti et al. (1997), and the pattern can be well fitted considering orthorhombic structure with space group . The variation of lattice parameters (, , and ), and lattice volume () with is depicted in the upper panel of fig. 2. The parameters and increase with , while decreases with an overall increase in the lattice volume. This is because the 2+ ionic radius of Sr is larger than 3+ ionic radius of Dy. Fig. 2 (bottom panel) shows the variation of bond distance between adjacent Mn4+ ions on the chain, and a clear decrease in the bond length is observed with .
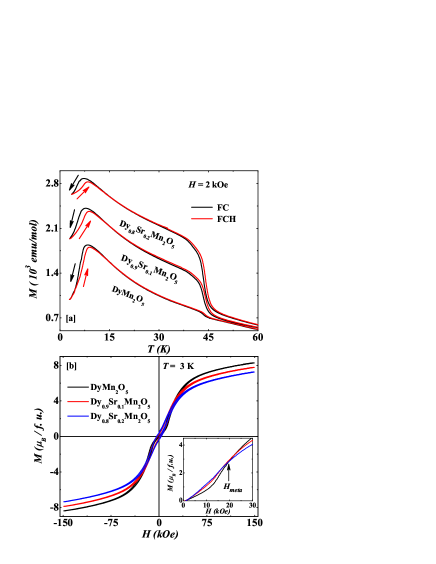
Fig. 3 (a) denotes the versus data recorded at = 2 kOe. The doped samples show two prominent features in the magnetic data, namely at around 43 K and 9 K. The 43 K anomaly can be assigned to the long-range magnetic ordering into an IC-AFM state. On the other hand, the 9 K anomaly is due to the magnetic ordering of Dy sublattice. Although the 9 K anomaly is quite strong in the pure sample, the 43 K one is rather weak, and it is visible only as a small kink. It is evident that the strength of the 43 K anomaly turns considerably stronger in the doped compositions, while the 9 K anomaly turns weaker. One notable observation is the presence of thermal hysteresis both around the 9 K and 43 K transitions. The 9 K thermal hysteresis is quite clear, with the width of the hysteresis being more than 2 K for = 0.2 sample, while the hysteresis at 43 K transition has a width of 0.6 K for the same sample. The first order nature of the transition at 9 K was already known, Ratcliff II et al. (2005); Mihailova et al. (2005) although the existing literature does not discuss on the order of the transition at 43 K. The width of the thermal hysteresis observed in the present work around 43 K is small, but it is reproducible in all three samples. The FE transition at 40 K as well as the magnetic transition at 43 are associated with lattice distortion. Therefore, the thermal hysteresis around 43 K is likely to be an effect of first order lattice distortion in the said temperature range. Blake et al. (2005); Cruz et al. (2006b)
The magnetic susceptibility () versus data obey Curie-Weiss law above 120 K. We have obtained the effective paramagnetic moment () and Curie temperature () from the linear 1/ versus plot between 120-300 K and their values are tabulated in table 1. For the pure compound, the value of is found to be 12.42 /f.u., which is quite close to the value of 12.35 /f.u. expected for the system with Mn3+ in the high spin state. The negative value of indicates predominantly AFM correlations in the system. With Sr doping, the value of gradually decreases. In table 1, we have compared the theoretical and experimental value of the moments in three compositions, and the experimentally observed moments closely follow the theoretical moment values. Here theoretical moment is calculated by the relation,
where , , are respectively the number of atoms of Dy, Mn3+ and Mn4+ per formula unit, and , and are their respective moments.
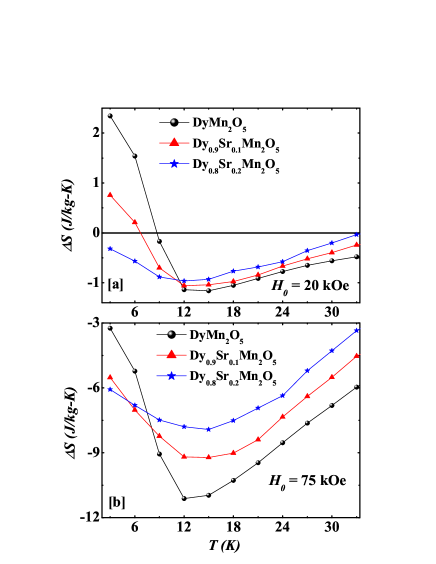
Fig. 3 (b) shows the versus isotherms recorded at 3 K for the studied samples. For the pure sample, an anomaly is observed around 20 kOe, which slowly disappears for the doped samples [see inset of fig. 3 (b)]. The value of at the maximum applied ( = 150 kOe) decreases systematically with increasing Sr concentration, which is clear from the values recorded in table 1. However, none of the samples shows full saturation even at a field as high as 150 kOe. The pure sample shows a coercive field of = 1.49 kOe at 3 K, which also gradually increases with increasing (see table 1).
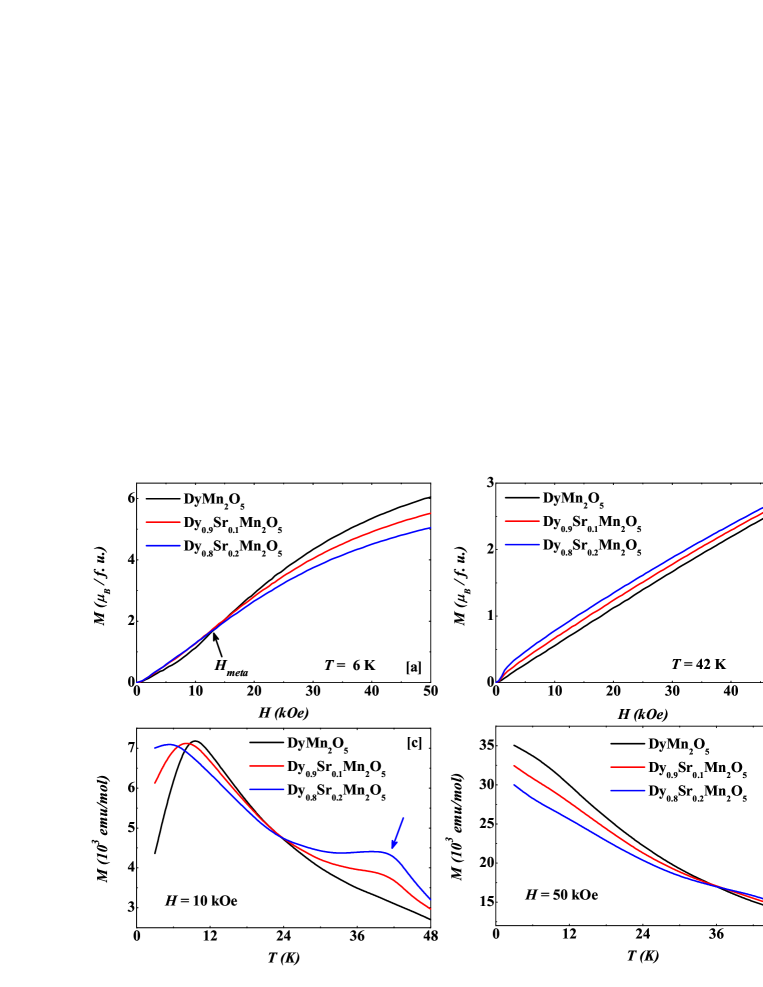
To ascertain the magnetic nature of the pure and the doped samples, we compared magnetic isotherms of all three samples at 42 K and 6 K, which are respectively shown in figs. 4 (a) and (b). In the 6 K, isotherm, the metamagnetic transition occurs at a slightly lower field of 15 kOe, where curves of all three samples intersect with each other. is higher for the doped samples below 15 kOe, while pure sample attains a higher value of beyond 15 kOe. At 42 K (just below the PM to IC-AFM transition), the scenario is entirely different. Here is found to be higher in case of doped samples between 0 to 50 kOe of fields.
We have plotted the thermal variation of the magnetization of three samples recorded under the application of = 10 and 50 kOe [figs. 4 (c) and (d)]. At 10 kOe, the PM to IC-AFM transition near 43 K becomes prominent with increasing Sr concentration. Below about 24 K, magnitude of of the pure sample turns larger than the doped ones. Presumably, it is related to the development of Dy3+-Mn4+ interaction in this range of , and the doped samples with lower Dy concentration shows the lower value of . One important observation from fig. 4 (c) is that the peak around 9 K associated with the ordering of Dy sublattice shifts to lower with Sr substitution. The versus curves at 50 kOe [fig. 4 (d)] do not show any peak like feature around 43 K or 9 K transition points. The values of of the Sr-rich samples are found to be higher at higher temperatures (above 36 K), while they turn lower below the cross over point of 36 K.
| Parameters | = 0.0 | = 0.1 | = 0.2 |
|---|---|---|---|
| (/f.u.)(theo) | 12.35 | 11.83 | 11.31 |
| (/f.u.)(exp) | 12.42 | 12.1 | 11.7 |
| (K) | 23 | 17 | 5 |
| (/f.u.) | 8.3 | 7.8 | 7.2 |
| (kOe) | 1.49 | 2.91 | 3.55 |
| (Jkg-1K-1) | -11.2/-6.7 | -9.2/-5.8 | -7.9/-4.9 |
| ( = 75/50 kOe) |
Observing the sharp first-order phase transition around 9 K in the data and the existence of metamagnetism, we have investigated the magnetocaloric effect (MCE) of this system. Change in the magnetic entropy () with the application of is a measure of MCE. One can easily calculate it from magnetization data by using Maxwell’s relation
| (1) |
where denotes the entropy change for the change in from to . Pecharsky and Gschneidner Jr (1999) For this calculation, we have recorded isothermal data between 3 K to 40 K with 3 K interval [not shown in here] . Before every measurement, it was confirmed that the sample was in a thermally demagnetized state. This state was achieved by cooling the sample from PM region to 3 K and then heated back to the respective temperature of measurements in the absence of magnetic field. The same procedure was followed for the other two samples. Variation of with for = 20 and 75 kOe are plotted in figs. 5 (a) and (b) respectively. At 20 kOe, = 0.0 and 0.1 samples show both conventional and inverse MCE ( 0 and 0 respectively). The MCE is conventional down to 9 K and 7 K respectively for these two samples, below which turns positive. This change of sign in can be related to metamagnetism observed at low temperature (below 9 K). The = 0.2 sample shows a low- rise in like other members, but it remains negative down to the lowest- of measurement.
The parent sample shows a large value of at 75 kOe with a peak of magnitude 11.2 Jkg-1K-1 at 12 K. At = 50 kOe, the MCE is slightly less, but still has a significant value (6.7 Jkg-1K-1). The magnitude of MCE shows systematic decrement with increasing Sr concentration (see table 1). The MCE is found to be conventional ( 0) for all three samples at 75 kOe. We have calculated relative cooling power of the sample, which is defined as RCP = , where and are the peak value and peak width (full width at half maximum) of the curve. Pathak et al. (2010); Hernando et al. (2009) RCP is one of the important parameters for practical application in a refrigeration system. The calculated RCP is found to be 316 J/kg for the pure sample for = 75 kOe, which is comparable or higher than many other magnetocaloric materials among transition metal oxides. Phan and Yu (2007)
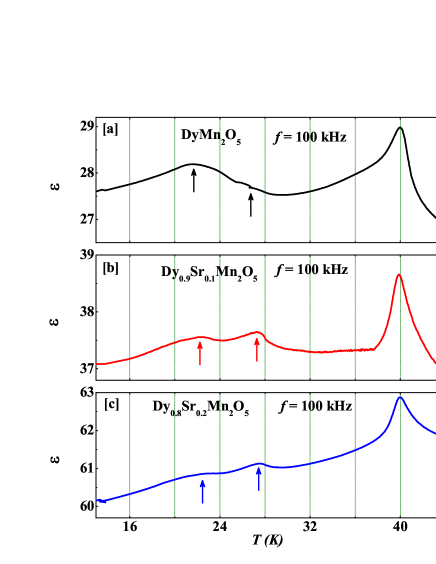
Since the parent sample is a well known multiferroic material, we have also addressed the impact of Sr doping in dielectric properties. was recorded as a function of at 100 kHz frequency for all the three samples and the data recorded between 14-46 K (heating leg) are shown in fig. 6). All three samples show a prominent peak at 40 K in , which is associated with the ferroelectricity driven by IC-AFM to C-AFM magnetic transition. The parent sample shows a weak kink like feature at around 27 K, which can be correlated with the inter-ferroelectric phase transition (FE1 to FE2). Higashiyama et al. (2004); Zhao et al. (2014a); Sushkov et al. (2014)
Interestingly, 27 K transition becomes much pronounced in the Sr-doped samples. The third anomaly in is observed in the form of a broad hump around 21 K, which signifies a transition to the third ferroelectric phase (FE3). The 21 K feature is strong in the pure sample and turns weaker on Sr doping.
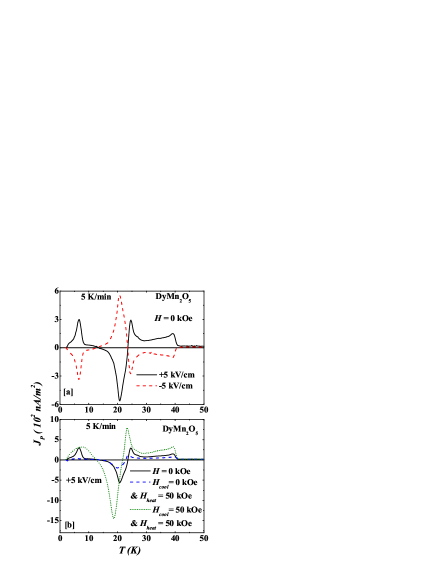
In order to ascertain the electric order and its correlation with the applied magnetic field, we have recorded as a function of in different protocols for the parent sample (as shown in fig. 7). In addition to the poling with an external electric field, the sample was field-cooled in magnetic field. Fig. 7 (a) shows the variation of of parent sample with in absence of any external . Reversal of with the sign of suggests the existence of electric order (ferroelectric/ferrielectric) in the sample. Our curves show number of anomalies at different transition temperatures which match well with the data as well as the previously published results Zhao et al. (2014a). The anomalies observed around 40 K, 25 K and 21 K (see fig. 7a) indicate paraelectric to FE1, FE1 to FE2, and FE2 to FE3 transition respectively. Whereas, peak around 7 K is related to the Dy3+ ordering temperature. Fig. 7 (b) shows the same of = 0 sample under external (under magnetic field-cooling and Zero-field-cooling). Interestingly, the 7 K peak completely vanishes when we have measured the in presence of 50 kOe magnetic field after being cooled in zero magnetic field. On the other hand, a broad hump like behaviour is observed around 7 K in magnetic field cooled heating data. This is a clear indication of the strong magneto-electric effect associated with the Dy ordering. One additional observation of field cooling is the large enhancement of the magnitude of around the peaks at 21 and 25 K. The 21 K and 25 K transition temperature are shifted to lower , whereas the 40 K transition remains almost unchanged under . This indicates that the PE to FE1 transition is less susceptible to an external magnetic field. It is evident that vanishes at the lowest , which is connected to the ferrielectric nature of the samples. We refrained from calculating polarization by integrating our data, as the technique may be inapplicable to the present ferri-electric materials. Higashiyama et al. (2004)
IV Summary and conclusions
We observe several changes in magnetic and dielectric properties on doping Sr at the Dy site of the exotic multiferroic material, DyMn2O5. The most noticeable changes on Sr doping are: (i) there is a large enhancement of the magnetic anomaly at the paramagnetic to IC-AFM transition around 43 K, and (ii) the coercive field of the sample recorded at 3 K increases systematically. These indicate that Sr substitution enhances the FM correlation in the system. As already mentioned, Mn4+O6 octahedra form ribbons running along the axis, and neutron diffraction data indicate that the -component of the Mn4+ moments are aligned ferromagnetically. In the plane, Mn4+ ions are separated by Mn3+ ions, and the interaction is AFM. On replacing Dy by divalent Sr, the fraction of Mn4+ ions gets increased. Since there exists an FM component in Mn4+-Mn4+ interaction, it can lead to the increase of the overall ordered moment, which gets reflected at the 43 K transition. It is to be noted that Mn4+-Mn4+ direct exchange also favors an FM alignment. On doping Sr at the Dy site, the Mn4+-Mn4+ bond distance decreases (the change is about 9%, and it is depicted in fig. 2), paving the path for stronger direct exchange and consequently enhanced FM moment. The same argument explains the increased coercive field in Sr-doped samples.
Contrary to the change observed around 43 K, the transition at 9 K becomes weaker with Sr doping. This is understandable as Dy sublattice gets diluted with Sr substitution. The metamagnetic transition observed below the ordering of Dy-sublattice, also gets weaker with Sr substitution due to the same mechanism. If one compares the isothermal versus behavior of the studied samples at 3 K, is found to be higher in the maximum doped sample at the lower field (precisely below the metamagnetic transition field ), while for the pure sample dominates above . This is related to the effect of two factors, namely, (i) enhanced FM component and (ii) weaker metamagnetism in doped samples. At lower fields () is large in doped samples due to the excess FM component originating from Mn4+ ions. While beyond , stronger FM component in the pure sample from Dy sublattice (the FM component originates from the alignment of Dy moments by ) makes to be lower in Sr-doped compositions.
One crucial observation is the occurrence of large MCE peaking around 12 K for all the samples. At low values of a field change (0 to 20 kOe), the pure and 10% doped samples show a positive value of (inverse MCE) below 9 and 7 K respectively. Such inverse MCE is clearly related to the C-AFM phase of the Dy-sublattice, which disappears at higher fields due to metamagnetic transition (see fig. 4 (b)). The large conventional MCE (negative ) at higher fields (beyond 20 kOe) is clearly related to the metamagnetic transition of the Dy sublattice. It reduces with the Sr doping due to the dilution of the rare-earth moment.
The dielectric anomaly observed in DyMn2O5 also get influenced by the Sr doping. The most important changes are found between 20 to 30 K. Previous literature claimed that DyMn2O5 undergoes FE1 to FE2 transition at 28 K, and there is also report of a change in the magnetic structure at the same temperature. For the pure sample, we see a weak feature in our versus data around 27 K and it is consistent with the feature reported by other groups on polycrystalline sample. Zhao et al. (2014a) The pure sample also shows another feature just above 21 K, which was earlier found to be related to FE2 to FE3 transition. On Sr doping, we find that the feature at 20 K turns weaker, and a strong peak arises around 28 K. It is possible that Mn4+ favors the FE2 phase, resulting an enhanced anomaly at 27 K. Zhao et al. (2014a, b, 2015)
The pyroelectric current measurement provide us with some important insight on the interesting material. Firstly, application of = 50 on the zero-field-cooled state destroys the peak in at 7 K. This is possibly connected to the metamagnetic transition observed in the sample around 20 kOe. The resulting magnetic structure may antagonize the ferri-electric order at low temperature. Secondly, the peaks observed in between 20 and 25 K corresponding to FE2 to FE3 and FE2 to FE1 transitions get strongly modified with the applied . This supports the view of Ratcliff II et al. Ratcliff II et al. (2005), who observed simultaneous changes in magnetic structure at those multiple FE transitions.
In conclusion, we have successfully doped Sr at the Dy site of DyMn2O5. The magnetic and dielectric properties show some systematic changes with the Sr concentration. We attribute these changes to the dilution of Dy sublattice as well as enhanced FM interaction due to the increase in Mn4+ ions in the system.
V Acknowledgment
P. Dutta would like to thank Science and Engineering Research Board, India for his national postdoctoral fellowship (project number PDF/2017/001061). M. Das thanks CSIR, India for her research fellowship. This work is supported by the financial grant from DST-SERB project (EMR/2017/001058). Authors would also like to thank Department of Science and Technology, India for low temperature high magnetic field facilities at UGC-DAE Consortium for Scientific Research, Kolkata Centre.
References
- Abrahams and Bernstein (1967) S. C. Abrahams and J. L. Bernstein, J. Chem. Phys. 46, 3776 (1967).
- Higashiyama et al. (2004) D. Higashiyama, S. Miyasaka, N. Kida, T. Arima, and Y. Tokura, Phys. Rev. B 70, 174405 (2004).
- Hur et al. (2004a) N. Hur, S. Park, P. A. Sharma, S. Guha, and S.-W. Cheong, Phys. Rev. Lett. 93, 107207 (2004a).
- Cruz et al. (2006a) C. R. d. Cruz, F. Yen, B. Lorenz, M. M. Gospodinov, C. W. Chu, W. Ratcliff, J. W. Lynn, S. Park, and S.-W. Cheong, Phys. Rev. B 73, 100406(R) (2006a).
- Hur et al. (2004b) N. Hur, S. Park, P. A. Sharma, J. S. Ahn, S. Guha, and S.-W. Cheong, Nature 429, 392 (2004b).
- Inomata and Kohn (1996) A. Inomata and K. Kohn, J. Phys.: Condens. Matter 8, 2673 (1996).
- Nakamura and Kohn (1997) N. Nakamura and K. Kohn, Ferroelectrics 204, 107 (1997).
- Chattopadhyay et al. (2016) S. Chattopadhyay, V. Bal´edent, F. Damay, A. Gukasov, E. Moshopoulou, P. Auban-Senzier, C. Pasquier, G. Andr´e, F. Porcher, E. Elkaim, C. Doubrovsky, M. Greenblatt, and P. Foury-Leylekian, Phys. Rev. B 93, 104406 (2016).
- Yang et al. (2016) L. Yang, X. Li, M. F. Liu, P. L. Li, Z. B. Yan, M. Zeng, M. H. Qin, X. S. Gao, and J.-M. Liu, Sci. Rep. 6, 34767 (2016).
- Sanina et al. (2011) V. A. Sanina, E. I. Golovenchits, V. G. Zalesskii, and M. P. Scheglov, J. Phys.: Condens. Matter 23, 456003 (2011).
- Kagomiya et al. (2002) I. Kagomiya, K. Kohn, and T. Uchiyama, Ferroelectrics 280, 131 (2002).
- Cheong (2007) M. Cheong, S. W.and Mostovoy, Nat. Mater. 6, 13 (2007).
- Brink and Khomskii (2008) J. v. d. Brink and D. I. Khomskii, J. Phys.: Condens. Matter 20, 434217 (2008).
- Balédent et al. (2015) V. Balédent, S. Chattopadhyay, P. Fertey, M. B. Lepetit, M. Greenblatt, B. Wanklyn, F. O. Saouma, J. I. Jang, and P. Foury-Leylekian, Phys. Rev. Lett. 114, 117601 (2015).
- Noda et al. (2008) Y. Noda, H. Kimura, M. Fukunaga, S. Kobayashi, I. Kagomiya, and K. Kohn, J. Phys.: Condens. Matter 20, 434206 (2008).
- Radaelli and Chapon (2008) P. G. Radaelli and L. C. Chapon, J. Phys.: Condens. Matter 20, 434213 (2008).
- Chattopadhyay et al. (2017) S. Chattopadhyay, S. Petit, E. Ressouche, S. Raymond, V. Balédent, G. Yahia, W. Peng, J. Robert, M.-B. Lepetit, M. Greenblatt, and P. Foury-Leylekian, Sci. Rep. 7, 14506 (2017).
- Blake et al. (2005) G. R. Blake, L. C. Chapon, P. G. Radaelli, S. Park, N. Hur, S.-W. Cheong, and J. Rodríguez-Carvajal, Phys. Rev. B 71, 214402 (2005).
- Zhao et al. (2014a) Z. Y. Zhao, M. F. Liu, X. Li, L. Lin, Z. B. Yan, S. Dong, and J. M. Liu, Sci. Rep. 4, 3984 (2014a).
- Ratcliff II et al. (2005) W. Ratcliff II, V. Kiryukhin, M. Kenzelmann, S.-H. Lee, R. Erwin, J. Schefer, N. Hur, S. Park, and S.-W. Cheong, Phys. Rev. B 72, 060407(R) (2005).
- Sushkov et al. (2014) A. B. Sushkov, C. Kant, M. Schiebl, A. M. Shuvaev, A. Pimenov, A. Pimenov, B. Lorenz, S. Park, S.-W. Cheong, M. Mostovoy, and H. D. Drew, Phys. Rev. B 90, 054417 (2014).
- Lutterotti et al. (1997) L. Lutterotti, S. Matthies, H.-R. Wenk, A. S. Schultz, and J. W. Richardson, J. Appl. Phys. 81, 594 (1997).
- Mihailova et al. (2005) B. Mihailova, M. M. Gospodinov, B. Güttler, F. Yen, A. P. Litvinchuk, and M. N. Iliev, Phys. Rev. B 71, 172301 (2005).
- Cruz et al. (2006b) C. R. d. Cruz, F. Yen, B. Lorenz, S. Park, S.-W. Cheong, M. M. Gospodinov, W. Ratcliff, J. W. Lynn, and C. W. Chu, J. Appl. Phys. 99, 08R103 (2006b).
- Pecharsky and Gschneidner Jr (1999) V. K. Pecharsky and K. A. Gschneidner Jr, J. Mag. Mag Mater. 200, 44 (1999).
- Pathak et al. (2010) A. K. Pathak, I. Dubenko, H. E. Karaca, S. Stadler, and N. Ali, Appl. Phys. Lett. 97, 062505 (2010).
- Hernando et al. (2009) B. Hernando, J. L. Sánchez Llamazares, V. M. Prida, D. Baldomir, D. Serantes, M. Ilyn, and J. González, Appl. Phys. Lett. 94, 222502 (2009).
- Phan and Yu (2007) M.-H. Phan and S.-C. Yu, J. Mag. Mag Mater. 308, 325 (2007).
- Zhao et al. (2014b) Z. Y. Zhao, M. F. Liu, X. Li, J. X. Wang, Z. B. Yan, K. F. Wang, and J. M. Liu, J. Appl. Phys. 116, 054104 (2014b).
- Zhao et al. (2015) Z. Y. Zhao, Y. L. Wang, L. Lin, M. F. Liu, X. Li, Z. B. Yan, and J. M. Liu, J. Appl. Phys. 118, 174105 (2015).